Balázs Dukai; Giorgio Agugiaro; Clara García-Sánchez; en Jantien Stoter
Abstract
The ability to translate our physical world into a virtual reality has become a valuable asset in the design, planning, visualisation and management of data for a wide range of urban and architectural applications. By way of example, 3D city models have been used to estimate population size, energy consumption, pollutant distributions, solar potential, perform shadow analyses, and simulations on wind flow distribution and noise impact. Rapid population growth and urbanisation is increasing the demand for more detailed 3D models that can help improve urban development and design. 3D city models offer a virtual copy of reality in which different development scenarios can be simulated before construction, to determine their impacts on noise, heat stress, pollution or other factors. The aim of this chapter is to give an overview on the place of GIS within urban data research, in particular 3D city models. This chapter is structured in five parts. After the Introduction we present two cases to show how 3D models can be used. In the fourth section we explore future possibilities of urban data research. Finally we give several tips and references where you can learn more on GIS and 3D modelling.
Introduction to GIS and 3D city models
As humans, our environment shapes us, it defines us. In order to truly understand people, one needs to understand their environment, their history too. This is equally true for buildings, neighbourhoods, cities and landscapes. In this pursuit of understanding their environment, Geographical Information Systems (GIS) can play a key role in bringing in data and analytical tools.
Simply stated, GIS is a set of tools specifically designed for working with spatial data. Note that the emphasis is on the data, which is the key component in GIS. Within this lies the biggest contrast to CAD tools. While CAD helps in creating new designs, GIS helps in understanding the existing. Therefore, in GIS one usually does not “draw”, but analyses objects and their relationships to each other and their environment. The two most common GIS software are QGIS and ArcGIS.
Spatial data, or GIS data exists in various forms. There is a common component to it all, location. In order to accurately represent, and have a common reference of the location of real world objects in a map, we use Coordinate Reference Systems (CRS). Representing some part of the real world is called “modeling”. Depending on what is modeled, spatial data can be stored in various formats. For phenomena that have value at every location, like precipitation or soil types, raster formats are the most suitable. Regular images are stored in a raster format as well, where every pixel has three color values, Red, Green and Blue (RGB). In GIS raster data, each pixel represents a specific area (eg. 5×5 m) at a specific location of the real world, and we can assign any value to the pixel, for instance the temperature at the location. For discrete objects, like most man-made objects or trees, usually vector formats are the best choice. GIS vector data is very similar to CAD data, as the objects are composed of points, lines and polygons. However, key aspects in GIS data are the reference to real locations through CRS, and the presence of attributes. Any additional data can be assigned to the geometry of an object, and the geometry together with its attributes and location provide a powerful way to store spatial information.
A semantic 3D city model is a specialised type of GIS data, commonly used to store information about our built environment. Thus, a 3D city model is a 3D vector representation of an urban area that depicts its landscape and architectural infrastructure. The geometry and structure of all main urban elements, such as the terrain, roads, water bodies, and buildings are described by 3D geospatial data. The word semantic refers to the notion that in these models we often assign their meaning to the parts of the object, like wall or roof surfaces. In addition, it is possible to include as attributes the year of construction of a building, the number of people living in a building and the construction materials, essential information for circular economy workflows or energy consumption. Such semantically enriched 3D city models represent powerful integrated information hubs, opening new opportunities to improve current computer-based urban analysis and design proposal evaluation. In the next sections we will present and discuss two examples of how you could use 3D city models.
Using 3D city models in the built environment
Urban wind and dispersion predictions
Current challenges posed by climate change combined with urbanization rates are pushing the comfort boundaries of our cities, affecting among others pedestrian wind and thermal comfort and air quality surrounding us. Fortunately, 3D city models, which virtually represent urbanizations, combined with Computational Fluid Dynamic (CFD) models, that model flows such as wind and dispersion, open a new dimension to explore multiple potential improvements in urban designs before their implementation.
In general, computational fluid dynamic models solve fluids dynamics equations numerically (so-called Navier-Stokes equations) with a computer allowing us to predict fluid movements. We refer to fluid as any liquid (like water) or gas (like air). Flow distributions are particularly interesting around building layouts, due to the flow separations drastically caused by buildings presence. Thus, there are a few good reasons to analyze wind distributions around urban areas. For example winds are often evaluated when tall buildings are planned for construction (European Standard 2010), and although this analysis can be performed by means of wind tunnel experiments (Blocken et al. 2016), computational fluid dynamic models can be used to evaluate several prior configurations, since you just need a fairly good computer and a few hours at hand. A pretty close example to us would be the Elektrotechniek, Wiskunde en Informatica building (known as EWI building) on the TU Delft campus. It is widely known that around that building winds get so high that it is difficult to walk or bike certain days of the year (Kenjereš and ter Kuile, 2013). During the academic course 2019-2020, within the GEO5013 course (3D city modelling for urban applications, MSc in Geomatics) we focused on analyzing how idealized layout changes around the EWI building will affect the winds.
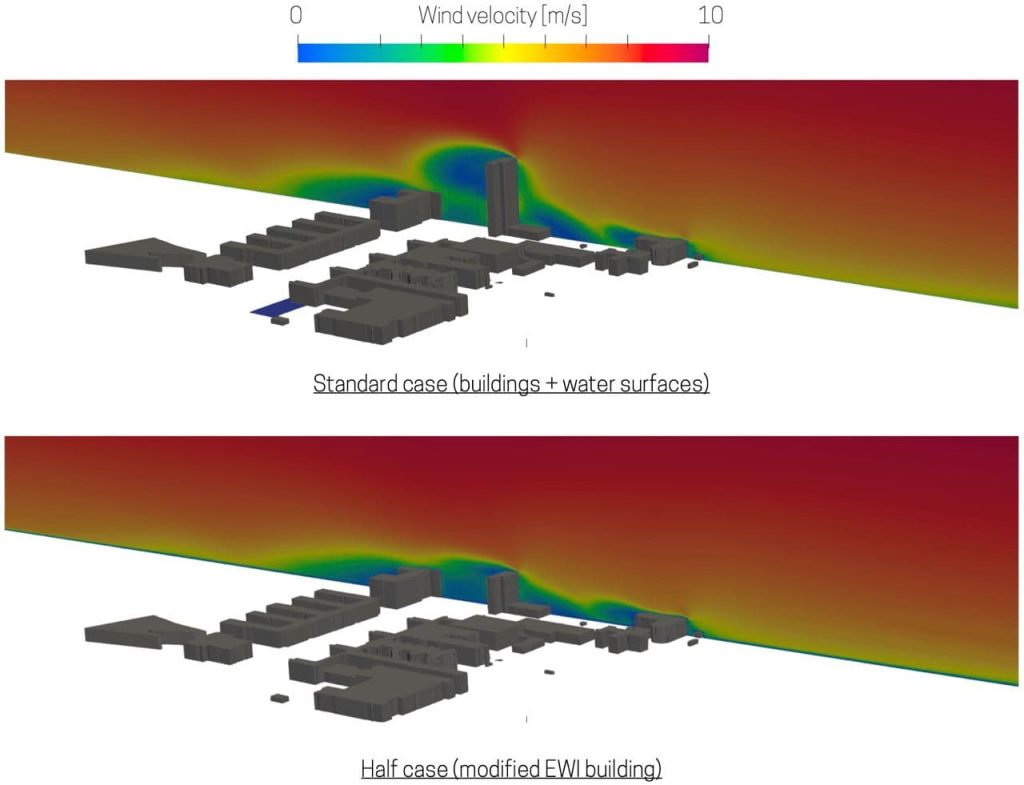
Figure 11.1 introduces one of the cases studied, where the reduction of the height of the EWI building (in the rightmost picture), led to lower wind velocities between the buildings at pedestrian level.
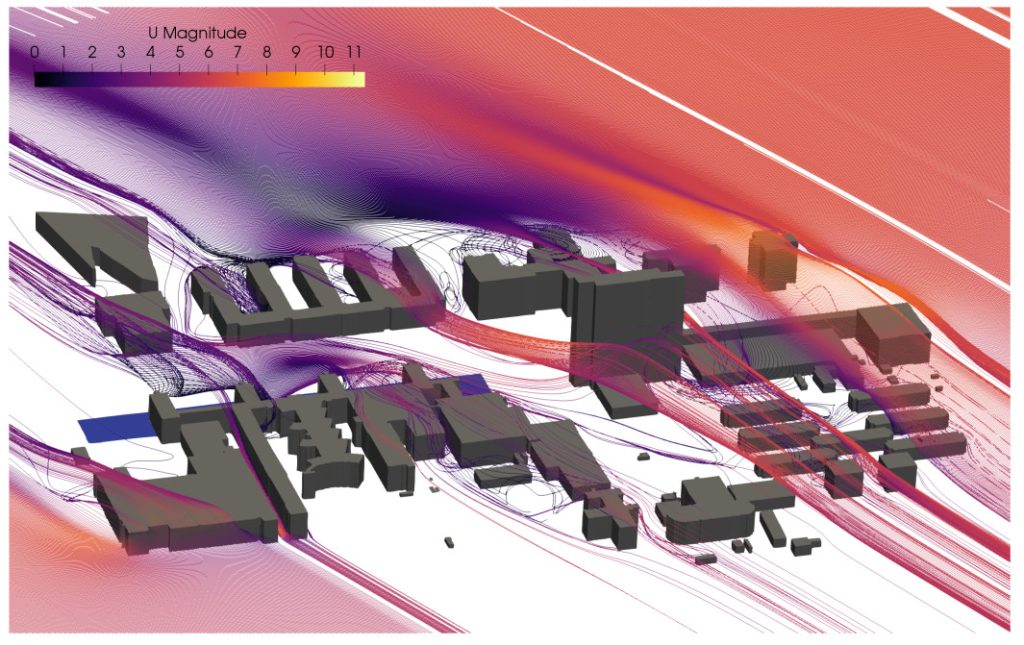
Figure 11.2 introduces a 3D visualization of those wind speeds. Here we can observe how as you separate from the surface, the wind speeds become larger and larger, and how the wind is canalized through the passage between the EWI building and the faculty of Mechanical, Maritime and Materials Engineering building (3mE building). These analyses were done in simplified models and for learning purposes, but they remarkably show the potential of CFD to evaluate urban configurations. Current 3D city models are more detailed, including information related to vegetation and different surfaces, such as concrete or grass. These attributes are currently being used in research performed with CFD, to analyze their effects in wind and dispersion predictions.
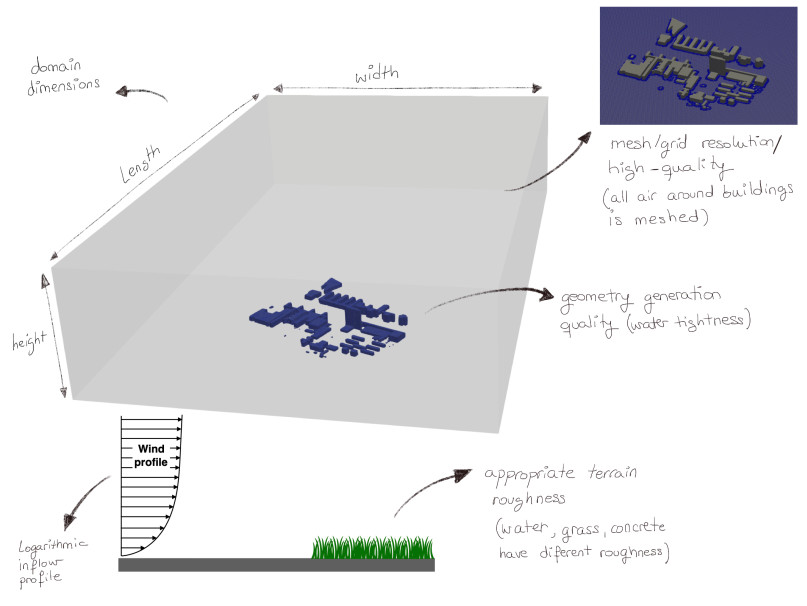
If you are further interested in learning computational fluid dynamic techniques a short list of useful links is included at the end of this chapter. In the meantime, please allow me to enumerate a few important considerations when running CFD based on best practice guidelines (Blocken 2015):
- Define an appropriate domain size.
- Generate a high-quality mesh.
- Set up an appropriate roughness length for the terrain.
- Appropriate logarithmic inflow profile for velocity.
- Use high order discretization schemes (mathematics accuracy when modeling the equations)
City-wide estimation of heating demand of residential buildings
City-wide energy planning is confronted with complex questions regarding different spatial and temporal scales (e.g. from a single building to the whole city, from season-dependent phenomena to a planning horizon of several decades). For example, buildings alone are responsible for circa 40% of the total energy consumption, of which about 68% is used by households alone, mainly for space heating, cooling, domestic hot water preparation, cooking and appliances. Therefore, detailed analysis of the building stock is a good candidate for significant energy savings. At the building level, it is crucial to identify inefficient buildings, to increase their energy efficiency (e.g. by refurbishment) and to simulate and evaluate the impact of these refurbishment measures. At district or city scale, another set of intertwined challenges emerges and needs to be investigated and tackled. For example, it is important to know how to deal with construction and extension of supply and utility infrastructures, how to choose between different types of energy production and distribution technologies. Finally, a city may want to simulate different energy scenarios according to different energy policies, or to evaluate the energy performance of a city and quarter respectively.
Answering these questions calls for a deep understanding of the complex system interdependencies at urban level and requires a thorough information of the demand and supply of energy resources, comprising their spatial distribution. Nowadays, precise information about all characteristics of a single building can be organised in a BIM (Building Information Model). However, moving from the single-building dimension to the urban scale is theoretically feasible, but in reality nearly impossible, as complete city-wide data for each building are not available.
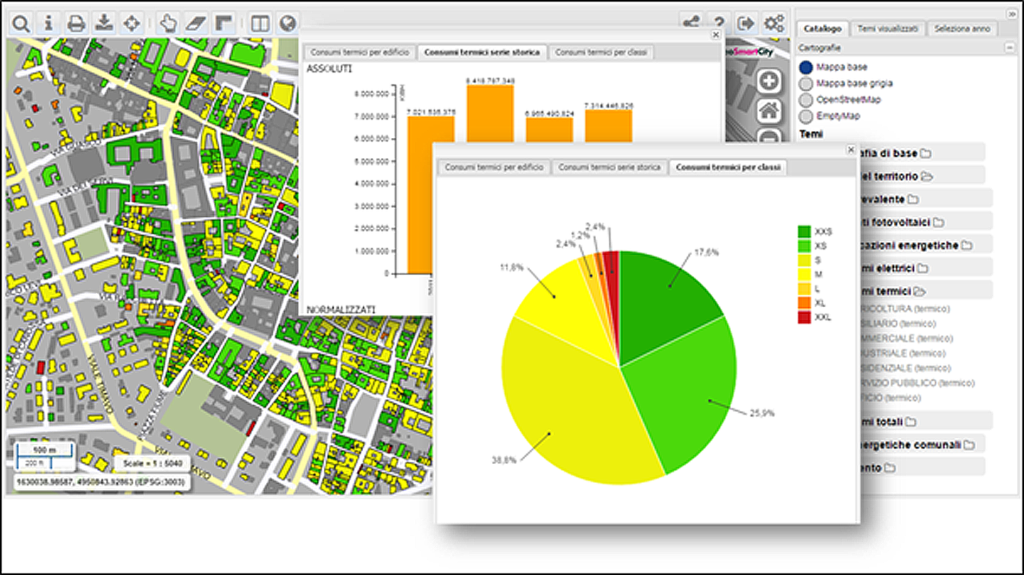
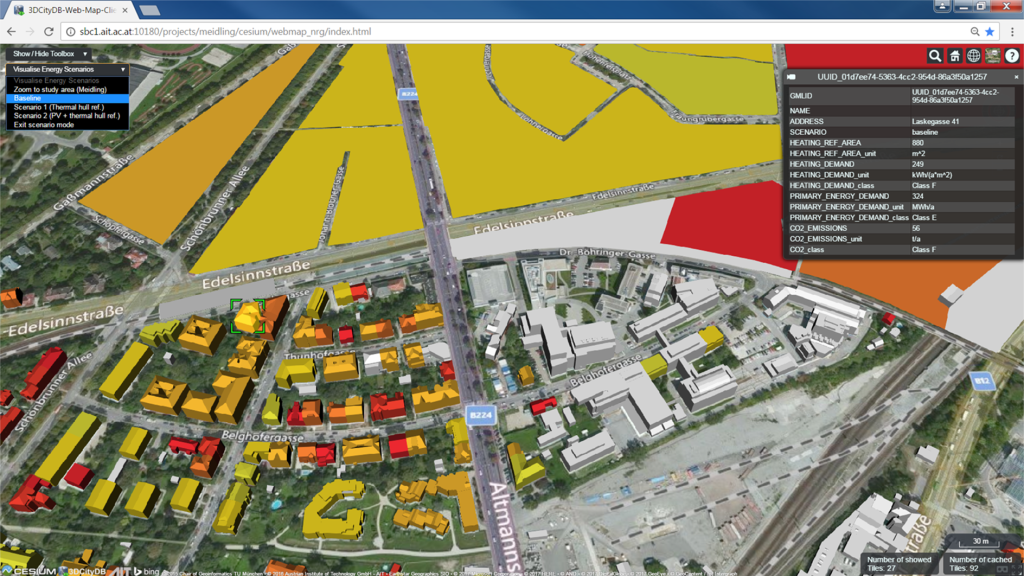
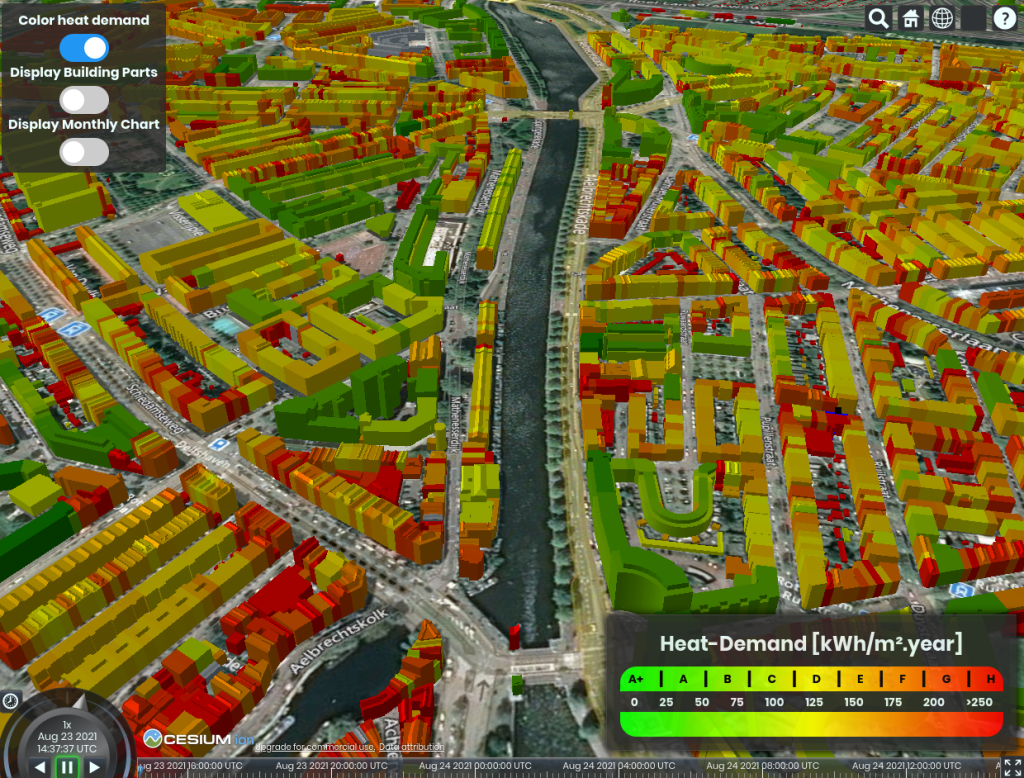
Semantic 3D city models allow to narrow the aforementioned knowledge gap by means of integrating geodata regarding building geometrical and thermo-physical properties with census, cadastral, statistical and other data sources, in order to better characterise each building (also) for energy simulation purposes. Carrión et al. (2010) and Strzalka et al. (2011) have conducted some initial investigation on the use of semantic 3D city models for energy simulations. In the last decade, a number of projects have been carried out using a semantic 3D city model as a source of integrated information to assess the energy efficiency of the building stock and to quantify the energy saving potential for different refurbishment scenarios. A common characteristic of all these projects is that they invert the classical top-down approach as seen so far in the past decades, and propose a more detailed, mostly bottom-up, modelling approach, which generally starts at the building level in terms of granularity and spatial resolution (Agugiaro et al. 2018). The project “Energy Atlas Berlin” (Krüger and Kolbe, 2012) created a city-wide energy atlas, focussing on space heating energy demand for residential buildings. Successively, the approach was extended to total energy demand (Kaden and Kolbe, 2013). Other conceptually similar examples exist for the cities of Stuttgart, Hamburg, Karlsruhe, Ludwigsburg in Germany, Lyon in France (Nouvel et al. 2013; Bahu et al. 2013), Reggio Emilia (Figure 11.4) and Trento in Italy (Agugiaro, 2016), Vienna in Austria (Figure 11.5) and Geneva in Switzerland (Agugiaro et al., 2017), Rotterdam in the Netherlands (Figure 11.6), and Helsinki in Finland (Rossknecht and Airaksinen, 2020).
In general terms, the workflow to perform the analysis of the energy performance of the building stock can be summarised in the following points:
- The geometries representing the building stock are classified semantically by distinguishing roof surfaces from wall surfaces and ground surfaces and used to compute parameters such as inclination, orientation and area of outer and shared surfaces. If no other sources of information are available, the geometrical data is used to extract further parameters such as the enclosed gross volume, the gross and net floor area, the number of storeys, and to estimate the area of the glazing surfaces;
- Buildings are then classified according to their age (depending on the year of construction) and their type (e.g., in the case of residential buildings: single-family house, terraced house, apartment block, etc.). Physical properties (e.g. U-values, g values) are then associated with the corresponding elements of the building envelope;
- Generally, additional information about occupancy, installed energy systems and weather data is also collected and used;
- Once the dataset is prepared, different approaches exist to estimate the energy demand. At urban scale, the most common is one based on a simplified quasi-static energy demand estimation based on the energy balance method. It delivers yearly (or monthly) values – which generally suffice for urban planning applications. If historical data on energy consumption exist, the model can be validated in order to enhance its accuracy;
- Once results are computed, they can be integrated back into the 3D city model and explored. They can be used to perform further analyses.
Outlook to the future
The fast-growing availability of data about our environment will offer new ways for designing, producing, and managing buildings, cities and landscapes. The optimal use of data models in design and planning requires understanding of the potentials of such data and tools, but as important is the understanding of the limitations of data and consequences of these limitations.
As a future professional, you will regularly encounter questions, such as: what data is where available; what is the spatio-temporal resolution of the data; how to access and use the data in urban applications; what is the quality of the data and how does that influence the outcome of urban applications?; how to integrate (city-scale) 3D city models with detailed architectural models of individual buildings?
Through automation, planners and designers can be relieved from basic design tasks (i.e. small iterative tasks, drafting, can be automated). This provides the designer with more time for the actual design process. In addition, reusing (digital) designs and plans enables us to build on available knowledge. There is a lot of human knowledge embedded in existing designs. With AI, a computer could be trained with such designs to generate and offer optimal solutions for sub-problems within the design process.
This will not threaten the profession of designers and planners as human creativity and professional knowledge will always be needed to decide on the open-ended solutions proposed by such computer processes. Therefore, data-supported designs and urban plans will facilitate better designs/plans rather than limiting such processes. (Basic) programming and data skills are needed to keep the designer of the future indeed in control of this process.
Designers and planners are not only consumers of spatial information. During the design and planning process they also create new data. By sharing their data, technologies as described above can be further developed and new designs and plans can be built on past insights resulting in improved plans and designs. Data sharing beyond individual projects, software and organisations requires answering questions regarding (protection of) security, privacy, accountability, authorship, copyright (what to share), artistic identity and standards.
Suggestions for learning more about GIS and 3D modelling
To learn details about the main GIS concepts and the use of the QGIS software at the same time, we recommend the Gentle Introduction to GIS.
- https://docs.qgis.org/3.16/en/docs/gentle_gis_introduction/index.html
As a thorough introductory textbook on GIS, we recommend the Principles of geographic information systems : an introductory textbook.
- Huisman, O., & de By, R. A. (2009). Principles of geographic information systems : an introductory textbook. (ITC Educational Textbook Series; Vol. 1). International Institute for Geo-Information Science and Earth Observation. http://www.itc.nl/library/papers_2009/general/PrinciplesGIS.pdf
Most of the Dutch open spatial data is hosted on the PDOK platform: https://www.pdok.nl/
The 3D model of all buildings in the Netherlands can be found: https://3dbag.nl . In the documentation you can read about the data set and learn how to use it: https://docs.3dbag.nl
To dig deeper in computational fluid dynamics, we recommend these material:
- Delft courses to learn how to use Computational Fluid Dynamics: GEO5015 Modelling wind and dispersion in urban environments. You can find more info at: https://3d.bk.tudelft.nl/gsclara/
- Online courses: https://www.coursera.org/learn/sports-building-aerodynamics (Prof. Blocken). Best practice guidelines in CFD: https://www.sciencedirect.com/science/article/abs/pii/S0360132315000724?via%3Dihub
- Fundamental equations and modeling: CFD Python: 12 steps to Navier-Stokes :: Lorena A. Barba Group
To learn the basics of computational thinking and programming, we recommend the online course Introduction to Computer Science and Programming Using Python on the edX platform. It is a challenging course, but provides very solid foundations for those who are interested in programming. https://www.edx.org/course/introduction-to-computer-science-and-programming-7
For more examples on using 3D city models for urban research, browse through the projects on the website of the 3D geoinformation research group: https://3d.bk.tudelft.nl/
References
Agugiaro, G., (2016). Energy planning tools and CityGML-based 3D virtual city models. Experiences from Trento (Italy). Applied Geomatics, 8(1), pp. 41-56. Springer Berlin Heidelberg. ISSN: 1866-928X.
Agugiaro, G., Benner, J., Cipriano, P., Nouvel, R., (2018). The Energy Application Domain Extension for CityGML: Enhancing interoperability for urban energy simulations. Open Geospatial Data, Software and Standards, 2018 3:2. SpringerOpen, United Kingdom.
Agugiaro, G., Robineau, J.-L., Rodrigues, P., (2017). Project CI-NERGY: Towards an integrated energy urban planning system from a data modelling and system architecture perspective. ISPRS Ann. Photogramm. Remote Sens. Spatial Inf. Sci., IV-4-W3, pp. 5-12.
Bahu JM, Koch A, Kremers E, Murshed SM (2013). Towards a 3D spatial urban energy modelling approach. ISPRS Ann. Photogramm. Remote Sens. Spatial Inf. Sci. II-2/W1:33–41.
Blocken, B., (2015). Computational Fluid Dynamics for urban physics: Importance, scales, possibilities, limitations and ten tips and tricks towards accurate and reliable simulations, Building and Environment, 91, 219-245, https://doi.org/10.1016/j.buildenv.2015.02.015.
Blocken, B., et al. (2016). Pedestrian-level wind conditions around buildings: Review of wind-tunnel and CFD techniques and their accuracy for wind comfort assessment, Building and Environment, 100, 50-81, https://doi.org/10.1016/j.buildenv.2016.02.004.
Carrión D, Lorenz A, Kolbe TH (2010). Estimation of the energetic rehabilitation state of buildings for the city of Berlin using a 3D City Model represented in CityGML. ISPRS Int. Arch. Photogramm. Remote Sens. Spatial Inf. Sci. 38(4/W15):31–35.
European Standard (2010). Eurocode 1: Actions on structures – Part 1-4: General actions – wind actions, EN 1991-1-4:2005+A1.
Kaden R, Kolbe TH (2013). City-wide total energy demand estimation of buildings using Semantic 3D city models and statistical data. ISPRS Ann. Photogramm. Remote Sens. Spatial Inf. Sci. II-2/W1:163–171.
Kenjereš, S. and ter Kuile, B., (2013). Modelling and simulations of turbulent flows in urban areas with vegetation, Journal of Wind Engineering and Industrial Aerodynamics, 123, 43-55, https://doi.org/10.1016/j.jweia.2013.09.007.
Krüger A, Kolbe TH (2012). Building analysis for urban energy planning using key indicators on virtual 3D city models – the Energy Atlas of Berlin. ISPRS Int. Arch. Photogramm. Remote Sens. Spatial Inf. Sci., 39(B2):145–150.
Nouvel R, Schulte C, Eicker U, Pietruschka D, Coors V (2013). CityGML-based 3D city model for energy diagnostics and urban energy policy support. In: Proc. IBPSA World 2013.
Rossknecht, M., Airaksinen, E., (2020). Concept and Evaluation of Heating Demand Prediction Based on 3D City Models and the CityGML Energy ADE—Case Study Helsinki. ISPRS International Journal of Geo-Information. 2020; 9(10):602.
Strzalka A, Bogdahn J, Coors V, Eicker U (2011). 3D City modeling for urban scale heating energy demand forecasting. HVAC&R Research, 17(4):526–539.
