Growing Boys
“But, when the contrary, the force of the anima advances and overcomes the air in such a way as to push and move it quickly, the voice must be produced high. From this can arise the cause why little boys and girls have little voices high.”
Giovanni Maffei, 1562.
Let us begin with that most significant of all empirical beliefs, that boys’ voices are at their best just before they break. The closing decades of the twentieth century saw much activity by those who sought to classify boys’ voices according to the stage of puberty they had reached. Irvine Cooper, originator of the cambiata concept (of which more later), was one of the more influential of these. Indeed, his work has strongly influenced my own thinking, understanding and career. It also influenced the most well-known of his students, John Cooksey (d2012). Cooksey’s six stages of voice during puberty are familiar to many, often consulted and influential in practice. They remain generally well-regarded and much of my own work has replicated Cooksey’s findings. Cooksey’s work will be referred to regularly throughout the remaining chapters. First, we need to understand a little more of the biology of “boy”.
The word “boy” is more of a social term than a biological or medical one. It is not uncommon in choral work for the words “boy” and “treble” to be used interchangeably, but this is not helpful. A young male who sings a soprano or perhaps alto line could be either a child or an adolescent. If he is one of those accomplished young singers that Lucian Nethsinga sees as “tending to reach his peak around Y8” (see Chapter 1) he will be an adolescent, not a child. Boys, it is often said, do not want to “sound like girls”, but until adolescence, boys’ and girls’ voices are physically the same. Any perceived differences in children’s voices will be learned cultural ones, not biological ones. Adolescence is when voices diverge and the male singing adventure really begins.
Leon Thurman optimistically reminds us that Irvin Cooper and John Cooksey dedicated considerable time and energy in their lives to helping adolescent boys know that their voices—over their entire lives—are capable of skilled singing. “And, to know that each of them is a human being who is capable of speaking and singing (and moving) expressively from the heart, with rich empathy for their fellow human beings” (Thurman, 2013). These are noble sentiments, but they are not often put into practice. There are two reasons for this that we are going to need to explore in some depth. The first is that the adolescent who has been a useful treble may be dismissed from his choir when it is believed that his voice has “broken”. He may or may not continue to sing, but if he does his newly emerged “baritone” voice will compare unfavourably with his former treble voice and the adult voice he might hope for in the future. It will likely be dull, limited in range, lacking agility and weak in timbre. It takes a knowledgeable and committed teacher to help such a boy “sing expressively from the heart”.
This chapter is the result of my collaboration with consultant paediatric endocrinologist, Professor Gary Butler. It is about growth during adolescence, that period when childhood ends and the young man can begin work on the voice he will have for most of his life. I set out the essential medical facts in language that should be accessible to readers with little or no medical knowledge. Armed with this knowledge, those readers will be better prepared to open doors that were never open to boys whose careers ended with a “broken voice”.
Boys are not miniature men
The first thing that we need to understand is that boys grow both constantly and somewhat unevenly from the moment of conception until the final end of adolescence, which may not be until the early twenties. If a boy were simply a miniature man, his voice would not change. He would just gradually sing in a lower key all the while he was growing. We all know that this not what happens. If he is a choral singer he sings in the same range until he is about thirteen, then his voice “breaks” and he must choose a new range which is unlikely to last him until he reaches adulthood. More than this, his voice quite rapidly begins to sound not just deeper in pitch but quite different in timbre. There has been a complete change of fach, and more fach changes are to come. The term “break”, for various reasons, has fallen out of favour but it probably does describe what happens towards the end of puberty rather well. We are not dealing with a benign process of continuous change. If we are to understand this and make sufficient sense out of it to manage vocal development across the three phases of adolescence (early, 10 – 14; mid, 15 – 17; late, 18 – 25) we need to understand that all sorts of different aspects of growth occur at different rates. A boy is certainly not a miniature man.
This is illustrated in the table below. From left to right, the columns show growth as a percentage of adult size for height, weight, testes volume, length of the membranous portion of the vocal folds and length of the complete vocal tract. I have added an arrow to indicate that as we move across the table, we become less certain that our measurements are reliable. The heights of growing boys have been measured thousands of times across multiple populations. Measurement of the paediatric vocal tract is undertaken far less often, the methods for doing so are still largely experimental and the number of published studies is small. The same applies to the vocal folds. There are two sets of figures for fold length in the table which reflect different methods, giving results that are at best only broadly similar. Those reported by Titze were of cadavers studied by Kahane (1978), and Hirano (1980) whereas more recent measurements by Rogers et al (2014) were in vivo. Both methods present obvious difficulties for replication.
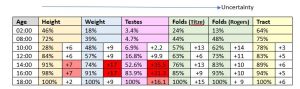
What should readily be apparent is that height and weight do not increase in proportion to each other. It is sometimes said that adult height can be predicted by doubling the height of a two-year-old. There is some truth in this because the average two-year-old (notwithstanding the fact that no actual living boy is average) has attained 46% of his average height. This reflects a phenomenal amount of growing during the first two years of life. Look across to the furthest right column and you will see that even this is eclipsed by the early growth of the vocal tract. A full 64% of adult length is achieved by age two, which is hard to believe. A descent of the larynx that does not occur in other primates is largely responsible. This is important for speaking and singing. If the tract did not grow so much during the earliest years of childhood, we would not be able to form the differentiated vowel sounds upon which all speech and singing depend.
What the table does not show is that the male larynx descends further immediately after puberty and the pharynx then grows faster to reaches significantly greater lengths than the female pharynx. The pharynges of boys and girls are almost the same before then. Let us return for now to weight growth. The red shading to the right of the column shows that a whole 34% of total (healthy) male body weight is gained between the ages of fourteen and sixteen. If we look at a twelve-year-old, we see that though he has reached 84% of his adult height, he is barely over half his adult weight. The weight growth between fourteen and sixteen is mainly due to increasing muscle mass. Our light, lanky twelve-year old is certainly not a miniature man by this criterion.
Also shown in red is the fact that nearly 67% of the growth of the testes occurs between the ages of fourteen and sixteen. There is hardly any increase in testicular volume (TV) up to the age of ten whilst an average twelve-year-old’s are still well under a quarter of their adult size. This rapid growth that begins at fourteen, in a nutshell, is puberty – the attainment of procreative capacity or sexual maturity. A twelve-year-old who is beginning this process would be described as peripubertal, whilst a ten year old whose testes have barely grown to reach only 6.9% of adult size would be prepubertal. Most people associate puberty with voice break, perhaps substituting the word “change” for “break”, but far fewer understand the matter sufficiently to understand why some long established empirical approaches to boys’ voices have been questioned by modern voice science.
The place to begin is the left hand column. Once the phenomenally fast height growth of infancy is over by approximate age two, height growth over the remaining years is relatively constant and linear. In particular, 12% of adult height is gained between ten and thirteen, then averaged out across the years growth rate increases only slightly so that a further 14% is then added up to sixteen. I have stressed “averaged out across the years” because when we measure regularly an individual we do see that this 14% is added in a stop/start manner that does not show on population growth charts, and is seen less in younger or older age groups.
As we shall see later, identification of these pubertal height spurts plays a critical role in understanding and managing the voice. The other point to note here is how closely the increase in vocal tract length (VTL) tracks height growth. VTL and particularly the length of the pharynx is critical in determining what vocal resonance is possible and might be attained. The matter might be reasonably straightforward were it not for the fact that the relationship between VTL and membranous vocal fold length (MFL) is fairly critical and MFL growth is currently a matter requiring further investigation. It had been assumed for quite a long time that the vocal folds grow faster during puberty but a recent study by Rogers et al (2014) was confident that there is no such pubertal growth spurt. Their study unusually made in vivo measurements of 205 anaesthetised paediatric subjects aged between one month and twenty years (57.6% male). They concluded that the most critical events of voice change cannot be explained by vocal fold length alone, other factors such as vocal fold layers needing further investigation, a point I had already raised before coming across their paper. I discuss my reasons shortly.
Difficult measurements
In vivo studies of anaesthetised children are rare and it is difficult to obtain approval for a procedure that does not potentially lead to life-saving discoveries. The ease with which measurements can be made decreases from left to right across the table. Testicular volume (TV) in the centre columns is considered to be the definitive measurement of male puberty. It is a relatively straightforward measurement for a suitably qualified paediatrician to make. However, as I stated in the previous chapter, even a paediatrician needs a good ethical reason for doing this. Convincing one that the investigation of the singing voice is a good enough reason to drag boys into a clinic and subject them to a process most will find embarrassing is probably the most difficult part of the process. I tried without success for a number of years until I came across the work of Gary Butler who was a lead author for the new National Adolescent Growth Standards being produced by the Royal College of Paediatrics and Child Health (RCPCH). Gary had drafted guidance for nurses and other medical professionals based on voice as a non-intrusive indicator of satisfactory progress through puberty. He was using the term “voice break”, so I contacted him (a) to say I was very interested in the work and (b) to suggest that he might consider using the term “voice fully changed” in preference to “voice fully broken”.
The result was the clinical study of 62 boys aged between ten and seventeen that I shall describe shortly (Butler et al, 2018). To my knowledge, there are two other studies that have had as their principal objective the association of vocal parameters with clinically measured indicators of puberty. There is a good level of agreement between these studies and our own. Harries et al (1988) studied 26 boys longitudinally, measuring vocal parameters according to the Cooksey scheme, and pubertal status through salivary testosterone assay, Tanner staging, and testis volume. The Tanner puberty stages were compared with the Cooksey voice stages and found to correspond closely.
For readers unfamiliar with the Tanner staging system, the principle is relatively simple. Progress through puberty is determined by matching the actual appearance of genitalia and pubic hair to one of five staged photographs. There is a classic set of photographs derived from the Harpenden growth study (Tanner 1976) to show five stages of pubic hair growth (P stages) and another similarly to show genital growth (G stages). These are commonly presented as drawings, often accompanied by descriptive writing. Tanner staging is probably the most universally used system of puberty assessment, widely accepted across the world, though it has the drawback that an element of subjectivity is involved on the part of the assessor. The reliability of judgement has been shown to vary according to the experience and training of the assessor from fairly high in the case of paediatricians specialising in adolescence to low when assessments are made by boys themselves or a parent, as is quite often done when clinical assessment is considered inappropriate or too difficult to organise (Coleman and Coleman, 2002). We shall see shortly that this has implications for the way we approach choir work.
The Harries study is important for the way it validated Cooksey’s scheme in relation to well recognised events of puberty. The authors were at pains to point out that the voice break event that is recognised by most lay people occurs towards the end of puberty, the oft repeated statement that “the voice breaks when a boy hits puberty” therefore being somewhat erroneous. Their paper concluded with three key messages:
- Voice ‘breaking’ is a late event in male puberty.
- Changes in voice fundamental frequencies correlate with testis volume, but not testosterone levels.
- There is a clear relation between the Tanner stages and a Cooksey musical classification during male puberty (Harries et al, 1988: 446).
All three of these key messages are confirmed by our own study but at this juncture the second of the two other studies is important because testis volume, as stated previously, is the definitive objective measure of male puberty. If we are to use the voice as a non-intrusive surrogate for pubertal progress as is now advocated in the RCPCH standards, it is necessary to demonstrate the validity of the relationship. If we are to associate identifiable changes in the singing voice with progress through puberty, we similarly need to show a relationship between these and the objective measure of testis volume. If the link is shown to be reliable, intrusive investigations of genitalia can be dispensed with in all but serious cases requiring medical intervention.
Mette Pedersen became interested in the topic through her work as laryngologist to the Copenhagen singing school. She states in her PhD thesis that “Measuring the voice is necessary for youngsters to understand the pubertal development of their voices” (Pedersen, 1997: 15). She chose to compare the frequency of voices reading a set phonetic text with height, Tanner P staging, testis volume, total testosterone level and serum hormone binding globulin.
Her study was not entirely compatible with that of Harries et al because she defined puberty as “achievement of reproductive function, in practice, defined as obtaining secondary sex characteristics, pubic hair stage V-IV.” As we have already seen, Cooksey regarded vocal changes that occur during earlier Tanner stages as important. At the same time, voice “break” was indeed associated with the later Tanner stages in the Harries et al study although here there is a further complication in that Pedersen used P stages whereas Harries et al used G stages. Harries et al do not state why they used G rather than P stages, but in our own study we used both and found the G stages to be more reliable and to correlate better with both testis volume and voice pitch. P stages, although superficially easier to observe and perhaps the first sign a boy might notice in self examination, are not reliable in the earlier stages of puberty.
If the condition of a boy’s genitalia is an intensely private matter, the condition of his speaking voice stands at the opposite extreme. A boy is constantly revealing something significant about himself throughout most of his waking hours. Unlike when he sings, he gives no or very little conscious attention to the pitch at which he speaks, so if we measure this pitch in a systematic way we will have some very useful information. A gold standard of accuracy was set by Pedersen. She stated clearly what the speaking task was, the reading of a precisely defined length of a phonetic speech passage (a Danish translation of the Wind and the Sun). Strictly speaking, pitch is a subjective phenomenon, unlike frequency which can be measured objectively and precisely. Pedersen used electroglottography (see later chapters) to count the actual vocal fold collisions to obtain her data on frequency, employing exactly 2000 complete cycles to define the segment for analysis.
At the other extreme, Irvine Cooper made rough and ready judgments of boys’ status as they replied to his greeting on entering the classroom. Both methods have their place, but it is important to be clear about the degree of accuracy. Singing teachers quite often ask a boy to count slowly and monotonously backwards from twenty and may use their ears to judge the result by pitch matching to a piano keyboard. This method can be sufficient for deciding what key to use in a singing lesson, but it is not adequate for a scientific study. For one thing, counting backwards can give a result some 20 Hz or so lower than running speech. I have used the phonetic speech passage Arthur the Rat and the counting backwards method in all my studies and have found yet further variation according to the level of prosody or interpretation the boy puts into his reading. At one extreme I had a ten-year-old in an Oxbridge choir school who read as though he were auditioning for Shakespeare and at the other, a thirteen-year-old in a comprehensive school whose voice was almost a complete monotone as he struggled to read the words. Ideally, pitch range as well as mean needs to be recorded.
I have also found that the activities a boy was involved with in the hours leading up to the testing introduce a potentially significant degree of unreliability. The degree of tiredness and emotional state are difficult variables to control, even when care is taken to assess consistently at a defined time of day (wherever possible about an hour after the end of school). I make this point not to criticize other studies, but to explain the fact that for a boy who is at the margins of one pubertal stage, this level of variation can be sufficient to place him on the wrong side of a stage boundary if he is heard only once in a cross-sectional study. When heard several times over a relatively short period, mean pitch can vary by as much as 30Hz without any meaningful change taking place. Pedersen did not state how emotional state was controlled for, nor the time of day at which her speaking pitch measurements were made. However, against this I have sought in vain for many years to find a clear description of exactly how Cooksey obtained his quoted figures for what he called ASFF (Average Speaking Fundamental Frequency).
Taking Pedersen’s data to be nevertheless as near definitive as might be found, she reported a clear grouping of results under and over 200 Hz. A mean testis volume of 2.3ml was associated with a mean speaking fundamental pitch of 273 Hz, whilst a mean testis volume of 13 ml was associated with a mean speaking fundamental of 184 Hz. The significance of these boundaries for singing will become clear later. There is broad agreement in the literature of pediatric endocrinology that a testis volume of 4 ml marks the beginning of puberty. Volumes of between 3 and 4 ml indicate peripubertal status and anything below 3 ml prepubertal (Herman-Giddens et al 2012; Goede et al, 2010; Ankarberg-Lindgren and Norjavaara, 2004; Chipkevitch, 2001). A more recent paper by Joustra et al (2015) concluded that “no revision of the definition of normal onset of male puberty – from nine to 14 years of age – was warranted,” whilst the most recent investigation of Norwegian boys by Oehme et al (2019) defined pre-pubertal as 1 – 3ml, pubertal as 4 – 14ml and adult as + or >15ml. The mean age for attainment of 4ml in their study was 11.7 (op. cit. 1614). The principle would seem to be relatively stable. The SF0 value of 200 Hz therefore becomes a critical one if we are to use the voice as a surrogate measure of puberty and we might expect to find a mean speaking voice pitch of 200Hz at a mean age of 11.7 years.
The RCPCH Standards
The regular monitoring of growth ceased to be undertaken in UK maintained schools many years ago. Notwithstanding current government concern about obesity, the RCPCH produced a detailed chart and guidance notes “for use in children and young people whose growth requires close monitoring or whose measurements are outside the usual centile range” (RCPCH 2012). It was based upon the UK 1990 growth reference for 2 – 20 years. Importantly for our purpose, it provides instructions for practitioners such as school nurses who are not trained in Tanner assessment on how to identify whether puberty is proceeding healthily. The authors suggest that rather than five Tanner stages, a threefold “puberty phases” approach is used.
Gary shared with me the reasons for this recommendation. An investigation he had undertaken into the reliability of Tanner stage judgements made by medical practitioners who were not experienced paediatric specialists revealed surprisingly poor reliability. The bar chart below shows that when the five Tanner stages are grouped into three phases of 1, 2-3 and 4-5, reliability improves considerably and largely consistent judgements are made by practitioner groups.
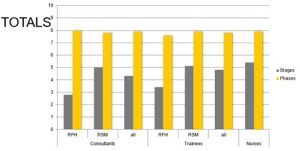
The issue with five stage assessment is that adjacent drawings are too similar and evidently confusable. Coleman and Coleman (2002) provided a detailed and comprehensive critique of the Tanner method, highlighting all the kinds of error that could regularly be made. This problem becomes significantly worse when real boys are involved because they do not grow as neatly and predictably as the Tanner drawings suggest. Moreover, the correlation of G and P stages is not strong, as we discovered in the investigation I shall describe shortly. The three-phase approach which resulted in reliable judgments by the three different classes of practitioner is show below.

Judgements in this case were of the Tanner based drawings, supplemented by or replaced the descriptions such as “moustache and early facial hair growth”. It can still be embarrassing or needessly intrusive to ask whether there has been “some growth of the penis” and whether or not there has is in any case a somewhat subjective judgement in the earlier stages. The question then arises as to how valid and reliable judgments might be if made solely by the voice descriptors:
-
-
- High voice
- Slight voice deepening
- Voice fully changed (broken)
-
Perception of the speaking voice
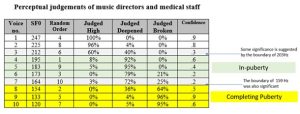
In order to investigate this question I carried out an investigation of voice perception by related professionals. Nine medical professionals, including nurses, GPs, and a paediatric specialist, together with thirteen independent school music directors with experience of boys’ choral work took part. Ten voice recordings of boys aged between 9 and 15 reading the phonetic speech passage Arthur the Rat were used. The highest voice pitch (speaking fundamental frequency or SF0) selected was 247 Hz, and the other recordings were selected to be progressively approximately 15Hz lower, the lowest SF0 being 120Hz. Pre-trialling indicated 15Hz to be close to a threshold of what could be distinguished perceptually in different voices. The voice samples were edited and assembled into two sequences incorporated into an audio file of 6’ 14” total duration. The first sequence presented the voices in random order and the second in descending order from highest to lowest. Approximately 20” of each voice was used, from the beginning of the passage up to the sentence ending “…he would always answer I don’t know.” An adult voice giving brief instructions was edited in between each boy’s voice so that one boy’s voice would not be heard immediately after another. A five second response interval was also edited in after each voice sample. Playback to the participants was in an acoustically dead room via a high-fidelity digital audio system.
During the first sequence the participants were asked to indicate their response by ticking one of the following statements:
- This is a “high voice”
- This is a “slightly deepened voice”
- This is a “broken” voice
They were also asked to indicate their degree of confidence in this judgement as either
- Definite
- Borderline
During the second sequence, the participants were asked to listen for the first voice they considered to be “slightly deepened” and the first voice they considered to be “broken”, indicating the number of the voice on their response sheet.
The results are summarised in the table below. It was possible to give a numerical value to the terms. Voices of 225Hz and above were clearly perceived as “high” and this perception would result in the boy being considered to be pre-puberty. The 212Hz voice, however, was marginal. A slender majority (60%) still though it “high”, but confidence in this judgement had fallen from .8 to .3. A reduction in pitch from 212 to 195Hz resulted in more confident judgements (.6) that this was a slightly deepened voice. 92% perceived it so. If we take the mean pitch of voices 3 and 4, we arrive at the value of 203.5Hz for the threshold of the in-puberty phase. Boys with voices in the range of 175 to 195Hz would be judged to be “in-puberty.” Values of 133Hz and below are confidently judged to be those of boys “completing puberty”, whilst the pitches of 173 and 164Hz produced the lowest levels of confidence (.2) 72% judged the 173Hz voice to be the lowest of the “slightly deepened” category, whilst the 154Hz voice was the highest of the “fully broken” category. The mean pitch of voices 6 and 8 was 163.5Hz, remarkably close to the actual pitch of voice 7, 164Hz. This figure might therefore be taken as the threshold for the beginning of the completing puberty phase.
Stages or Phases?
The results above have been simplified into the table below to show that perceptual judgement of voice by para-professionals (i.e. medical and music professionals with no specific training in either Tanner staging or voice assessment) can meaningfully judge pubertal status by voice to the accuracy of three phases. If 200 Hz be the critical value that coincides with 4ml TV, there is a margin of error as that value is approached around 212 Hz. A wider margin of error then occurs at the boundary where slight deepening begins to be perceived as fully broken. However, if throughout this period the boy’s voice is deepening, these error margins may not be medically critical.
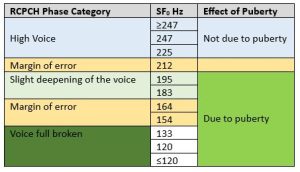
If, for singing, we are to use six stages of voice change as advocated by Cooksey, we need to accept that a voice >247 Hz is likely to deepen as a result of normal growth, but there is no reason to ascribe this to puberty until pitches <225 are approached. Similarly if we take a TV of 14 – 15ml as indicative of the beginning of the adult phase as suggested by Oehme et al above, there is tolerably good agreement with Pedersen’s association of 13ml TV with 184Hz. To claim any degree of precision greater than this, however, is not justified by perceptual judgments of voice. A three phase approach is therefore almost certainly preferable to a five or six stage approach if the speaking voice is used as a surrogate for puberty.
Not all workers in the field of voice have thought it necessary to employ six stages. Pedersen suggests that “many medical scientists have worked with puberty development using 3 clinical voice groups: child, puberty and adult voices” (Pedersen et al, 1988: 22). Working in this way results in only two categories as shown above. “Child” is light blue and “puberty” is mid-green as in the right-hand column. The distinction between slight deepening and full broken becomes superfluous since once adolescence has begun the voice will in any case fall below the 200Hz threshold until it eventually settles at its adult pitch. There is of course a large range of settled adult pitches with considerable overlaps between a higher adult voice and a lower adolescent voice. A simple distinction between “child” and “puberty” may not be sufficient for the purpose of determining health and safe treatment of the adolescent singing voice.
Michael Fuchs has suggested a three phase approach as a result of his work in Leipzig at the Thomasschule (Fuchs et al, 2007). He felt no need to classify voices into six stages, stating that children with a normal degree of vocal strain pass through the period of mutation without any severe problems. However, for boys singing as intensively as those in the Thomanerchor, the voice should not be used other than in gentle singing lessons during the mutation, which he identified as ” the period of specific period of vocal instability” (Fuchs et al, 2007: 170). The same “period of specific instability” was identified by Cooksey as Midvoice IIa, “the climactic period of puberty” when there is “extreme instability in the upper pitch range where strain can occur easily” (Cooksey, 1992: 59). This is the period between RCPCH “slight deepening of the voice” and RCPCH “voice full broken”, the period identified by Harries et al as a “late event of male puberty” i.e. between Tanner G stages 3 and 4 (Harries et al, 1997: 446).
Fuchs was concerned to predict when this would occur in order that the choir could optimally plan its resources without putting boys at risk of harm. He used the Goettingen Hoarseness Diagram acoustic analysis software to identify irregularities in the speaking voices of boys approaching the mutation and was successful in predicting the period of mutation six months before it occurred. The Fuchs approach and its impact upon the choir is summarised in the table.
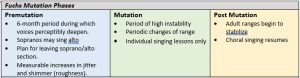
From Fuchs et al, 2007.
At this juncture, what matters is the relationship between the speaking voice and measurements of puberty. I discuss the implications and relative merits of a six stage versus three phase approach to the singing voice in Chapter Five. Meanwhile, I conclude the present discussion with a description of our own clinical study before introducing the important concept of growth velocity and the correlations that can be shown between how quickly boys grow and how quickly their voices deepen.
A novel non-invasive way to determine the onset of puberty in boys
The Speech Test app developed by David Howard was a smartphone app designed to measure the SF0 during the counting backwards from twenty test and allocate the result to categories corresponding to the phases of the RCPCH. It was the result of my collaboration with Gary Butler who wrote that
At present there is no reliable way to determine the onset of puberty in boys by non-invasive means. Previous methodologies had assigned stages of voice maturation by frequency analysis and assigned stages but these methods could not be translated into clinical practice. A validated method of directly comparing voice frequency changes with the onset of puberty is needed (Butler et al 2017).
The attraction of Speech Test was that, if the validity of the relationship between SF0 and recognised measures of puberty could be demonstrated, the intrusive examination could be dispensed with in the majority of initial routine medical inspections.
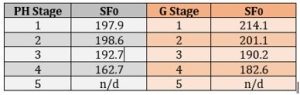
Voice samples were taken from 62 boys aged between 10 and 17 who were attending endocrinology or urology clinics and who required staging of puberty or genital examination for clinical reasons. Measurements of testis volume were made with a Prader orchidometer and expert assessments of Tanner G and P stages made. Salivary testosterone samples were also taken but the results were not considered reliable enough for use. Our results corresponded well with those of Pedersen. We similarly found that an SF0 of 200Hz associated with a TV of 4ml and therefore confirmed that pubertal onset occurs as the voice approaches 200 Hz in pitch. We also found that Tanner G stages confirmed the association between TV and SF0, but that Tanner P stages were less useful. This is shown in the table below.
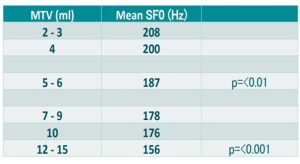
The next table shows how our results clustered at TV values >4ml. We found the transition from the slight deepening to full broken phase to be associated with TV values of 12 – 15 ml. Pedersen recognised a boundary of 13 ml and 184 Hz. We found somewhat lower SF0 to be associated with this value, but if 14 ml is the accepted boundary between “in-puberty” and “completing puberty”, then our values agree well with our own perceptual test in which the para-professionals identified 164 – 154 Hz as the commencement of the “full broken” period that coincides with the “completing puberty” progression to adult sexual status.
Speech test was intended primarily for medical use. Take-up and usage rate by professionals such as GPs and school nurses is unknown, though I suspect low. However, it has been popular with music teachers and choir directors. Unfortunately, it is was only ever available in iOS and is no longer in the Apple app store because it has never been updated. However, since then there has perhaps inevitably been a proliferation of phone apps that purport to measure voice pitch. In most cases, the pitch detection algorithm can be relied upon to be fairly accurate. The issue is what the app developer has done with the algorithm and what the app claims to tell its user. For example, there is an app that classifies the voice on a male to female continuum. This would not be appropriate for use with boys whose voices are changing and I am not sure how helpful it would be in a gender transition clinic either. Other apps do not offer recording or averaging facilities. We are in danger of ending up with a situation similar to the Tanner drawings. A degree of specialist training is needed to produce a result that is any more valid and reliable than the result we can produce with our own unaided perception. We have seen in this chapter that a reasonably cultivated human ear can allocate a boy to one of the three phases of high (prepuberty), slightly deepened (in-puberty) and full broken (completing puberty). That is as far as we need go in puberty assessment for everyday purposes outside the clinic. I shall return to the use of apps in the allocation of boys to singing ranges in Chapter 5 when we look in more detail at the Cooksey stages.
Growth Velocity
The term growth velocity refers to how quickly a boy is growing. Used with understanding, straightforward measurements of height and weight can be another non-intrusive form of puberty assessment. I cannot recall any boy objecting to having his height and weight measured out of over a thousand I have assessed. Indeed, many have shown considerable interest in their own growth. The key point to understand here is that measurements must be made regularly in order for velocity to be calculated. To know that a thirteen-year-old is 154cm tall is no use at all unless it is also known how tall he was when he was months and years younger. Thirteen year olds can vary in height between 134 and 176cm (RCPCH centile extremes), so the only thing a single measurement will tell us is how tall that boy is in relation to other boys the same age. This is not useless information, but it will not tell us what we want to know – whether he has begun puberty and how far he has progressed through it. Measurements at three monthly intervals are about right. Longer than this, an important change may be missed. More frequent measurements may not add much to what three monthly measurements tell.
Indicative norms have been calculated by various workers in the field. Those provided by Rogol et al (2000) largely agree with others and are the ones I have used as my own reference standard. They specify a prepubertal growth velocity of 5-6cm per annum and 2.5kg per annum. Referring to the very rapid growth in the first two years of life, they specify a “general rule of thumb” that a child grows 10 cm in the first year of life, half that [a further 12–13 cm] in the second year, and then 5–6 cm each year until puberty. During puberty, height velocity increases to 10.3cm per annum and weight velocity to 9kg per annum. They also refer to a “preadolescent dip”, during which growth velocity slows to a nadir of less than the average for the childhood period. An unexpected slowing in growth of a child can therefore indicate that puberty is about to begin and I have recorded such occurrences in my own studies. Peak Height Velocity (PHV) is probably the most important measurement and coincides with the progression from Tanner G stage 3 to G stage 4 which, as we have already seen, is also the time the voice deepens most rapidly. As we shall see later, this assumes importance in historical studies because PHV can be quite accurately determined from skeletal remains which can also be aged. If we accept that the G3 to G4 progression is “voice break” then we can determine when this happened in past centuries with a reasonable degree of accuracy.
In an ideal world, all boys would commence their main growth spurt on their thirteenth birthday and complete it exactly a year later on their fourteenth birthday when we would find they are 10.3cm taller. Of course, it is nothing like this and we need to appreciate that a velocity figure such as 10.3cm per annum represents a smoothed out curve. If we measure a boy we know to be in puberty somewhere between the 1st and 7th of July and then again somewhere between 1st and 7th October, we may find that he has grown at a rate more or less than the theoretical figure we could arrive at by working out how much he has grown in one day and multiplying by 365. Needless to say, this task can now be performed by online calculators such as Child Metrics. Child Metrics will calculate for us three monthly, six monthly and annual rates for any two given input dates and we can see that PHV of an individual is not uniform between time points.
The way in which these individual trajectories merge into the kind of curve represented in a growth chart is shown in the two illustrations below taken from a paper by Cole et al (2014: 79). These authors refer to a “clear and singular peak height velocity (PHV)” as a “most striking feature” associated with “intense hormonal activity” of puberty (p76). They give a PHV of 10cm per annum for boys, which is very similar to the earlier figure of 10.3cm pa given by Rogol et al. but they also take into account other measures such as the velocity of testis growth and the velocity of progress through Tanner stages.
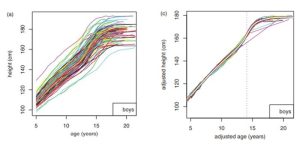
From Cole et al, 2014.
The left hand graph shows the individual trajectories of 103 boys who participated in the Edinburgh growth study. The right hand graph shows the curves adjusted to take account of variations in the timing and intensity of progression through puberty for individuals (see below). A white curve should be discernible which is the population mean. The dotted vertical line indicates the mean population PHV.
Weight velocity was not used in the Cole et al study and is a less reliable measure than height velocity because weight can vary with state of health and diet. Nevertheless, weight is relevant because, as we have seen 34% of healthy adult weight is attained in a singular spurt between the ages of fourteen and sixteen. Peak Weight Velocity (PWV) in boys is therefore usually achieved after PHV. This has been shown to be the case in my own longitudinal studies. It is likely that there are correlations between total body weight, mass of the vocal folds, and cross-sectional area of the vocal tract that might explain why although adult pitches are obtained when PHV is attained, adult vocal timbres are not. Such systematic studies have yet to be undertaken in any detail.
The relationship between height velocity and voice deepening.
We know that lower SF0 values are associated with later Tanner stages. For any individual boy studied we can plot a graph of voice deepening (i.e. SF0 on the Y axis and age on the X). We might expect to see that as height increases, so SF0 decreases and this, of course, is the case. More usefully, we might look for any coincidence or association between PHV and a similar peak in the velocity of voice deepening. We see exactly such an association in the figure below which shows height and voice deepening velocities of one of the boys I studied longitudinally. We can see below that PHV occurred between the ages of 13:08 and 14:03. Peak voice deepening (PVD) occurred over almost exactly the same period. However, height growth accelerates again between ages 14:08 and 15:02 whereas voice deepening flattens out. The left hand vertical line draws attention to the way in which the increase in height velocity coincides with the 200Hz SF0 marker of pubertal onset.
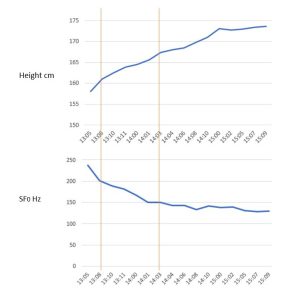
However, there is also a significant fall in SF0 immediately before this. We cannot say for certain because the measurement was not made of this (or any other) boy, but we do know that increase in pharyngeal length is positively correlated with increase in height (Fitch and Giedd, 1999) and shifting formant frequencies (Lammert and Narayaman, 2015). We might therefore postulate that one reason the perceived richness of this boy’s new baritone voice increased between the ages of 14:03 and 15:08 was because pharyngeal length continued to increase at a faster rate than vocal fold length. Acoustic data from this boy certainly bear this out.
The Intensity of Puberty
The last aspect of growth we have to consider is the intensity of puberty. This quantity is of singular importance when it comes to assigning boys to choral parts and determining their optimal singing range. I shall explain why and how this should be done in later chapters, but here we must first understand the growth concept. Another word for intensity of puberty would be tempo. All boys pass through the same Tanner stages, but they do not do so at the same rate. Those passing through the stages more quickly would be considered to have a more intense puberty and there is evidence that children who were taller and heavier at age six may experience puberty more intensely (Mills et al 1986). We thus have two variables, the age at which Tanner stage 2 first appears, and the rate at which the subsequent stages are passed through. We will see these variables across any one choir at any given time, but we will see them at population levels in history too. In later chapters, I consider the evidence that boys alive in previous centuries began puberty at much the same time as they do now, but passed through it more slowly. The implications of this for historically informed performance are considerable.
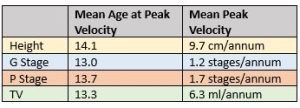
Cole et al (2014) provide data that show how peak velocity occurs at slightly different ages for the different pubertal indicators as well as the mean rates at which the Tanner stages are passed through. PHV generally lags some months behind the other pubertal indicators. The table below is a simplified extract from that which they provide on page 79 of their paper.
To demonstrate the range of variability in intensity, they provide the following illustration of P stage intensity range.
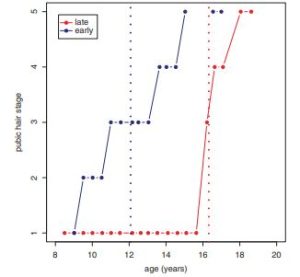
From Cole et al, 2014.
We can see that the first boy reached P stage 3 by age twelve at an intensity of 0.67 stages per year whilst the second boy did not reach P stage 3 until age sixteen and a half, but proceeded from stage 1 at twice the intensity, 1.33 stages per year.
The final table is taken from my own data and shows quite different rates of progression by the criteria of height and weight velocities for two of the boys studied longitudinally.

By these criteria, the second boy (LO22) was pre-puberty on his thirteenth birthday. His voice pitch was stable, averaging out at 234Hz during this time. His height velocity was only 3.3cm pa, which is less than the 5-6cm pa of childhood, quite possibly indicative of the pre-adolescent dip of which Rogol et al speak. Weight velocity was 3kg pa, just over the 2.5kg pa of childhood. We can deduce that he crossed to in-puberty between 12:11 and 13:11. Completing puberty is barely beginning between the ages of 13:04 and 14:05. Unfortunately, he left the study after age 14:05, but we might reasonably extrapolate the end of completing puberty as being somewhere near to 16 years of age. LO9, in contrast, was, at the age of 10 where LO22 was at 14. Between 11:11 and 12:11 his weight velocity accelerated to 6.5kg pa and the voice dropped rapidly to a value of 115Hz, indicative of the end of completing puberty.
The consequences for singing and part placement are obviously considerable but were not identified by the respective choir directors. In the case of LO22, this did not matter greatly. He successfully recorded a treble CD under the direction of Barry Rose at age 13:11, his choir director being aware that this was probably his last opportunity. LO9, by contrast had reached the boundary for “full broken” voice by age 11:03, passing beyond it at 12:04 and achieving full baritone status by 12:11. We shall see in later chapters that boys who sing intensively in cathedral choirs can sometimes maintain a treble singing range even though the SF0 is as low as 115Hz, but this was a parish church choir with less intensive singing. Unfortunately, the choir director attributed the boy’s painful struggles in rehearsal and performance to “laziness”.
Hitherto, we have only considered the speaking voice as an indicator and correlate of growth and progression through puberty. Part placement and singing range during puberty is a very much more complicated and, indeed, controversial process which we will tackle in Chapter 5. First, though, we must devote a whole chapter to the fact that the timing and intensity of puberty are significant variables. As we have just seen, at individual levels they can vary considerably across any one choir. At population levels, mean values can vary over periods as short as three decades. When we consider the time spans of the dead composers, we find both timing and intensity means differing independently in both positive and negative directions according to global (mostly European) location and period. An understanding of these epidemiological trends and an appreciation of their consequences for singing are essential if we are to develop any meaningful connection between dead composers and living boys in pursuit of historical authenticity in performance.
