3
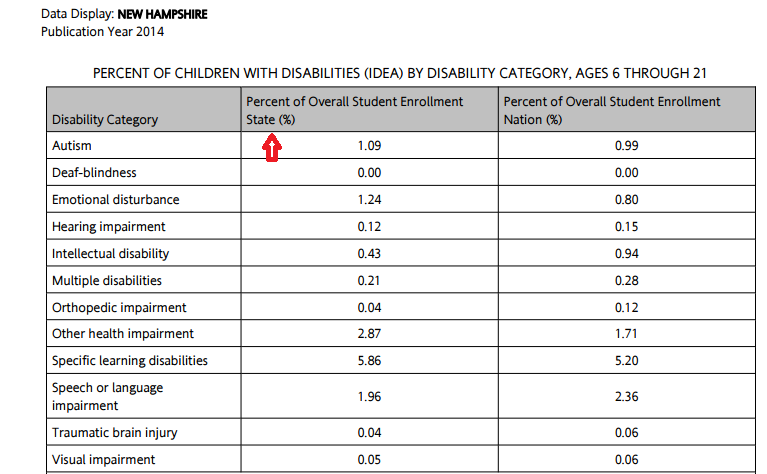
This is factual information that you will obtain on NH K-12 students from: NH DOE (2014) , Data Display: New Hampshire, Identification of Students with Disabilities, retrieved from http: //education. NH. Gov/instruction/special_ed/documents/nh_data_display.pdf
Go to page 2 for this information. (pg. 3 for developmental disabilities)
- This data will give you an understanding to the % of students with each disability that you will likely encounter in your school population. This data is important for planning for the resources and support personnel schools need.
For example: specific learning disabilities in NH
- Percent of students ages 6-21 in NH with SLD- 5.86%
- Percent of students ages 6-21 nationally with SLD- 5.20%
(Data Display:New Hampshire, 2014)
*Vermont prevalence data can be found at
Data Display: Vermont. (2014). Identification of Children with Disabilities. (pg.2) Retrieved from https://www2.ed.gov/fund/data/report/idea/partbspap/2013/vt-acc-stateprofile-11-12.pdf
*California prevalence data can be found atData Display: California. (2014). Identification of Children with Disabilities/ Retrieved from
https://www2.ed.gov/fund/data/report/idea/partbspap/2014/ca-acc-statedatadisplay-12-13.pdf
This is the data you are locating in this brief fact based section of the summary. This data is based on the total population of students ages 6-21 years of age.

From the NH DOE (2014) , Data Display: New Hampshire, Identification of Students with Disabilities, retrieved from http://education.nh.gov/instruction/special_ed/documents/nh_data_display.pdf
