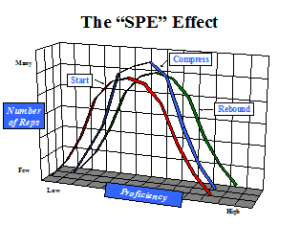
A well-executed Sales Process Engineering effort inevitably creates a powerful cycle of improvement in sales productivity. Typically, an 8-12% annual increase in sales performance per rep results – and that’s the result of the process alone. It’s above and beyond any additional revenue growth enhancements due to new products, a generally strong economy or other external factors. You might think of this phenomenon as the “SPE Effect”.
In any sales force, the performance of individual sales reps varies. A classic “bell curve” results by graphing the number of reps against sales dollars produced per rep. The sales volume of the best few reps will usually be about twice that of the lowest performers. The bulk of the sales team falls into a mid-range. This situation is represented by the first curve labeled “Start” below.
 The impact of a Sales Process Engineering effort initially emerges as enhanced performance at the low end. This is due to disciplined “capturing”, documentation, communication and implementation of the sales practices of the eagles by the low-end reps.
The second curve labeled “Compress” above illustrates the two things that occur. First, the total range of productivity narrows. Second, as shown by the higher peak, a greater number of reps begin to perform at around the average productivity rate.
Most managers have had the pleasure of watching a star performer instinctively react to a challenge of his or her superior skills. This caliber individual simply will not stand for a ranking that is drifting toward the middle of the pack. He or she is self-compelled to maintain an edge. The result is shown mathematically by the third “Rebound” curve. The natural range of productivity and normal shape of the curve is relentlessly restored by your eagles – – – at a higher level of total production for the entire sales force.
Although the above explanation uses “Sales Per Rep” to illustrate the range of skills in a sales force, keep in mind that this is far from the only applicable metric. Proficiency at any and all specific sales skills can and must also be similarly tracked and graphed. For example, ability to identify potential opportunities, ability to schedule the first face-to-face appointment, customer knowledge, product knowledge, proposal writing and closing could also be used. Whatever skill you measure will produce the same bell curve, but different reps will fall into the weak, average and strong categories for each one. Each rep, therefore, learns from every other rep as total performance improves.
This brings us to a critical and quite counter-intuitive point… Focus on getting all sales reps to at least an average level of performance on all key skills. (Re-read the last sentence three times!)
Some explanation is in order. Being among the best at anything is really difficult. The sales leader who can propel all reps to an “excellent” rating for all skills is rare, in fact, non-existent. On the other hand, most sales leaders can get folks to “average.” It is not you who drives the eagles to excellence. It is the nature of the beast that does the trick. Your focus needs to be on getting the laggards up to average in all key skills. This is the engine that drives the eagles. They will set the “excellence” bar higher without any prompting from management, which by default sets the “average” bar higher and starts this virtuous cycle all over again.
The final point in this section will probably strike you as obvious, but it must be emphasized. Never-ending persistence is essential. Now and then you will get lucky and have a large burst of improvement. Great! Virtually all progress, however, comes in baby steps. Given that, you have to stay at it forever. As my partner Cornell Wright often says, “Gentle pressure relentlessly applied,” is the real key.
