Heather Bonter, Zach Ericson, and Anthony Pasquarella
Introduction
Western culture is synonymous with excess. Starting in the post-World War II era and stretching to the age of neoliberalism in the 1980s, a new middle-class was formed. It was characterized by mass consumption and an every man for himself mentality. The growing desire for social differentiation, accompanied by an increased demand for a car that was now fueled with cheaper gas, and the birth of financialization resulted in “sub-urban” communities developing outside city centers throughout America. This phenomenon is what economists call “urban sprawl”; the mass development of land outside of the urban center. This raises the question: at what point will the consequences of excess catch up to us? And how can we plan our cities to sustain what is unsustainable? This section will discuss the economic, social, and environmental consequences of urban sprawl, and how development can be planned sustainably to mitigate the risks that are associated.
1. Sustainable Development and the Problem with Sprawl
1.1 Inputs to the Problem
At its core, and ignoring the negative consequences, there is nothing wrong with seeking a tranquil lifestyle outside of the city center. This section is not here to disapprove of this lifestyle, but instead discuss how in the long run, this could be unsustainable. First, let’s set the backdrop. The United States has experienced a shift in its labor force from manufacturing based to a service based economy. This is demonstrated by the FRED graph below, which charts the number of employees in the manufacturing and professional services industries. As you can see in Figure 1, post-World War II employees in manufacturing stayed essentially flat around the 16 to 19 million number, and slowly decreased after 1980. Those employed in professional
Figure 1
Source: Federal Reserve Economic Data: All Employees, Professional and Business Services; All Employees, Manufacturing
services accelerated, especially in the 1990s during the expansion of the internet for everyday use. At the same time, households devoted a larger portion of their income to consume a large amount of goods and services that goes beyond basic needs during this time period (Bueno-Suárez and Coq-Huelva, 2020). An example in this case is the automobile. The price of gasoline during this period was relatively low, even during the 1978 oil shock the price of a liter of gasoline was only $0.18 (Bueno-Suárez and Coq-Huelva, 2020). Therefore, middle-class families were able to purchase one vehicle per household and eventually one vehicle per family member (Bueno-Suárez and Coq-Huelva, 2020). This has created a variety of economic, social, and environmental consequences that will be discussed further.
The overflow of wealth spurred by the increase of jobs in professional services allowed for employees to live a substantial distance away from their place of work, which in result increased the demand for developing unused land in suburban areas. In addition to this, the traditional industrial jobs that were employed by the working class in the urban center were slowly diminishing due to the transition to a service-based economy. Many of the neighborhoods located in the city center where all the traditional industrial jobs used to be located now faced degradation. As a result, there was a sharp increase in income insecurity and crime in many of the United States’s major cities, which in turn, generated tensions between social classes (Bueno-Suárez and Coq-Huelva, 2020). It made sense for professionals to leave from the city center to the suburbs due to the increase in crime. As a result, the gap between high-income and low-income communities expanded because a home was becoming a stock of wealth.
Lastly, the birth of financialization accelerated the development of unused land outside the city center. Starting in the 1980’s there was a neoliberal shift in public policy. This meant that municipalities worked hand-in-hand with the private sector to make credit easily accessible (Bueno-Suárez and Coq-Huelva, 2020). The idea was that municipalities can take on a substantial amount of debt to fund infrastructure projects and the income generated by the projects will pay off the debt. As a result, there was a development of financial and cultural districts, gentrification, and touristification (Bueno-Suárez and Coq-Huelva, 2020). The second part of this was the easy accessibility to capital for households. Figure 2 illustrates the increase in mortgage debt outstanding by change in millions of dollars per year. Mortgage debt started
Figure 2
Source: Federal Reserve Economic Data: Mortgage Debt Outstanding, All holders
increasing in the 1970s and accelerated in the 1980s when mortgage-backed securities were issued by Fannie Mae (Fabozzi, 2016). Banks would bundle mortgages into tradable securities and sell them on the open market to investment banks. This created an incentive for banks to relax lending practices and lend more debt to households. In result, now that more households are able to qualify for a mortgage, this increases the demand for the construction of suburban developments on unused land. On top of this, according to the authors Bueno-Suárez and Coq-Huelva, “developers and construction companies can mobilize their own accounting resources. However, most of the funds they mobilize originate from indebtedness to banking institutions or to direct access to capital markets” (Bueno-Suárez and Coq-Huelva, 2020). This demonstrates that most inputs in the development of suburbs were highly leveraged, which could have accelerated the sprawl even more.
Understanding the backdrop in which urban sprawl was formed is crucial to the start of this discussion. The shift from a manufacturing to service based U.S. economy which in turn degraded cities, the consumption of goods and services beyond basic needs most notably the automobile, and the birth of financialization were all catalysts to urban sprawl.
1.2 Externalities
There are multiple economic consequences that arise from urban sprawl. One major concern is the idea of “food deserts”, which as implied by the name, are areas that are not home to healthy and affordable food options (Bueno-Suárez and Coq-Huelva, 2020). The migration of middle-class families to the suburbs tends to reduce the average income of the inner-city, which in result reduces the potential for new businesses within the urban center. Notice how suburbs can be characterized by having a main street of commerce with multiple grocery stores and other big box franchises. However in the inner city, the closest destination for food is a corner store or bodega. With not as many healthy food options, one could assume this will create pre-existing health conditions1. Food deserts are just one consequence associated with urban sprawl that could have economic, social, and environmental consequences. Another is the loss of time by transport and congestion. The expenditures that come with owning a vehicle, whether it be fuel consumption, maintenance, waiting in traffic, or producing more emissions into the environment that decreases well-being, are all included in the essence of suburban life. According to the authors of Sustaining What is Unsustainable, “On average, every American lost a week of their time in 2017 as a result of congestion in metropolitan areas, which involved extra spending of 21 gallons of gasoline per vehicle” (Bueno-Suárez and Coq-Huelva, 2020). In addition, according to the EPA, 28% of all emissions come from transportation as of 2018 (Sources of greenhouse gas emissions, 2020). Having to hop into a vehicle in order to reach one’s place of work, place of leisure, and place of residence comes with multiple economic consequences, and also adds to the degradation of the environment.
The following social and environmental consequences may also have economic implications. An original social consequence of sprawl was the evidence of discrimination of minority groups from banks on the basis of credit and geographic location. “Redlining” was used as a tactic by banks to not lend to certain areas of higher share minority population. This created a cultural separation between “white” suburbs and racially segregated inner cities. In the 1970’s, this idea was exacerbated by the blaxploitation genre in films that depicted the inner city as dangerous, which in result could have scared people away from the city center. While this practice of redlining is no longer evident, the aftermath of redlining is clear today. A whole dimension of people was able to increase their stock of wealth by owning real estate over an extended period of time, while the other dimension was halted from doing so. In turn, a racially divided gap in wealth is created over time. It is unfortunate that these practices happened even after the Civil Rights movement, but we must not dwell on the past. Rotating to the present, a substantial social consequence of sprawl that could have a negative impact on our future is the idea of sedentarism. The spatial distance between places of work, living, and consumption means that the personal vehicle is the sole method of getting from place to place. In the US, for example, only 1% of journeys are on bicycle and only 9% are on foot (Bueno-Suárez and Coq-Huelva, 2020). Suburbanization creates a sedentary lifestyle, which is one of the main causes of overweight and obesity (Bueno-Suárez and Coq-Huelva, 2020). Unless the average laborer is taking time out of their busy day to go to the fitness center or engage in some sort of physical activity, urban sprawl creates an unhealthy labor force.
What is most concerning about housing sprawl are the environmental consequences that arise from it. It is important to understand that environmental externalities almost always bleed into economic and social aspects of life. The main consequences that were cited by the authors of Sustaining What is Unsustainable are: material consumption and pollution, disruption of water cycles, and land use by expansion. First, energy consumption and emission from gasoline is a significant consequence of suburbanization. By living a distance away from your place of work or consumption, vehicular travel becomes a necessity, which bears a cost to society through negative environmental externalities and also an increased cost of living. For example, in Wyoming or North Dakota, per capita fuel sales are significantly higher than in District of Columbia, which has an adequate public transportation network (Bueno-Suárez and Coq-Huelva, 2020). In addition, it was found that “a thousand fewer homes per square mile means driving 1200 more miles a year, and therefore, consuming 65 more gallons of gasoline” (Bueno-Suárez and Coq-Huelva, 2020). There are ways to decrease the emissions from transportation. In fact, higher population density and more compact models show lower emissions of polluting gases (Bueno-Suárez and Coq-Huelva, 2020). This could be due to the decrease in distance between places of work and consumption. Dense urban centers are associated with transportation by foot or bicycle, which will in turn decrease the emissions from automobiles. Also, dense centers consume less energy. Buildings with five or more units use 38% of the energy that is needed for a single-family household (Bueno-Suárez and Coq-Huelva, 2020). In addition, single-family homes use more water. Middle-class suburbanization demands more water because their homes are frequently accompanied by swimming pools or gardens (Bueno-Suárez and Coq-Huelva, 2020). In a time when drought and wildfires are becoming annual occurrences, preserving our water will be essential for the future. Lastly, when the land that is used for suburban expansion has a production model focused on supplying food, the loss of agricultural land limits food certainty and exposes areas to dependency on imports (Bueno-Suárez and Coq-Huelva, 2020). As you can see, in the long run, the mass consumption that is associated with single-family homes have grave environmental consequences which could be unsustainable.
1.3 Sustaining What is Unsustainable
Mitigating the consequences associated with urban sprawl will be challenging. Not only has climate change already been permanently set into our environment, but the lifestyle associated with suburban living has been sown into the fabric of society. Therefore, sustaining what is unsustainable is essentially the most practical mode for policy makers.
As mentioned before, automobile maintenance and emissions are driving factors to the economic, social, and environmental consequences of urban sprawl. One way to transition away from automobile use is to invest in public transportation such as buses or rail, and also encourage journeys by foot or bicycle. It was found that there is a strong positive correlation between population density and transit use among world cities and a strong negative correlation between auto travel per capita and population density (Bertaud and Richardson, 2004). These findings, however, do not hold in all cases. Policy makers cannot increase accessibility to public transit and expect an increase in population density, and vice versa. For cities with 20 people or less per hectare2 an increase in density or public transit has no significant effect on each other, and only becomes significant when density is 40 people per hectare (Bertaud and Richardson, 2004). The only city in the U.S. in which that is the case is New York City (Bertaud and Richardson, 2004). This demonstrates how a solution is not as easy as investing into public transportation. “Empirical evidence suggests that the density threshold to operate transit on a sizable scale is around 30 people per hectare” (Bertaud and Richardson, 2004). Therefore, policy makers must become creative in finding ways to reach the threshold density of 30 people per hectare.
1.3.1 The Case for Atlanta FIX HEADING STRUCTURE
The city of Atlanta and the built-up surrounding area, as of 1990, had an average population density of around 6 people per hectare (Bertaud and Richardson, 2004). Due to its lack of a body of water or natural mountain range that borders the city, the Atlanta metroplex is plagued with sprawl. There are a few scenarios in which policy makers could conduct legislation to reach the 30 people per hectare threshold. The city of Atlanta can reduce its geographical area by two-thirds from 4,280km2 to 1,430km2, and turn the surrounding built-up area into green space or revert back to agriculture. Another scenario would be to freeze its current footprint and force all development for 20 years to not expand outward (Bertaud and Richardson, 2004). Looking at each of these scenarios realistically, neither of these options are feasible in Atlanta or in any city for that matter. Forcing a city to become more dense by redrawing lines or prohibiting expansion outward would be incredibly unpopular from constituents. However, as mentioned before, adding more unnecessary public transportation to an area with a density of less than 30 people per hectare will have little effect on increasing population density. Therefore, Atlanta must be creative. Providing a transit system that is both convenient for the consumer and financially feasible for the operator could be a possible solution. In doing so, the system could incentivize investment into the city center, increase density, spark demand and create viability, which in turn builds a positive feedback loop. Sometimes creativity is the only way to sustain what is unsustainable.
The Atlanta beltline is a large-scale urban redevelopment project that will connect 45 neighborhoods via a 22-mile loop of trails, light rail, and streetcars, surrounding the city center (Immergluck and Balan, 2017). As of 2016, the project consists of four open trails with two more under construction, seven parks, plans for modern streetcar expansion, over $3 billion in private economic development, and already hundreds of affordable housing units available on the market (Immergluck and Balan, 2017). Following a quick tour of the Atlanta Beltline Inc.’s website, it is clear that its goal is to unite the circle of communities that surrounds the city center and to bring people back to the core of the city. In addition, Atlantans use the beltline for recreation and leisure, as well as a bike commute to work (Atlanta Beltline, Inc., 2021).
The unification of Atlanta neighborhoods has been needed for decades. The city is essentially cut in half by the Tom Moreland Interchange, which is a 12-to-14 lane mega highway that is referred to as the “Spaghetti Junction” (Kruse, 2019). Unfortunately, the construction of the highway was intended to segregate the city by race back in the 1950s. The mayor at the time, Bill Hartsfield, even referred to the intertwined road system as “the boundary between the white and Negro communities” (Kruse, 2019). In addition, in the 1970s there was a war waged on Metropolitan Atlanta Rapid Transit Authority (MARTA) by residents of Cobb County who rejected the system due to racial prejudice (Kruse, 2019). The rejection to mass transit in Atlanta during the time period addressed at the beginning of this paper could have caused the outward mobility to the suburbs, and in result created the urban sprawl consequences that plague Atlanta.
How has the Atlanta beltline mitigated these externalities? Based on an economic cost-benefit analysis conducted by HDR, an architecture and design firm, as of 2012 the project is expected to generate a net present value of $46.4 million and a benefit/cost ratio of 1.79 over the course of 30 years(Appendix in Support of TIGER V Application, 2013). Benefits attributable to the net present value are quantified in various forms. This includes health benefits, recreational benefits, mobility benefits, and reduced auto use benefits (Appendix in Support of TIGER V Application, 2013). Figure 3 illustrates the calculations used to quantify the benefits received by the Atlanta Beltline. What is even more optimistic about this innovative project is that in the current year, 2021, the project has progressed through its phases and is much closer
Figure 3
Source: HDR Decision Economics: Benefit Cost & Economic Impact Analysis (2013)
to completion. As of 2012, only the Eastside Trail was first beginning to open up to the public, and as of now the west and east are being connected by Southside Trail in an interim state (Atlanta Beltline Timeline, 2021). Economic, social, and environmental consequences are addressed by the construction of the Atlanta Beltline. Individuals can save time and money by commuting to work via bike or light rail, reduce their emissions via automobile gasoline, and the previously segregated neighborhoods are now connected by a 22-mile circle that the entire public can enjoy. In addition to the net present value calculated before, the private investment in businesses that surround the beltline will create jobs and raise revenue through the city via property and sales tax. And finally, using current population data of 3,861 people per square mile, this brings us to a current population density of 14.9 people per hectare in the city of Atlanta (World Population Review, 2021). This means that since 1990, the Atlanta metroplex has more than doubled its population density and is inching closer to the threshold of 30 people per hectare that is needed for scalable public transit.
The Atlanta Beltline is one example of how policy makers and entrepreneurs have mitigated the risks associated with urban sprawl. While the project is nowhere near perfect, and must address affordable housing concerns for low-income residents who have resided the area for years, the Atlanta Beltline is an innovative solution to a problem that is not easily solved. As we enter a new era post COVID-19, policy makers must look to projects such as the Atlanta Beltline to sustain what is unsustainable.
- Property Values and Mortgage Rates
2.1 Housing Prices
Since the 2008 housing crisis, home prices slowly increased as the United States has been rebuilding the housing market. With the COVID-19 pandemic in 2020, there was a rather small decrease in median sales price of houses sold in the United States between the first and second quarter followed by an increase from the second to fourth quarter. Housing prices decreased because of the initial scare of the pandemic but soon rebounded.
Changes in regional house prices are subject to regional factors other than economic disturbances and monetary policy (Pichler et. al., 2021). It is suggested that across regions, the movement of prices can be separated into three components: “movements that are common to all regions; variations that are due to the repressors, reflecting differences in economic growth between regions; and structural differences in regional housing markets, captured by spatial coefficient heterogeneity” (Pichler et. al., 2021). A VAR model is used to analyze two Northwest Texas cities, Midland and Lubbock. Midland is a growing city that is rich in oil resources while Lubbock is the economic hotspot in the region of Northwest Texas. The VAR model was also used to test the second and third components of the movement of prices across regions. The second component is true if a change in housing prices is first seen in Lubbock then slowly spread into Midland. This also means the “lag of housing prices in Lubbock is statistically significant for housing prices in Midland” (Pichler et. al., 2021). Although, if the lag of housing prices in Midland is statistically significant for housing prices in Lubbock (explained by the third component), it is concluded that the movement in price is caused by structural differences in the housing market. After 2005, housing prices in Midland were growing substantially. It is widely believed that housing prices are higher in economic zones with better personal income, political influence, and health care. Since housing prices are higher in Midland rather than the economic hub of Lubbock, the authors see if the prices spread from Lubbock to Midland. It was found that housing prices are inter-correlated between different cities, meaning when the housing prices in one city goes up, the other city follows and vice versa (Pichler et. al., 2021). Although, smaller cities do not follow big cities, rather other smaller cities.
The housing price index is a measure of the price inflation in the United States and is calculated monthly. Pichler et. al. (2021) believes that the housing price index can be used as a measure of wellbeing and wealth of residents. The authors test if wealthy and richer people have a “wealth-protective shield” against COVID-19. It is found that if the housing price index increases by 10 percent, deaths due to COVID-19 would decrease by 0.26 per 1,000 people. It can also be seen that if the housing price index is increased by 10 percent, confirmed cases of COVID-19 would decrease by 3.96 per 1,000 people (Pichler et. al., 2021). So, higher housing price indexes are linked with lower confirmed cases and lower deaths due to COVID-19.
2.2 Mortgage Rates
Mortgage rates have been decreasing since about November of 2018. The average 30 year fixed rate mortgage rate in the U.S. was about 4.5 percent by the end of 2018. There was about a 0.8 percent decrease in the mortgage rate during 2019 and about another 1.1 percent decrease in the mortgage rate during 2020 (see Figure 4 below).
Figure 4
Freddie Mac, 30-Year Fixed Rate Mortgage Average in the United States [MORTGAGE30US], retrieved from FRED, Federal Reserve Bank of St. Louis; https://fred.stlouisfed.org/series/MORTGAGE30US, March 20, 2021.
Recently the mortgage rate has been increasing. According to Haughwout et.al. (2021), “Mortgage balances grew by $182 billion, the biggest quarterly uptick since 2007, boosted by historically high volumes of originations, which neared $1.2 trillion in the fourth quarter of 2020.” In 2020, there were many refinance originations and also many purchase originations. About 7.2 million people refinanced their mortgage in 2020 while the level of purchase originations came close to what was seen in 2006. 71 percent of new mortgages went to borrowers with credit scores over 760 in the fourth quarter of 2020 while only 31 percent of new mortgages went to the most creditworthy borrowers in the third quarter of 2003 (Haughwout et. al., 2021).
The COVID-19 pandemic had a severe impact on the mortgage market in the U.S. Although mortgage delinquency rates increased, the CARES Act offered forbearance assistance on a wide scale (An et. al., 2021). When a loan is in forbearance, the lender allows the borrower to pause paying or pay a lower rate, with the agreement that the borrower will pay this back later. During the pandemic, forbearance took the form of a pause to payments rather than paying a lower rate. Under the CARES Act, borrowers could request forbearance for up to 12 months with no fees, penalties, or additional interest accrued. It is estimated that 7 million mortgage loans were placed into forbearance in the last 8 months of 2020 (An et. al., 2021). The Black Knight Mortgage Servicing Platform (MSP) is responsible for processing payments for around two-thirds of the U.S. mortgage market. The Black Knight MSP created the “McDash Flash” data specifically to track forbearance and loss mitigation activities during the pandemic. Merging the Mcdash Flash data with three other databases, the authors were able to get a view of borrowers’ demographic information and financial condition (An et. al., 2021). Using this data in a difference-in-differences (DID) specification, they are able to examine the impact of racial and income inequality among homeowners. It is suggested that the pandemic worsened racial and income disparities in the U.S. mortgage market. Also, forbearance programs provided aid to millions of homeowners struggling with mortgage as minority and lower income borrowers took up forbearance at a higher rate (An et. al., 2021). If jobs lost during the pandemic are replaced with lower-paying ones, borrowers that are coming out of forbearance will need longer-term debt relief in order for the program to be successful. Though, modification programs are targeting millions of mortgage borrowers to help keep them in their homes (An et. al., 2021). With most forbearances ending near mid-2021, there is no telling how the forbearance program will affect borrowers or lenders in the long-run.
- Rental Assistance and Eviction
COVID-19 – the most critically important event of 2020 – has caused considerable damage not only for the housing market, but also for lower-income populations and renter households. “In 2016, one out of four (10.9 million) renters nationally spent over half of their income on housing,” so many renters entered the pandemic vulnerable to eviction (Benfer, 2021). Due to the pre-existence of the affordable housing crisis, 2020 has brought about a threat of mass evictions and housing displacement. “Although most of the dimensions of housing instability were present prior to the pandemic, their potential impact becomes much greater given the economic, social, and public health shocks associated with COVID-19” (Layser, 2020). Lower-income populations faced a lack of legal, economic, and social support which led to unprecedented loss of wages among renters while COVID-19 sickness and mortality further exacerbated these economic hardships.
3.1 Causes of Financial Turmoil
Social distancing measures that were implemented to slow the spread of coronavirus included a partial shutdown of many markets and businesses, which resulted in a record number of unemployment filings within a short period of time. In turn, unemployment has caused financial turmoil for many – especially for those who were in poverty previous to March 2020 – precipitating mass foreclosures and forced evictions. Throughout 2020, vacancies have disproportionately concentrated in low-income areas for several reasons. Higher population density, the use of public transit, and the larger presence of essential workers in low-income areas may lead to a concentration of COVID-19 outbreaks causing unemployment and housing instability. Unemployment rates may also be higher among residents of low income neighborhoods if their low-wage positions are not easily adapted to remote-work arrangements (Layser, 2020). Pre-existing income inequality, housing instability, and the comprehensive gap between the rich and poor have taken a turn for the worse.
With COVID-19-prompted eviction moratoria in place, there have been unprecedented effects on eviction filings. “Research on eviction filings in 25 cities during the pandemic shows that 1) where state or local eviction moratoria were in place, the intervention effectively slowed eviction filings during the pandemic and 2) without moratoria in place, eviction filings quickly reached or exceeded historic filing rates” (Benfer, 2021). The effects are especially prominent in particular areas with a greater presence of stricter property management companies rather than small landlords who tend to be more reasonable. Receiving aid from COVID-related assistance programs also generally requires proof of financial hardship or loss of earnings due to the shutdown. “Some of this requirement is driven by the use (or expected use) of federal funding through the CARES Act, which required use for COVID-related expenses. Many of these programs also impose requirements on landlords, such as waiving late fees and interest, providing penalty-free repayment plans for any rental arrears not covered by the program, and refraining from evicting tenants for some period of time” (Ellen, 2020). The country saw a dramatic increase in filings as soon as the CARES Act expired, suggesting that moratoria should potentially be extended until housing is stabilized in order to prevent further economic hardships.
5.3.2 Federal Assistance
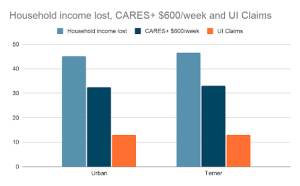
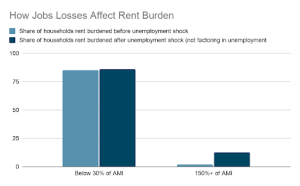
It is controversial whether the CARES Act has been effective in combating the negative effects of COVID-19 on the rental market. Some studies argue that the CARES Act provided greater than the necessary rental and mortgage assistance. By taking a look at Figure 4, one can observe that when adding the amount of unemployment insurance claims to the amount of CARES stipends, the total is more or less equal to the total amount of household income lost in billions of dollars. Each result of each study indicates the high likelihood that financial assistance provided to households approximately covers their lost income, given that assistance provided is distributed appropriately among households in need. Figure 5 illustrates that, as one would expect, lower income households are more rent-burdened before the unemployment shock while households with higher incomes are less rent-burdened before the unemployment shock. However after the shock, the share of households rent-burdened at low AMI are only slightly more rent-burdened than before while the share of households at high AMI are proportionately more so than before.
Another argument on the matter is that although the CARES Act and unemployment insurance were able to aid poor households for a period of time, lower-income renter households are still so highly rent-burdened that they have little savings to buffer against bankruptcy and eviction. For decades, escalating housing costs have outpaced income growth for middle- and lower-income earners. “Statistics point to the need to address this long-term structural problem, rising rent also leaves renters, especially low-income renters, with razor-thin margins to manage unexpected shocks to their budgets” (Ellen, 2020). This problem is not a new one, but is the cause of an ongoing, structural rental housing crisis. A 2018 Pew analysis of the Panel Survey of Income Dynamics found that nearly two-thirds of rent-burdened households had less than $400 in cash in the bank, and a full half of rent-burdened households had less than $10 in savings across various liquid accounts (Ellen, 2020). COVID-19-related expenses such as medical bills and higher utility bills combine with unemployment and reduced earnings to amplify these undesirable circumstances.
5.3.3 Homeownership Subsidy Inequality
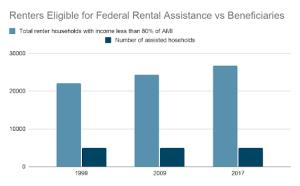
A related systemic occurrence which further heightens inequalities between low-income and high-income households is the homeownership subsidy which reduces expenses for generally higher-income earners. However, rental assistance programs for commonly lower-income households in years prior to 2020 have been extremely underfunded, and only a small portion of the population which qualifies for assistance typically receives it. Homeownership subsidies disproportionately help higher income households, with 90 percent of benefits going to those earning more than $100,000 in 2018 (Tax Policy Center Briefing Book). The tax benefits are very substantial. The total value of capital gains exclusions from home sales, property tax deductions, and the mortgage interest deduction, even after being reduced by the 2017 Tax Act, still amounted to over $75 billion per year in fiscal year 2019 (Tax Policy Center 2020). The homeownership subsidies greatly exceed the budget of the Department of Housing and Urban Development (HUD), which was $44 billion in FY 2019 (Ellen, 2020). Figure 7 demonstrates that the number of assisted households has remained just below 5,000 ever since 1999 while the total renter households with income less than 80% of AMI has increased substantially by millions. This suggests that while the number of households in need of assistance has been rising dramatically, HUD has not had the funding or capacity to take on the assistance of almost any new households in decades.
The economic problem deriving from this is the worsening gap between the rich and the poor; the systemic issue where the rich stay rich and the poor remain poor without the means or ability to redirect the route of their financial situations. Additionally, the general population has far less spending money outside of covering their housing expenses, utilities, and COVID-19-related medical expenses that, due to less money in circulation, the country is even more likely to spend years in recession before reaching economic recovery. Information from historic recessions can be considered to predict the course of the economy in the years following 2020. For instance, some states with consistently high eviction rates— such as Michigan and Louisiana—experienced steep spikes in eviction rates during the early stages of the Great Recession in 2010. “Once the rates had spiked in these states, they remained high for several years [until 2015] before declining. This suggests that housing instability may persist long after a crisis event like the pandemic” (Layser, 2020). This information suggests that, if the pandemic causes similar conditions to the Great Recession in 2010, problems perpetually faced by the poor including homelessness, foreclosure, bankruptcy, and evictions will continue for years following 2020.
5.3.4 Racial Inequality
The risk of eviction for many has increased at the hands of unemployment, especially among African Americans and other minority populations. Studies have also shown that “eviction and housing displacement are particularly threatening to individual and public health during a pandemic” (Benfer, 2021). This higher risk of eviction, the higher risk of contracting COVID-19, the associated medical costs, unemployment, and the risk of homelessness are all correlated factors contributing to disproportionate racial health and income inequity. “‘Seventy percent of market-rate eviction filings occur in neighborhoods [of Boston] where a majority of residents are people of color,’ even though these communities contain less than half of the city’s market-rate rental housing” (Layser, 2020). It’s plausible that the economic events of 2020 have even further exacerbated economic racial inequality among black and minority populations.
Measurable economic data surrounding housing issues in 2020 suggests many risks for the years to come. The particular matter of utmost concern appears to be exacerbated inequality in a multitude of forms. Due to the limited availability of data for research purposes and the recentness of the COVID-19 pandemic, the potential future effects are uncertain. But using historical data from recent recessions, the implications become a bit clearer. Careful macroeconomic policy is vital to the health of rental markets and the standard of living of low-income populations.
5.4 Foreclosures
The outbreak of COVID-19 and the resulting economic downturn has not only increased the rate of evictions, but it has also multiplied the forbearance of mortgages and foreclosures of homes. “Roughly 3.4% of Americans were delinquent on their mortgage payments as of April [2020], and by July 4.1 million homeowners were in forbearance” which is very high compared to the delinquent mortgage payment rate of 1.2% in December 2019 (Layser, 2020). Considering the fact that housing is a dire necessity for all people, the health of a nation’s economy hangs in the balance of the housing market. Foreclosure is not only detrimental to the economy, which the country experienced leading up to the housing collapse of the late 2000s, but it is socially and financially detrimental to portions of the population including homeowners, buyers, sellers, lenders, and landlords.
5.4.1 The Foreclosure Cycle
The housing market tends to undergo a cyclical pattern in the event of mass foreclosures. This results in worsening economic conditions for the housing market, for foreclosed homeowners, and for buyers in the housing market. The effect of having more homeowners with a foreclosure flag on their credit record and increased buyer choosiness due to the presence of foreclosures together account for 25.4 percent of the total decline in non-distressed prices (Guren, 2020). The reduction in lending stemming from default-induced lender losses accounts for an additional 22.6 percent (Guren, 2020). When housing prices decline, homeowners are more likely to default on mortgages causing banks to lose money and industries therefore begin to collapse. When home equity decreases, consumers also have fewer assets and fewer funds available for spending and saving. Reduced economic activity is, as we know, a major determining factor in the declining health of a nation’s economy.
The causes of the housing market bubble and crash of the late 2000s are conditions similar to those which the country may expect to experience due to the economic impacts of COVID-19, unless the country continues to implement the necessary preventative measures. The lender rationing effect becomes prevalent and occurs when foreclosures cause loss of lender equity, “[pushing] lenders against their capital constraint and causing them to ration mortgage credit, which prevents some buyers from being preapproved for a loan” (Guren, 2020). The foreclosure flag effect also occurs, which is when foreclosed homeowners are unable to purchase homes due to the foreclosure flag on their credit. Both the lender rationing effect and foreclosure flag effect cause an imbalance of buyers and sellers in the market, which in turn lowers home prices so that sellers and agents are able to contact buyers and make a sale. “Typically, foreclosures are thought of as an expansion in supply; our model emphasizes that foreclosures also reduce demand” (Guren, 2020).
5.4.2 Federal Assistance
The COVID-19-instigated CARES Act provided cash assistance to individuals and businesses, implemented foreclosure moratoriums, and eviction freezes in an effort to mitigate housing risk. However, some economists have argued that cash assistance is not effective enough at directly assisting housing payment. “These interventions have failed to eliminate the need for direct housing payment assistance and grant funded place-based interventions” (Layser, 2020). Policies that are directly implemented to aid in housing payment are arguably more effective at combating homelessness and poverty compared to less specific stipends. Additionally, once the CARES Act expired, foreclosures became vastly more prominent in the United States.
Nevertheless, unemployment insurance and CARES Act stipends were able to mitigate household debts and costs to a degree early in the unemployment shock of 2020. In the first three months of the pandemic, the amount of unemployment insurance recipients concerned about paying for essential expenses including food, rent/mortgage, utility bills, debts, and medical costs decreased between 6.2 to 17.1 percentage points (Karpman, 2020). However, there aren’t statistically significant declines in worrying about meeting basic needs among adults whose families applied for unemployment insurance and did not receive benefits as of May of 2020, about 2 months into quarantine in the U.S. (Karpman, 2020). In essence, in the early months of the pandemic, households that received unemployment insurance were less worried about paying for essential expenses including mortgage payments while households who applied for unemployment benefits but did not receive them were not significantly more or less worried about paying for essential expenses. This evidence suggests that unemployment insurance substantially aided households who qualified for benefits due to unemployment or reduced income. Families who received unemployment insurance still had 2.5% more reported problems paying rent or mortgage, while families who did not receive benefits had 2.9% more reported problems paying rent or mortgage two months into the pandemic (Karpman, 2020).
5.4.3 Housing Instability and Poverty
Unrelated to COVID-19, there has been an ongoing cycle of foreclosures related to housing instability in the United States for decades prior to 2020. Foreclosed-upon homeowners are significantly less likely to own their residence after a foreclosure. A study by the National Bureau of Economic Research using the instrumental variables approach finds that a foreclosed-upon homeowner has a 30 percentage point fall in the rate of repurchasing a home by the second year after the foreclosure. “This remains low: By years 3 and 4, homeownership drops 22 percentage points [for the instrumental variables approach] and by 17 percentage points [for the propensity-score-matched event approach” (Diamond, 2020). When a family shifts from being homeowners to renters, they fall into the cycle of debt and poverty related to high rent and low savings buffer from unexpected expenses.
Additionally, foreclosures usually result in foreclosed-upon homeowners moving to worse neighborhoods by ratings of crime and education quality. “Foreclosures cause the log average income in the ZIP code in which the foreclosed-upon homeowner resides to fall by a statistically-significant 11% by years 3 and 4 and 16% by year 5” (Diamond, 2020). Since these effects widen over time, this indicates that foreclosed-upon homeowners fall further and further behind in neighborhood quality relative to where they would have been absent foreclosure. Economic fluctuations tend to be correlated with foreclosure rates and the displacement of families into long-term poverty traps during periods of recession, much like the economic conditions of 2020.
The role of foreclosures in the displacement of homeowners and their families into worse living conditions is relentless and unforgiving. In many cases, foreclosure is unavoidable as it results from an inability to buffer against unforeseen circumstances such as hospital bills and unemployment; both of which can result from the COVID-19 pandemic. Given that the risk is far higher for low-income earners than for high-income earners, foreclosure is an obvious contributor to exacerbating economic inequalities. Having a foreclosure flag on one’s credit makes them less likely to ever purchase a home again. This drives them further into a poverty trap with no choice but to live in worse neighborhoods with higher crime rates, fewer opportunities, and a greater presence of poverty.
5.5 Homelessness
Homelessness in the United States has been a long standing problem, historically exacerbated by periods of economic recession. An individual can find themselves forced into homelessness as a result of unemployment, eviction, foreclosure, domestic violence, or by being an army veteran or ex-convict. “On a single night in January 2019, teams around the United States counted 567,715 people experiencing homelessness, and less than two-thirds of this population was in some form of temporary shelter” (Finnigan, 2021). This number is definitely an underestimate of the total homeless population, and the rate of homelessness can also fluctuate throughout the seasons of a year. This population is especially concentrated in densely populated urban areas, warmer climates, and coastal states.
5.5.1 Definition of Homelessness
To be considered a homeless person, an individual doesn’t simply need to be lacking housing. The HUD defines several classifications of homelessness in an effort to estimate more accurate representations of the number of homeless people as well as the number of people at potential future risk of homelessness. The broad definition of the term is “an individual or family who lacks a fixed, regular, and adequate nighttime residence” (HUD Exchange). Further categorizations include “(a) homeless, (b) imminent risk of homelessness, (c) homelessness under other federal statutes, and (d) fleeing/attempting to flee domestic violence” (Benavides, 2020). For these populations of people, taking care of basic human necessities such as food, hygiene, sleep, mental health, and as-needed addiction assistance is relatively much more difficult. This prevents them from acquiring work, transportation, future housing, and also maintaining relationships with friends and family.
5.5.2 Implications of COVID-19
Federal, state, and local governments have always been concerned for the homeless. Non-profit social welfare organizations such as food pantries and charities have also played a major role in assisting this marginalized population. However, the onset of COVID-19 made the previously established response tactics even more challenging to carry out (Benavides, 2020). Furthermore, homelessness in combination with the pandemic is a more serious human rights issue because of the additional risk of contagion and death. About half of the population experiencing homelessness lives in California, Florida, and New York which are all states with high numbers of people with COVID-19 (Finnigan, 2021). High rates of COVID-19 contraction within the same densely populated area leads to a rapid overflow of hospital patients while these hospitals lack the resources to work as efficiently as necessary. Homeless individuals are also far less likely to seek out or receive the medical attention that they need due to poverty and having no medical insurance in many cases.
Many of the homeless population are older adults or have underlying medical conditions, putting them at an even higher risk for severe diseases and death (CDC). The average age of people experiencing homelessness is higher than the national average, while chronic homelessness is also known to rapidly accelerate age-related physical declines. The homeless population often has less access to health care and fewer healthy behaviors available to them than the average American. “Compared to the general population, people experiencing homelessness have substantially higher rates of disability, infectious diseases, and chronic diseases” (Finnigan, 2021). Moreover, homeless services are often provided in congregate settings, which could worsen the spread of infection. All of these factors contribute to worsened COVID-19-related risks to the homeless population. Taking this into consideration in a recent study, researchers projected potential impacts of COVID-19 infections for this particular population. The study estimated that “over 20,000 people could require hospitalization, over 7,000 could require critical care, and almost 3,500 could die due to COVID-19” (Finnigan, 2021).
In order to prevent these grave effects of the virus early on, federal, state and local governments have taken precautionary measures. Evidence reveals that the homeless population benefits from the fulfillment of needs concerning “sheltering, nutrition, health care (including mental health and substance use necessities), and relevant available information to deal with the crisis (Benavides, 2020). Beyond these fundamental essential needs, the homeless also require employment and financial resources to reintegrate them back into society, especially for those who have been previously incarcerated. Governments have made efforts through the implementation of the CARES Act, which provides benefits to the homeless population as well as the general public through cash assistance. Local governments have also taken innovative, unprecedented actions in their approach to house and provide services for the homeless during the pandemic. For instance, “Las Vegas is housing the homeless in makeshift shelters in parking lots. Los Angeles County is using recreational vehicles (RVs), trailers, and other means to house homeless individuals that have contracted COVID-19. Cities such as Austin, New Orleans, New York, Philadelphia, and Hennepin County are renting empty hotel rooms” (Benavides, 2020). Although the homeless population faces much more drastic challenges than the general population with the onset of COVID-19, efforts are being made through economic assistance programs to counteract these effects.
5.6 Conclusion
There is extremely limited data on the subject of homelessness in the United States as the population and its externalities are difficult to measure through surveys, polls, and the Census. This subtopic is designed to provide insight into the homelessness problem and its fluctuations through the early 21st century, especially resulting from the COVID-19 pandemic. Many more measures need to be taken in order to reintegrate this population into society. Despite the pandemic causing obvious negative effects on the health conditions of this population, they are hopefully also receiving greater amounts of attention and public assistance to provide for their needs during these troubling times. Many homeowners and renters within the lower-income population, after all, are struggling financially as a result of unemployment and medical costs. COVID-19 has potentially pushed portions of this population to the verge of homelessness as well.
References
An, X., Cordell, L., Geng, L., & Lee, K. (2021). Inequality in the Time of COVID-19: Evidence from Mortgage Delinquency and Forbearance. Federal Reserve Bank of Philadelphia. doi:https://doi.org/10.21799/frbp.wp.2021.09
Appendix in Support of TIGER V Application – Atlanta Beltline Community Connector: City of
Atlanta and Atlanta Beltline, Inc. (May 30, 2013). Benefit Cost and Economic
ImpactAnalysis. HDR: Decision Economics.
http://beltline.org/wp-content/uploads/2013/05/ABI-TIGER-V-BCA-Appendix.pdf
Atlanta Beltline Inc. (2021). Atlanta Beltline overview. Retrieved from
http://beltline.org/about/the-atlanta-beltline-project/atlanta-beltline-overview/
Atlanta Beltline Inc. (2021). Atlanta Beltline timeline. Retrieved from
http://beltline.org/about/the-atlanta-beltline-project/atlanta-beltline-overview/
Atlanta, Georgia Population 2021 (Demographics, Maps, Graphs). (2021).
https://worldpopulationreview.com/us-cities/atlanta-ga-population.
Benavides AD, Nukpezah JA. “How Local Governments Are Caring for the Homeless During
the COVID-19 Pandemic.” The American Review of Public Administration. (2020)
Benfer, E.A., Vlahov, D., Long, M.Y. et al. “Eviction, Health Inequity, and the Spread of
COVID-19: Housing Policy as a Primary Pandemic Mitigation Strategy.” J Urban Health
98, 1–12 (2021). https://doi.org/10.1007/s11524-020-00502-1
Bertaud, A., & Richardson, H. W. (2004). Transit and density: Atlanta, the United States and
western Europe. Urban Sprawl in Western Europe and the United States. London: Ashgate, 293-310.
Bueno-Suárez, Carlos, and Daniel Coq-Huelva. “Sustaining what is unsustainable: A review of
urban sprawl and urban socio-environmental policies in North America and Western
Europe.” Sustainability 12, no. 11 (2020).
Diamond, Rebecca, et al. “The Effect of Foreclosures on Homeowners, Tenants, and Landlords.”
NBER, National Bureau of Economic Research, June 2020,
www.nber.org/papers/w27358.
Ellen, Ingrid Gould, et al. “A Rental Safety Net: A Call for Federal Emergency Rental
Assistance.” Economic Strategy Group, The Aspen Institute, 3 Dec. 2020,
www.economicstrategygroup.org/wp-content/uploads/2020/12/Emergency-Rental-Assistance-1.pdf.
Finnigan, R., & Davis, U. (2020). Greater resources required to protect people experiencing
HOMELESSNESS FROM COVID-19. Retrieved March 15, 2021, from
https://poverty.ucdavis.edu/post/greater-resources-required-protect-people-experiencing-homelessness-covid-19
Francke, Marc and Korevaar, Matthijs, “Housing Markets in a Pandemic: Evidence from Historical Outbreaks” (January 25, 2021). Available at SSRN: https://ssrn.com/abstract=3566909
Guren, A. M., & McQuade, T. J. “How do foreclosures exacerbate housing downturns?.” The Review of Economic Studies, (2020).
Haughwout, A. F., Lee, D., Scally, J., & Van der Klaauw, W. “Mortgage Rates Decline and (Prime) Households Take Advantage” (No. 20210217b). Federal Reserve Bank of New York. (2021).
Immergluck, D., & Balan, T. (2018). Sustainable for whom? Green urban development, environmental gentrification, and the Atlanta Beltline. Urban Geography, 39(4), 546-562.
Karpman, Michael, and Gregory Acs. “Unemployment Insurance and Economic Impact
Payments Associated with Reduced Hardship Following CARES Act .” Urban, Urban
Institute, June 2020, www.urban.org/sites/default/files/publication/102486/unemployment-insurance-and-economic-impact-payments-associated-with-reduced-hardship-following-cares-act.pdf.
Kruse, K. M. (2019, August 14). How Segregation Caused Your Traffic Jam. The New York
Times. Retrieved from https://www.nytimes.com/interactive/2019/08/14/magazine/traffic-atlanta-segregation.html.
Layser, Michelle D. and De Barbieri, Edward and Greenlee, Andrew and Kaye, Tracy and Saito, Blaine G., “Mitigating Housing Instability During a Pandemic”, University of Illinois College of Law Legal Studies Research Paper No. 20-15, Seton Hall Public Law Research Paper Forthcoming, Northeastern University School of Law Research Paper No. 386-2020, Albany Law School Research Paper No. 6 For 2020-2021, (June 15, 2020). Available at SSRN: https://ssrn.com/abstract=3613789
Pichler, M., Skutnik, F., Vlad, A., Shahri, H., & Ridwan, M. (2021). Housing Price Index, Wealth, and Protective Shield against Covid-19. SIASAT, 6(1), 1-8.
Strochak, Sarah, et al. “How Much Assistance Is Needed to Support Renters through the
COVID-19 Crisis?” Urban Institute, Renters and Rental Market Crisis Working Group,
June 2020, www.urban.org/sites/default/files/publication/102389/how-much-assistance-is-needed-to-support-renters_1.pdf.
