From the six small watersheds came a lot of data: Water input and output were measured. Chemical input and output were figured. Particulate gains and losses were counted. Energy budgets for several organisms and the litter were charted. Temperatures of the streams, soil, and lake were recorded. Nutrients in the soil and organisms were recorded, and so on and on – data, data, data, everywhere. Where did all these numbers go?
Each researcher had his own private field notes and journals filled with data. Records of the chemical analyses that were done at the Cornell Ecology Laboratory were kept in several forms.
Field sheets of “on the spot” observations and measurements were kept in thick blue-binder notebooks, all labeled by date with black marking pen. Blue-binder notebooks filled shelf after shelf and represented $1,200,000 in data. Eleven years of records made a lot of data!
From the information in the blue notebooks IBM punch cards were filled out for each sample analyzed. These data included such things as temperature, conductivity (electrical), as well as the chemical content of the sample and other information from the original field sheets.
Each day it rained, the new data were added and run through the computer for continuous monthly totals and average concentrations of chemicals by the month and year. Until IBM cards were used, data were recorded as raised dots on narrow white rolls of paper tape.
The IBM machine quickly sorted large batches of information when the searchers knew what information they wanted. But as handy as the IBM computer cards were for getting at specific data, they were not easy to browse through for general ideas and new questions to ask. The original field sheets continued to have a separate purpose as a source of readable information. The blue binders with field observations ensured future investigators data that might answer new questions as yet unasked and unimagined.

Other materials available for future projects and for checking on old project results were water samples in clear plastic bottles. Rooms with floor-to-ceiling shelves were filled with plastic bottles. Labeled with a permanent black marking pen when they were collected, the water samples were the basis for the thousands of observations recorded as data in the blue notebooks and on the IBM cards. The estimated cost of each bottle was five dollars. This cost included the labor to obtain, test, and record the data for the sample.
The bird, insect, plant, salamander, litter, water, root exudates, and other analyses all depended on special analyzing machines at the Cornell Ecology Laboratory. The Hubbard Brook project would have been almost impossible before an Australian machine, the autoanalyzer, was invented. Cornell had received the fifteenth machine in the United States. This ingenious invention made it possible for one lab technician to operate and quickly record data from water analysis for thirty-two chemicals. For eleven years weekly water samples had been analyzed without a break. In the past it would have taken a lab technician hours to do the same analyses on one bottle of water.
Another machine, the atomic absorption spectrophotometer, burned a sample. The color of the flame indicated the kind of gaseous elements present and their amounts in milligrams. Dials were read by the lab technician, who recorded the chemical contents on data sheets and then punched out the information on IBM cards.
Dependent on these machines for processing their data, the researchers were also dependent on the skill of the technicians who kept them in working order.
Throughout the history of science, new devices have allowed scientists to extend their data-gathering ability. Frequently new equipment must be tried and compared to equipment in present use.
For a while “Erni” kept Dr. Likens company in his office. Looking like any normal friendly household robot, Erni opened automatically when it rained. He was put out to pasture side by side with two other rain collectors in an enclosed experimental yard. Erni, with a chemist checking, not only measured rain, but immediately recorded the pesticides and other chemicals present in the rainwater. Will an Erni someday monitor our yards?
Hubbard Brook data also went to Yale University and into a program for a computer. By using IBM cards filled with Hubbard Brook facts, the computer predicted in picture form the appearance of the Hubbard Brook Forest in any given number of years – five, ten, one hundred, five hundred, etc. By using data such as plant species biomass as the basis for expected growth rates, the computer mimicked forest growth, showing height, mass, and density the way a television cartoon mimics real-life events. The computer can show in picture form the growth and death of a mature Hubbard Brook Forest, given different treatments.
Another visible product of data-gathering in the woods was stored behind metal doors at the Cornell Ecology Lab. The shelves were piled with reprints of many journal articles written about the Hubbard Brook, research projects. Interested scientists wanted their own copies to learn about methods used, data obtained, or results reached in a project.
After fieldwork was finished, data gathered, and numbers recorded and translated to IBM cards, charts, and graphs, memories remained. Researcher’s memories of their fieldwork were often different from their published reports. Memories stored the curious, interesting, and humorous angles of a project.
Dr. Likens and Dr. Margaret Davis’ crew chuckled when they remembered how they had moved the 12 ½-meter lake cores. The mud cores were cut into 780-830 centimeter lengths, wrapped in plastic and foil, and placed in aluminum rain gutters for protection during their ride to Dr. Davis’ freezer.
“What if a policeman stopped her on the way home?” the researchers asked jokingly. “Would he believe her story of wrapped mud? Would the police think she was a criminal trying to hide something? After all, who carries neatly wrapped mud in the trunk of her car? A likely story!”
Those same mud cores kept Dr. Davis busy for several years in her laboratory. While uncovering the history of Mirror Lake she came upon another nature mystery.
About five thousand years ago, the lake was surrounded by a spruce forest that must have been destroyed suddenly and completely. The lake showed extreme productivity during one period of its life. But after a certain date no more of the spruce pollen appeared in the mud core slices. What had happened? Fire? A heavy snowstorm? Some mysteries remained mysteries.
The insect researchers remembered their first study year, when Heterocampa caterpillars appeared in large enough numbers to “eat up” a forest. In many places the caterpillar seemed to be doing just that. But as predicted, Heterocampa numbers crashed. The forest survived, but the number of young birds that were fledged declined. Migration returns were fewer, and fewer young birds appeared in the forest when the Heterocampa numbers were down. There was less food for the young birds.
Observers decided that insect parasites reduced the Heterocampa numbers in their cyclic rise and sudden fall of population. Heterocampa, the bird food, controlled the number of fledglings able to survive in the forest, rather than the birds’ controlling the number of Heterocampa. When birds ate Heterocampa caterpillars, it just looked as if birds were controlling this insect. Scientists can’t always believe their eyes. That’s why they count and analyze their data.
The bird people had their special memories. One year observers saw great numbers of scarlet tanagers dead on roadways. It seemed as if their whole population had suffered mass death. What caused the tragedy?
A late cold snap with a steady rain arrived with the birds migrating to the northern woods from their southerly winter feeding areas. Their strength and food reserves were all gone from their long flight. Stomach samples showed signs of starvation. Leaves and twigs were found in tanager stomachs, showing that none of their usual insect food was available. The cold killed the insects, and the tanagers, next to them in a food chain, starved.
In years to come, would tanager numbers begin to rise? Practically unseen in the forest, a few managed to survive and reproduce themselves. A few young added to the small population might make the breed visible in a number of years. Downy woodpecker, nuthatch, and chickadee numbers had been lower for several years after a late winter freezing rain. Their population had slowly increased again. Would the tanagers? The researchers watched and counted. These interrelationships and nature mysteries make the ecologists’ work exciting.
The botanists had their finds too. The pin cherry, identified by white streaks on reddish bark, was a pioneer plant. As a pioneer species it prepared the way for the young plants of a climax forest that would again shade newly buried pin cherry seeds. If fire, snow, or man destroyed the forest, the pin cherry would be ready to spring up and hold the soil and help a new forest grow. These kinds of interrelationships between the community and its physical environment fascinated the ecologists.
Ecology is not something discovered and known. At Hubbard Brook new interrelationships were being discovered all the time and known interrelationships were changing too, just the way people purposefully and forcefully change their own environments.
The professors’ measurements from the weather stations and rainwater analyses showed that environmental clean-up efforts must be monitored. They discovered that the results of good intentions and actions are not always as expected.
Measurements showed a decrease in soot and ash as local manufacturers and homes changed from coal to cleaner natural gas fuel. There was 70 percent less sulfur in the rainwater than before 1950. Pollution controls appeared to be working.
When coal was used, sulfur fell to the ground near its burning site as neutral salts. Now pollution control devices, like screens, trap particles, many of which are alkaline. New taller smokestacks send sulfur dioxide gas into the air much higher up than coal burner stacks. Sulfur dioxide may spread farther out over a bigger area. Researchers have suggested that without the alkaline particles in the air to neutralize the acids, the sulfur changes into an acid and stays acid. This may account for the gradual increase in the amount of acid rain that has fallen on the Hubbard Brook Forest over the last twenty years in spite of the soot control devices. The next step will be to control sulfur oxides.
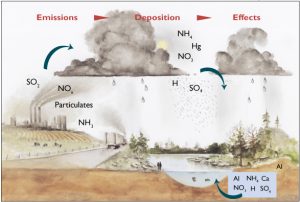
Rain and snow have a neutral acid value. Northeast rains measured had more acid than other places. Some storms measured as acidic as the vinegar you buy in the grocery store. Acid rain leaches nutrients from the plants and perhaps the soil. Acid rains and snows may have held back forest growth in the last twenty years.
Too much acidity kills fish, wears away public buildings and statues. Wheelbarrows and tools left out in acid rains wear away more quickly. Acid rain costs us all in many ways.
The pine trees in some spots of the San Gabriel Mountains in southern California were dying. Could it have been the warm, heated air rising from the sulfur-dioxide-filled valley below? Supposed you breathed this kind of air every day – what might happen to your lungs? The researchers at Hubbard Brook may help ring warning bells that will help us change our ways and save ourselves along with our environment.
Note: Just as the author originally predicted in 1976, the United States established rules regulating the emission of sulfur dioxides in order to reduce acid rain. The work and research that led up to the enactment of those laws is some of the most important that has come out of Hubbard Brook. Research at the HBEF directly affected the Clean Air Act and its Amendments (CAAA), federal legislation passed in 1970 and 1990 to address acid precipitation. The story’s not over, though! Since researchers at Hubbard Brook are still conducting measurements of soil and water chemistry, we continue to learn more about the problem of acid rain and its effects. For example, although many people believe that the problem of acid rain was solved with the passage of the Clean Air Act and Amendments, further research at the HBEF demonstrates that acid deposition is still a significant problem. We have found that the ability of some ecosystems to neutralize acid deposition has diminished over time, delaying the recovery of forests, lakes, and streams. Also, while the Clean Air Acts of 1970 and 1990 have improved air quality somewhat, the emissions reductions mandated in 1990 are not likely to bring about full ecosystem recovery in sensitive areas of the Northeast. This kind of finding may continue influence the enactment of future laws.
For the basic scientist, a study doesn’t have to have an immediate practical use. Learning more about what and how things happen in the world is reason enough. But as a spin-off, ecologists studying food chains have learned how the poisons used on farms and lawns made their way into water systems, entered the nutrient system of the tiny phytoplankton, were eaten by the zooplankton and continued to concentrate up the food chain, finally killing fish and birds. There may be only a little poison in each microscopic animal in the lake, but if one fish eats many such animals, that one fish is going to contain a lot more poison than the smaller animal. In this way poison builds up or concentrates at each higher level in the food chain. Fish are killed. Birds that feed on fish get more poison in their bodies. The poison upsets their ability to make eggshells. Their soft eggshells don’t protect the new bird. No birds like peregrine falcons or bald eagles hatch from soft-shelled eggs. When the food chains off all the peregrines or bald eagles contain enough poison, no egg may hatch. At that moment a species will become extinct, and “extinct is forever.”
What happens in the human body that eats fish and other animals containing concentrated poisons? Scientists are continuing to try to find answers to that question. We ourselves are guinea pigs.
Just by existing, the animals in the world play a role in the community of the ecosystems where they live. Man may not always understand the role of each animal until it is gone. Although other animal species should not have to prove their right to live in our ecosystem, the earth, they do have a purpose for human welfare. If the earth is healthy enough to sustain a variety of plants and animals, it will be a healthy enough environment to sustain human life too. If the environment cannot sustain varied animal life, the human race may find itself an endangered species. Variety in the organism world is necessary for the continuance of life.
Feeding the multitudes may someday be considered another problem for the ecologists to solve. There are many systems at work to get food to hungry people.
Land recently taken out of America’s land bank became rich with nutrients as it lay resting for years. It is fertile land, ready to grow good crops.
After several seasons of crops, fertilizers will be needed to put back into the soil the chemicals taken by the plants. It takes oil to ship raw fertilizer-making materials to places like Florida, and making fertilizer takes a lot of energy as well.
After food is grown it must be transported to where it is needed. More fuel and energy are used to transport the food. Fuel is limited and expensive. Some people will not have food because it cannot be transported to them.
With the computer, more data, and continuing study, ecologists may be able to prescribe, like the medical doctor who is consulted by a sick patient. They may diagnose the carrying capacity of the earth and suggest reasonable distributions of populations near food sources. They may indicate lands best suited to crops so that good land will not become cemented roadways or covered with houses. They might suggest locations for homes that would be less likely to stand in the way of expected natural disasters like floods and mud slides.
But in all cases, like the physician, the ecologist will be a consultant. Governments and individuals will have to decide whether or not to follow the ecology doctor’s advice, fill their prescriptions, and take the necessary medicine.
The ecologist cannot and will not make our value judgments for us. Each of us, as individuals and parts of groups, must make our own decisions and vote accordingly. The ecologists can only tell us what exists and what might happen when we decide to act in certain ways. Societies will make the value judgments – the scientist will only provide information to help us make our choices.
