Interested family, friends, and visiting scientists were given guided tours of the forest experiments. Sometimes a researcher took a “busman’s holiday” to see what new things were happening in other workers’ projects.
Imagine yourself going along on one such tour to see the water input and output measuring equipment. The invisible chemicals (solutes) and larger materials (particulates) are measured in the water that comes into the system (input) and goes out of the system (output).
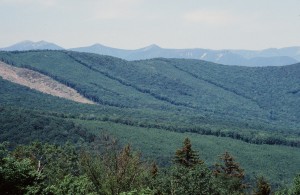
When you are riding in the car whose destination is Watershed 2, the clear-cut, it is hard to believe the lush vegetation of the broad-leaved hardwoods with their intense green. The world is a technicolor movie taken through a green filter.
At a sharp turn, a small waterfall coming over a miniature cement dam appears to the left of the road. It is one of the nine weirs on the drainage basin. The low, foot-thick cement wall forms a three-sided dam. You can see a small stream flowing into a shallow pool over the rock and cement bed behind the dam. Some water is passing through the V-notch centered in the front wall of the dam. Except for creating a pleasant place for water striders, green frogs, and diving beetles, it seems a useless pond.
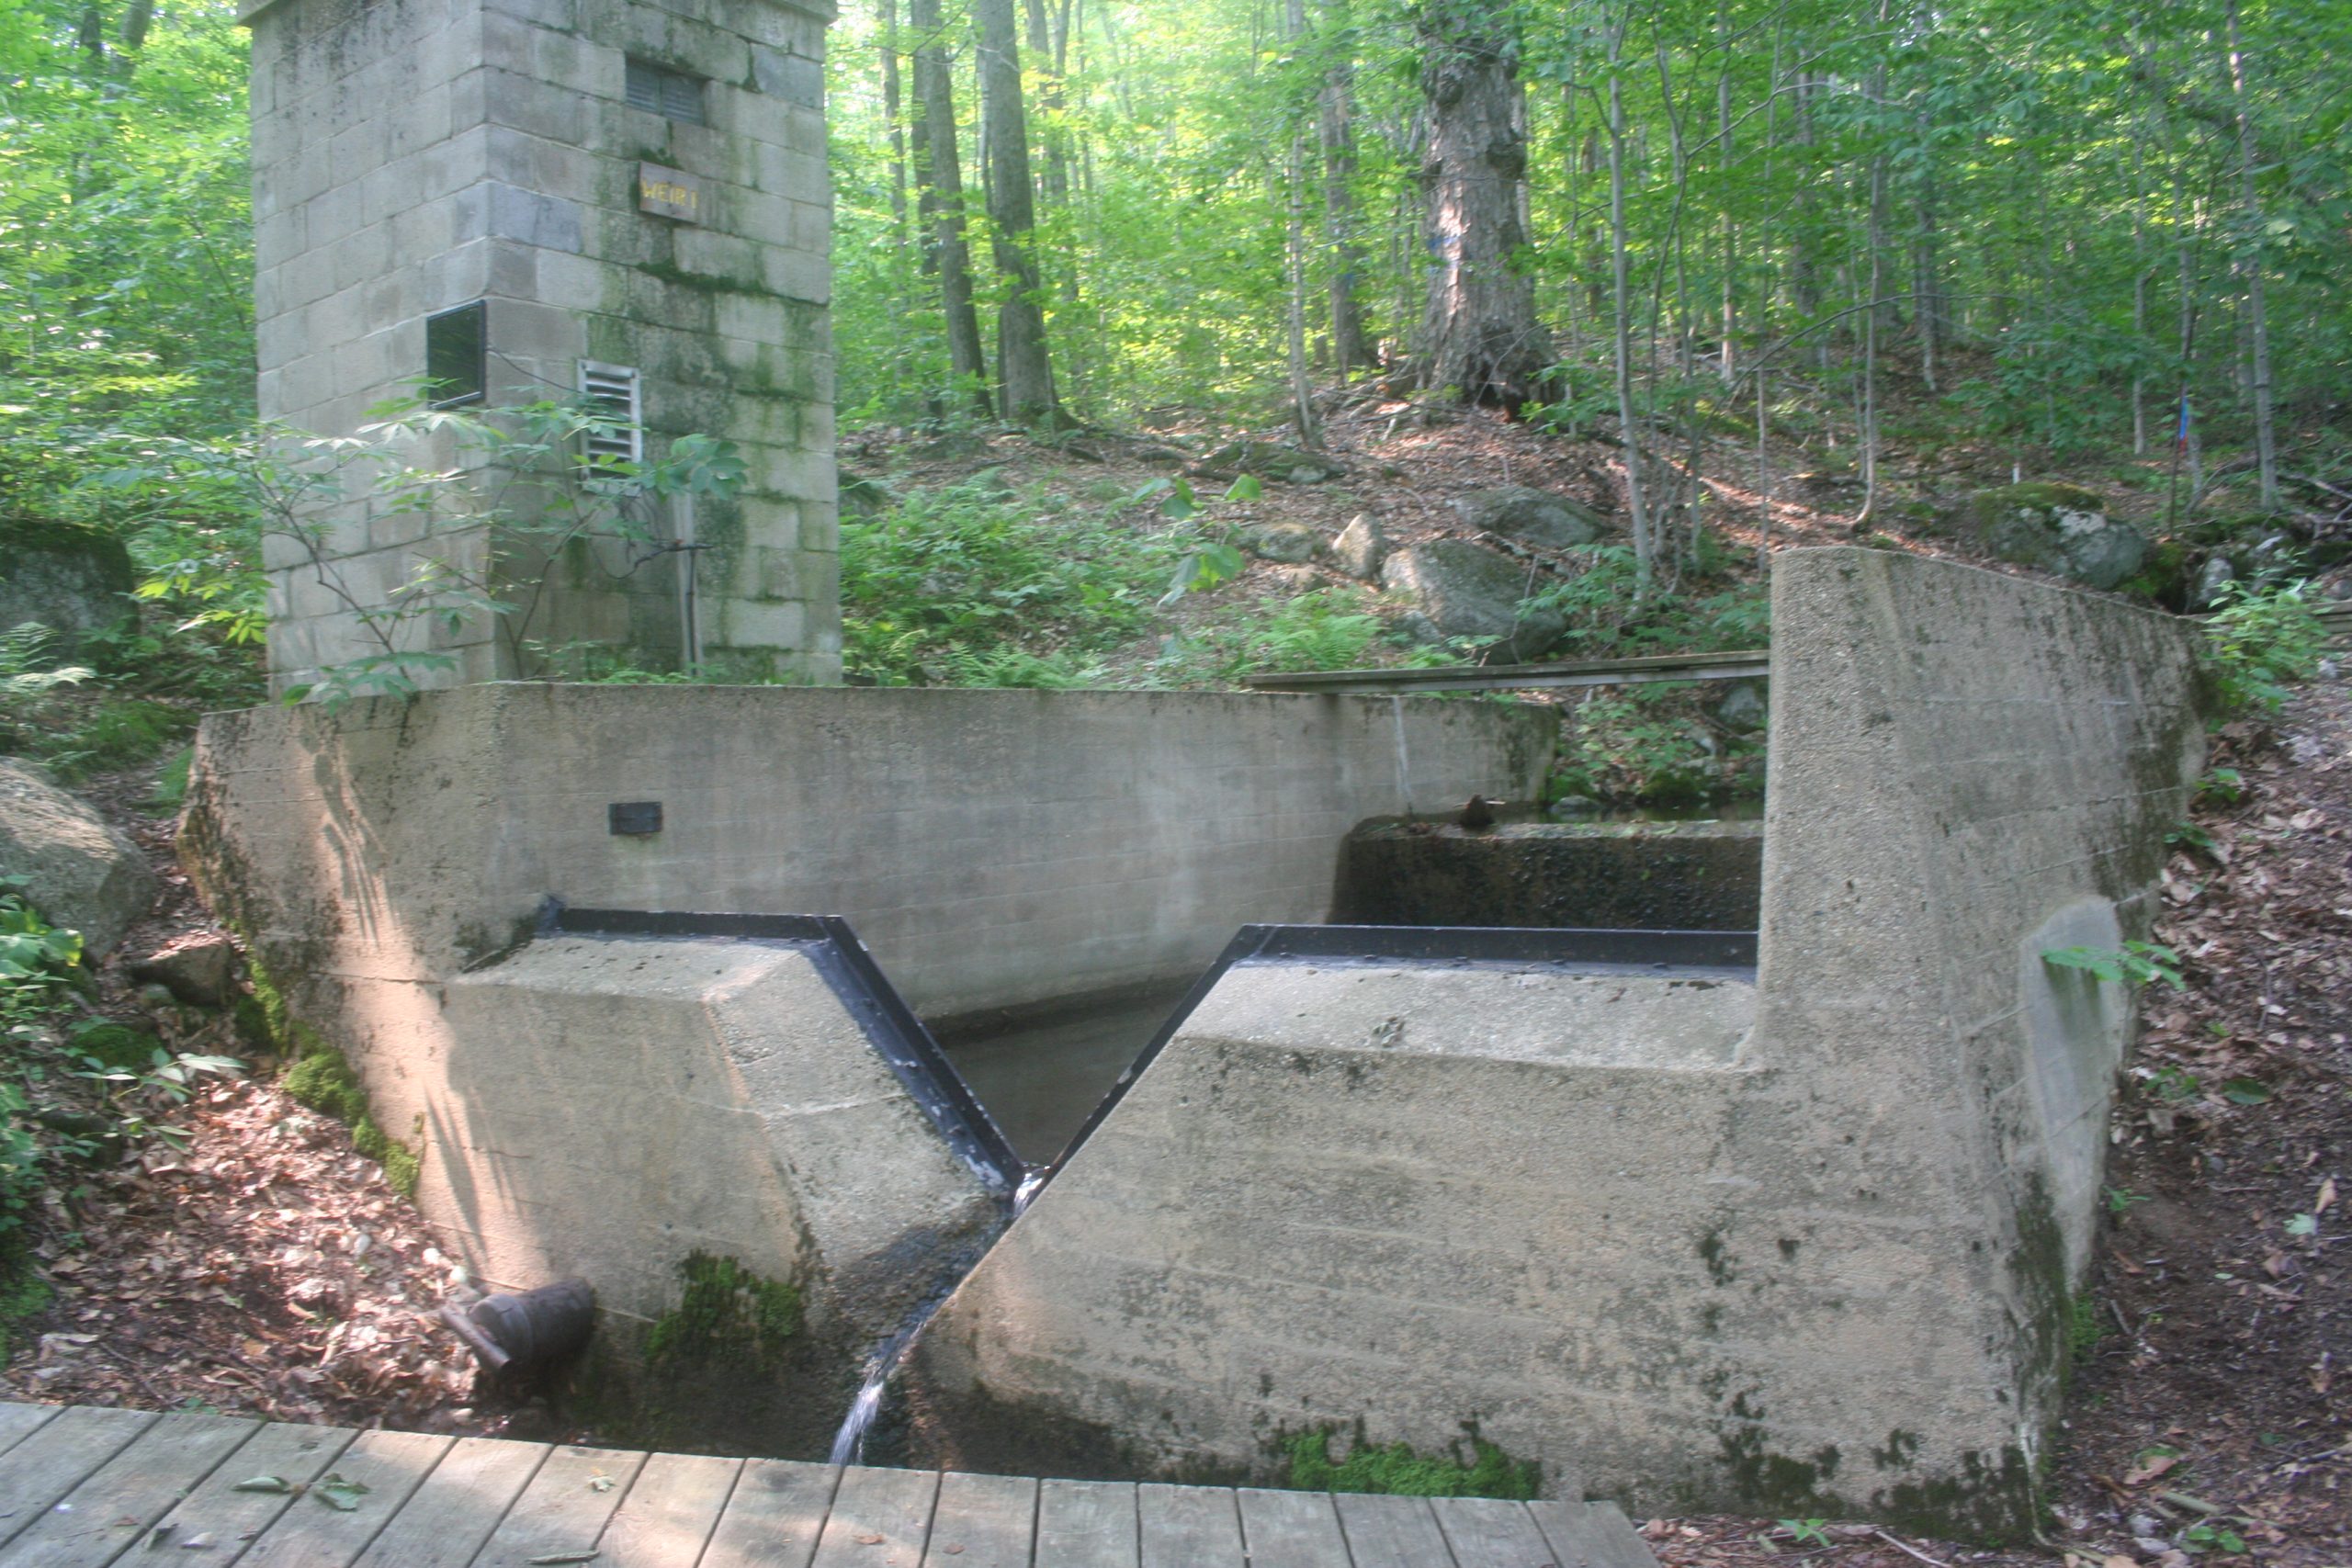
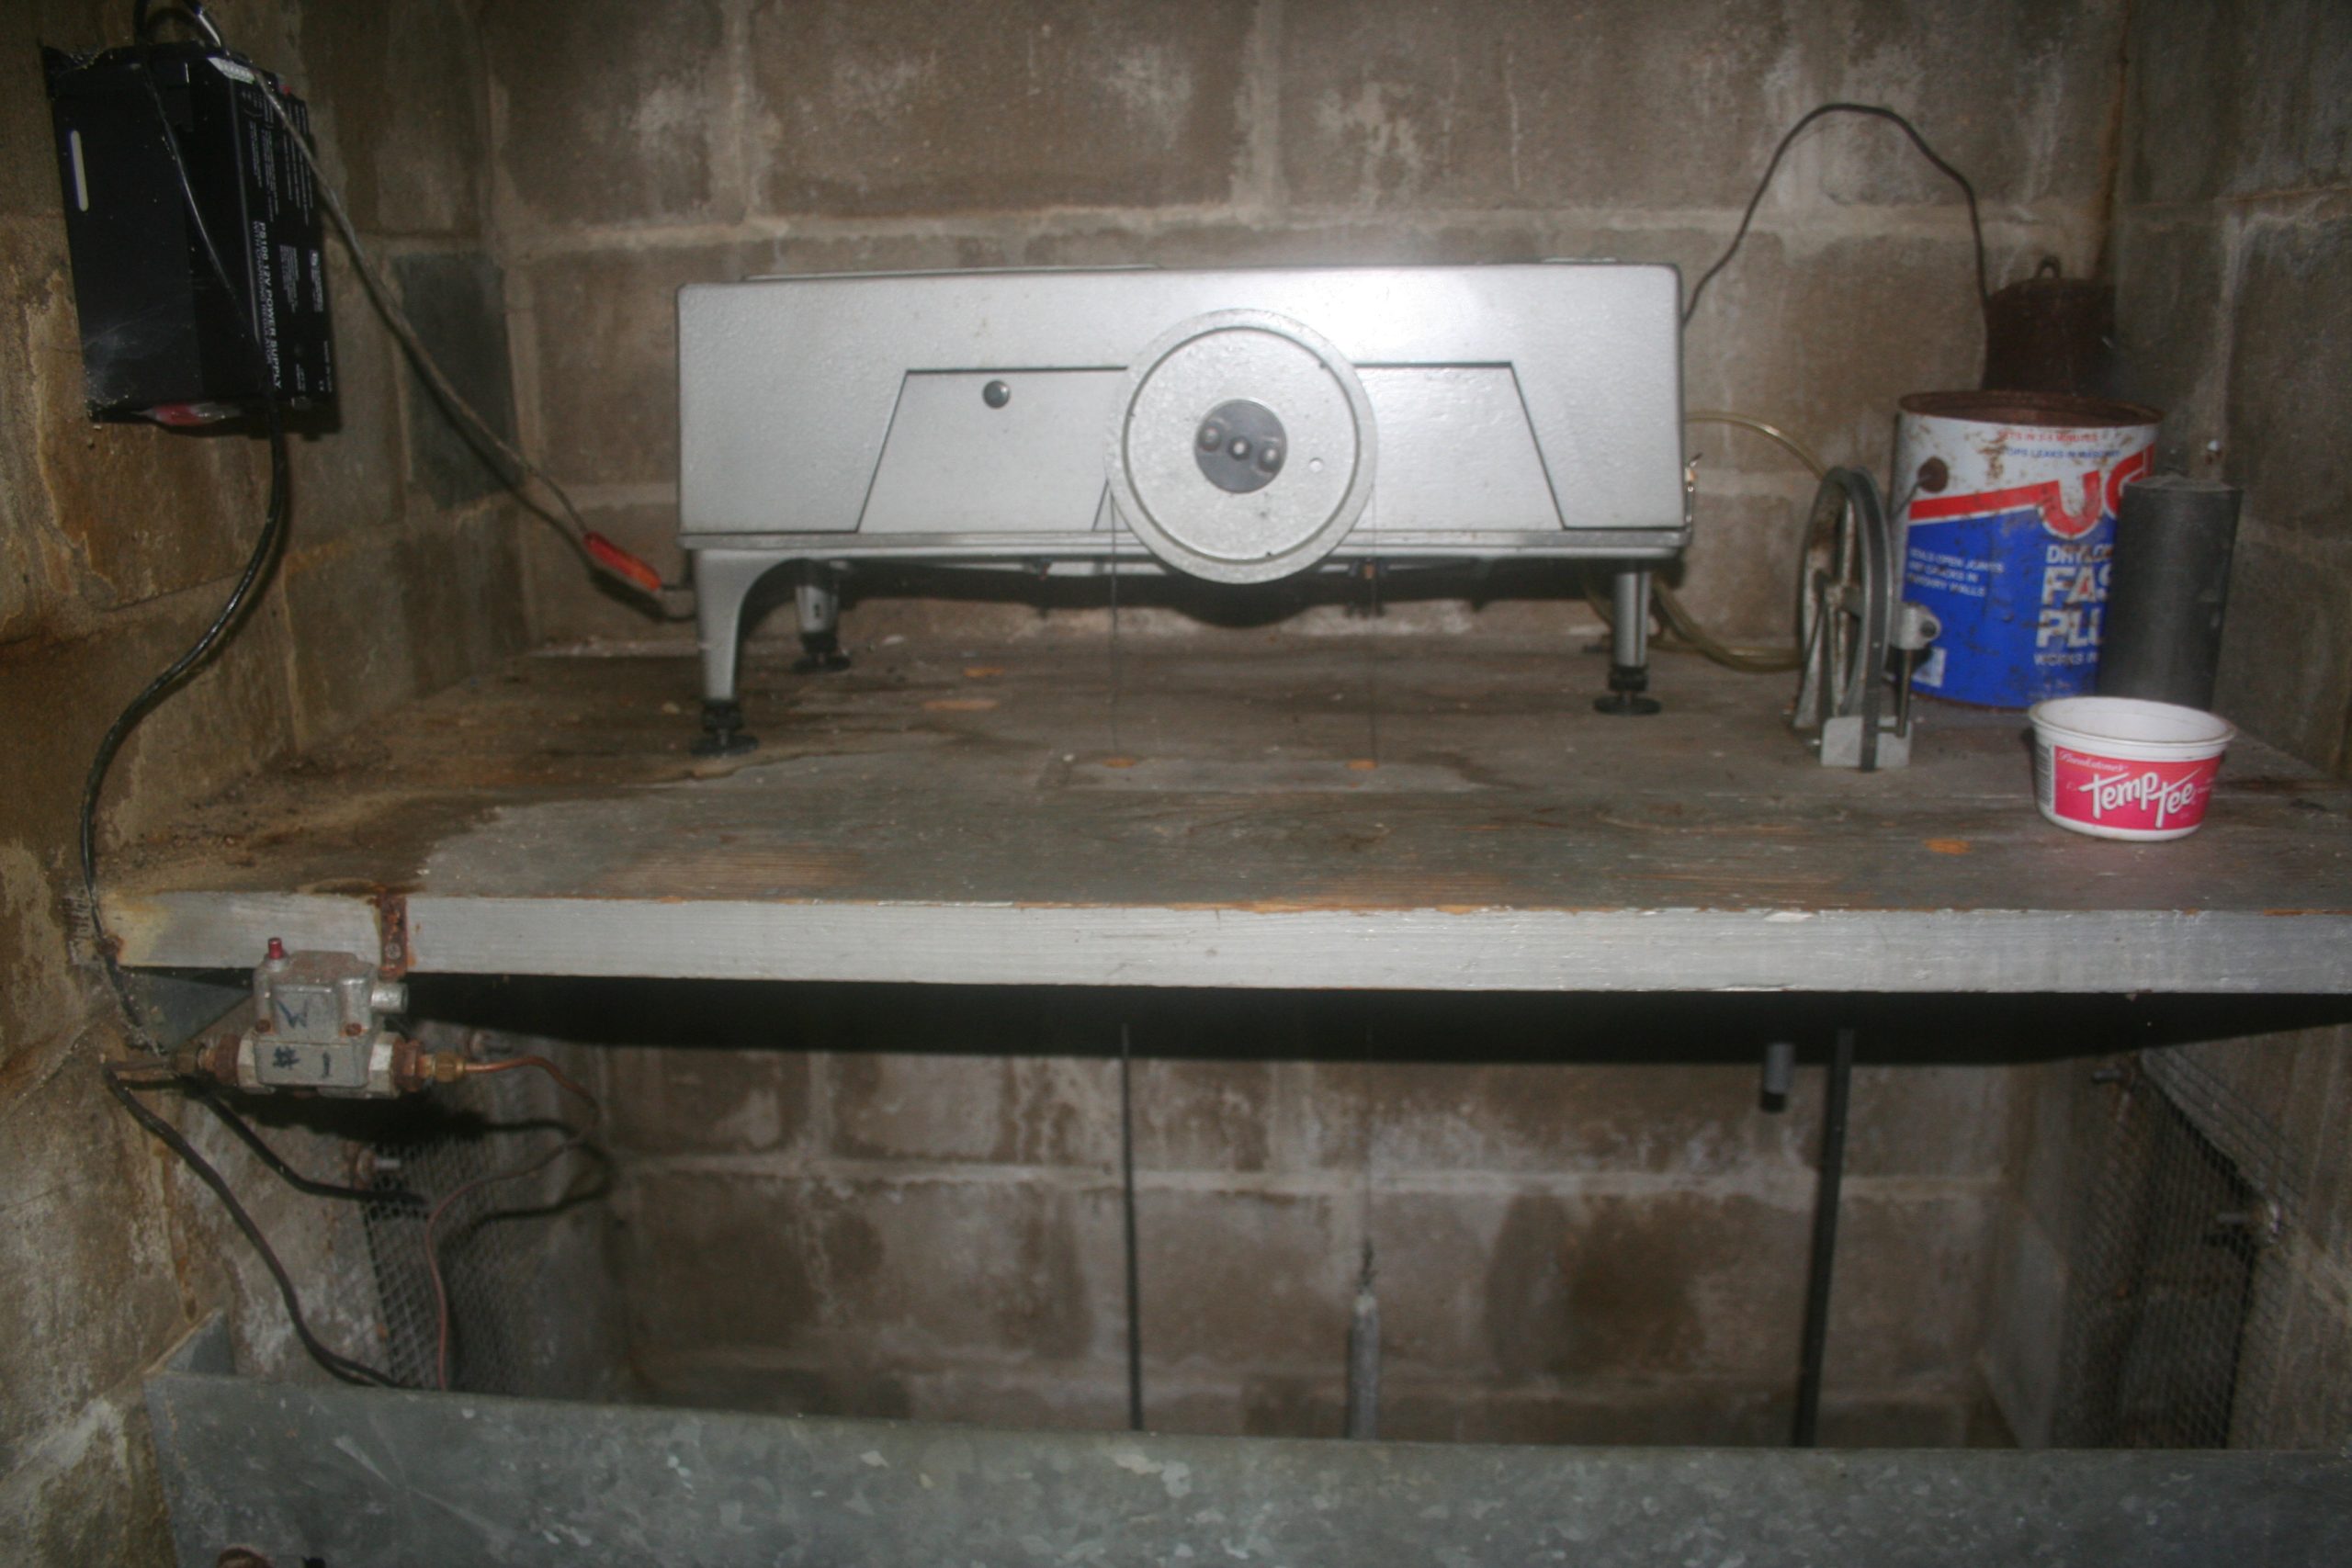
Next to a side wall, a five-foot-square guardhouse rises eight feet tall. Any minute you expect a sentry to rush from its narrow closed door. None will, because this gray blockhouse protects the measuring instruments that keep a continuous record of the amount of water that flows through the V-shaped cut in the dam. Five one-inch round holes in the side wall allow water to flow into the floorless house. The water is always the same level inside the house as in the pond. Since water “seeks” its own level, the protected instruments measure and record the level of the pond by measuring the water level inside the house. The V-notch allows the water to leave the pond gradually and be measured as it flows out. By measuring the water in the pond and the amount running out, scientists can figure how much water is running off the whole Hubbard Brook drainage basin. They measure the amount of chemicals in the runoff, too. All the water that enters this drainage basin leaves by way of small streams like this one, which can be measured.
Imagine yourself standing in a shower with the water running and holding a funnel. All the water that falls on the inside of the funnel will drain down and out the hole, out of the basin.
The slanting hard rocks under the soil act like the sides of your funnel, directing the flow of underground water to surface streams. Extra surface water that can’t be absorbed fast enough by the soil or plants cuts streambeds as it flows down a slope. Surface and underground waters, then, come together in this stream and pass through the weir just as water runs from the end of the imaginary funnel. This stream drops down the hillside to join other streams. These, in turn, join to make Hubbard Brook, the big stream used for swimming and fishing. The semicircling slopes of the mountainsides act like the sides of your funnel. The weir allows the scientist to measure more accurately the amount of water that flows out of the ecosystem.
While instruments at the weir record water output, water gauges near the weather stations measure the input of water into this drainage system from all forms of water – rain, snow, sleet, hail, dew. With accurate input and output measurements, researchers can figure how much water is used or stored in the basin. Then when trees, which use water, are cut, foresters can predict what will happen to water levels of streams below the cut area.
In heavy rains more water falls than the ground can absorb. Extra water runs off as surface water, swelling the streams and moving soil and rock debris as it flows toward the ocean. Slower moving water creates more groundwater which can keep supplying rivers and streams during dry as well as rainy spells. If we don’t take proper care of our watersheds, cities far away from the forests may find themselves with floods from too much run-off water or drought from lack of groundwater.
Hubbard Brook experiments may show that clear-cutting a certain proportion of trees may cause quicker melting of snow cover in the spring and more water in the streams. If there’s a drought, perhaps cutting some trees would leave more water in the soil, since tree leaves transpire – give off to the air – many pounds of water. Experimenters have to try different things, keep accurate records, and analyze to figure out what their numbers, or data, mean.
Graduate assistants have helped take the input and output data. Frequently, they have been chemistry majors as undergraduates, able to do the chemical analysis of the water and particulate matter – materials in the water that can settle to the bottom of the settling basins. First, they must discover what materials were in this ecosystem. Second, they must discover the amounts of materials that occur over a period of time – weeks, months, years, decades, centuries.
Energy and materials may enter, stay, pass through, or escape from an ecosystem. Chemical tests on the water entering and leaving the ecosystem would enable the researchers to learn what happens to the water as it passes through the ecosystem. The water could dissolve materials as it makes its way down the slopes. Or the plants and animals could take materials out of the water. To estimate accurately water and chemical input and output was their main problem.
In order to measure the amount of water output, the Forest Service placed a network of weirs across each small stream that left the ecosystem study area. These V-notched weirs measure the changing flow of water.
In big storms and downpours, when water rushes out over the top of these weirs, Forest Service flumes record the height of the high water. Measurements recorded in the cement blockhouse show how high the water can get.
One assistant’s job has been to collect water samples each week and analyze them for the same chemicals that have been checked in the weather station (input) water: Ca, Mg, Na, K, Al, NH4, Cl, NO3, SO4, HCO3, and SiO2. The amounts of water and chemicals then are fed into a computer at Dartmouth College. The computer takes the Forest Service’s measurements for the volume (V) of stream flow (how much water left the ecosystem) plus the concentration (C) of chemicals recorded during the same sampling period. The resulting figures show the amount of chemicals lost from the ecosystem in kilograms per hectare (K/h): C x V=K/h.
But not everything in the pond is a solute. The researchers have had to figure out how to measure the heavier things – the solid stuff at the bottom of the pool, or particulate matter. The organic material – parts of plants and animals that were alive at one time – and the inorganic material – rocks and soil, materials that have never been alive – must be measured too.
This quiet pool is a settling basin where particles can sink to the bottom. The weir seems like an oversized outdoor bathtub. There is a pipe at the bottom of the cement basin and a plug that can be pulled to empty the basin of water. The water can be drained from the basin through nylon mesh bags. What remains in the basin can be sorted into two piles, one organic and one inorganic. In all stages of decay are wood, twigs, leaves, bark, fruit, bud scales, and invertebrate animals. While in the inorganic pile are all sorts and sizes of cobbles, pebbles, rocks, weathered quartz, sand, and mica. If something is large, it is weighed right on the spot with a Chatillond spring balance. If an item is small, it can be taken to the indoor lab where a technician records its dry weight. A mathematical formula is used to calculate the annual output of larger materials from the ecosystem.
Knowing the amount of organic material passing out of the ecosystem enables the researchers to estimate the energy loss from this matter and to predict future losses.
Since weirs are only half the story, visitors must go up the road, hike to a weather station, and look at the input measuring equipment.
At fifteen miles an hour the car seems to race on the one-lane, curvy dirt road. Sharp eyes will glimpse birds or squirrels along the edge. In ten minutes the car pulls over to the bank, leaving room for another car to squeeze past.
Loop binoculars around your neck and glance up from the road to a clear view of a slice of hillside, barren of green trees. The ridge about the cut area etches a sharp outline against the clear blue sky. The gray-white bareness is startling. A stream flows down the center of the cut-over area and through a weir at its base.
From ridge to road cut, from one edge of the forest to the other, a stark graveyard of barkless trees lie like matchsticks from a box accidentally spilled. Ashen white and gray, the logs are in complete disarray. Long and short logs, one to three feet in diameter, crisscross, rising at odd angles from stacks three, four, and five logs deep.
The bark has completely peeled off, joining the other detritus, or dead plant parts, on the ground. The inner tree cores are left to weather gray like granite and marble tombstones. These are the skeletons of birch, beech, ash, and maple – all hardwoods. Look at one of the logs closely, Count its rings. If there are fifty, the tree was at least fifty years old when it was cut. Tree cells made during a rainy, fast-growth period are larger than those made during the dry parts of the year. The difference in cell size forms what appear to be rings. So each ring represents one year’s growth here in the Northeast where there is only one dry season.
The smooth hard tree cores seem to grow larger as you scramble over them. Push yourself up on one log, walk its length, then step onto another log. Survey each log that crosses your path. Choose the one that angles up the slope toward your goal – the louvered white box on stilts in the middle of the log jam.
Tennis shoes cling to the dry, smooth, unsplintered trunk surfaces. Rubber cleated boots help a climber to stay out of the holes and crevices between logs. If you try to stay topside, jumping or leaping between logs in tennis shoes, you may slip on the smooth, rounded sides. Sliding feet hit the damp slippery sheet of bark under the log and keep slipping. Bark only partially decayed is wet and very slippery.
A slower, more careful pace pays unexpected rewards. If you see a quick movement between the logs, watch and wait. A mouse may jump from a gray crevice to the dark brown bark beneath your log. Coarse, yellowish-brown fur covers its back, blending into a dark brown strip that meets white fur along the side. The tail is very long. The mouse rises up on its hind feet, revealing its soft white belly. As suddenly as it appeared, the mouse jumps out of sight into a jumble of detritus under the logs. The jumping mouse, Napaeozapus, likes areas like this. There is a lot of protective covering, and seeds float in from the forest or have been scattered by the fallen trees. Food and protection – what more could a mouse ask? A jumping mouse can jump like a kangaroo, using its long tail for a three-point takeoff and landing. Napaeozapus moves by running and jumping. Jumping is a quicker way to cover ground and escape a pursuing predator.
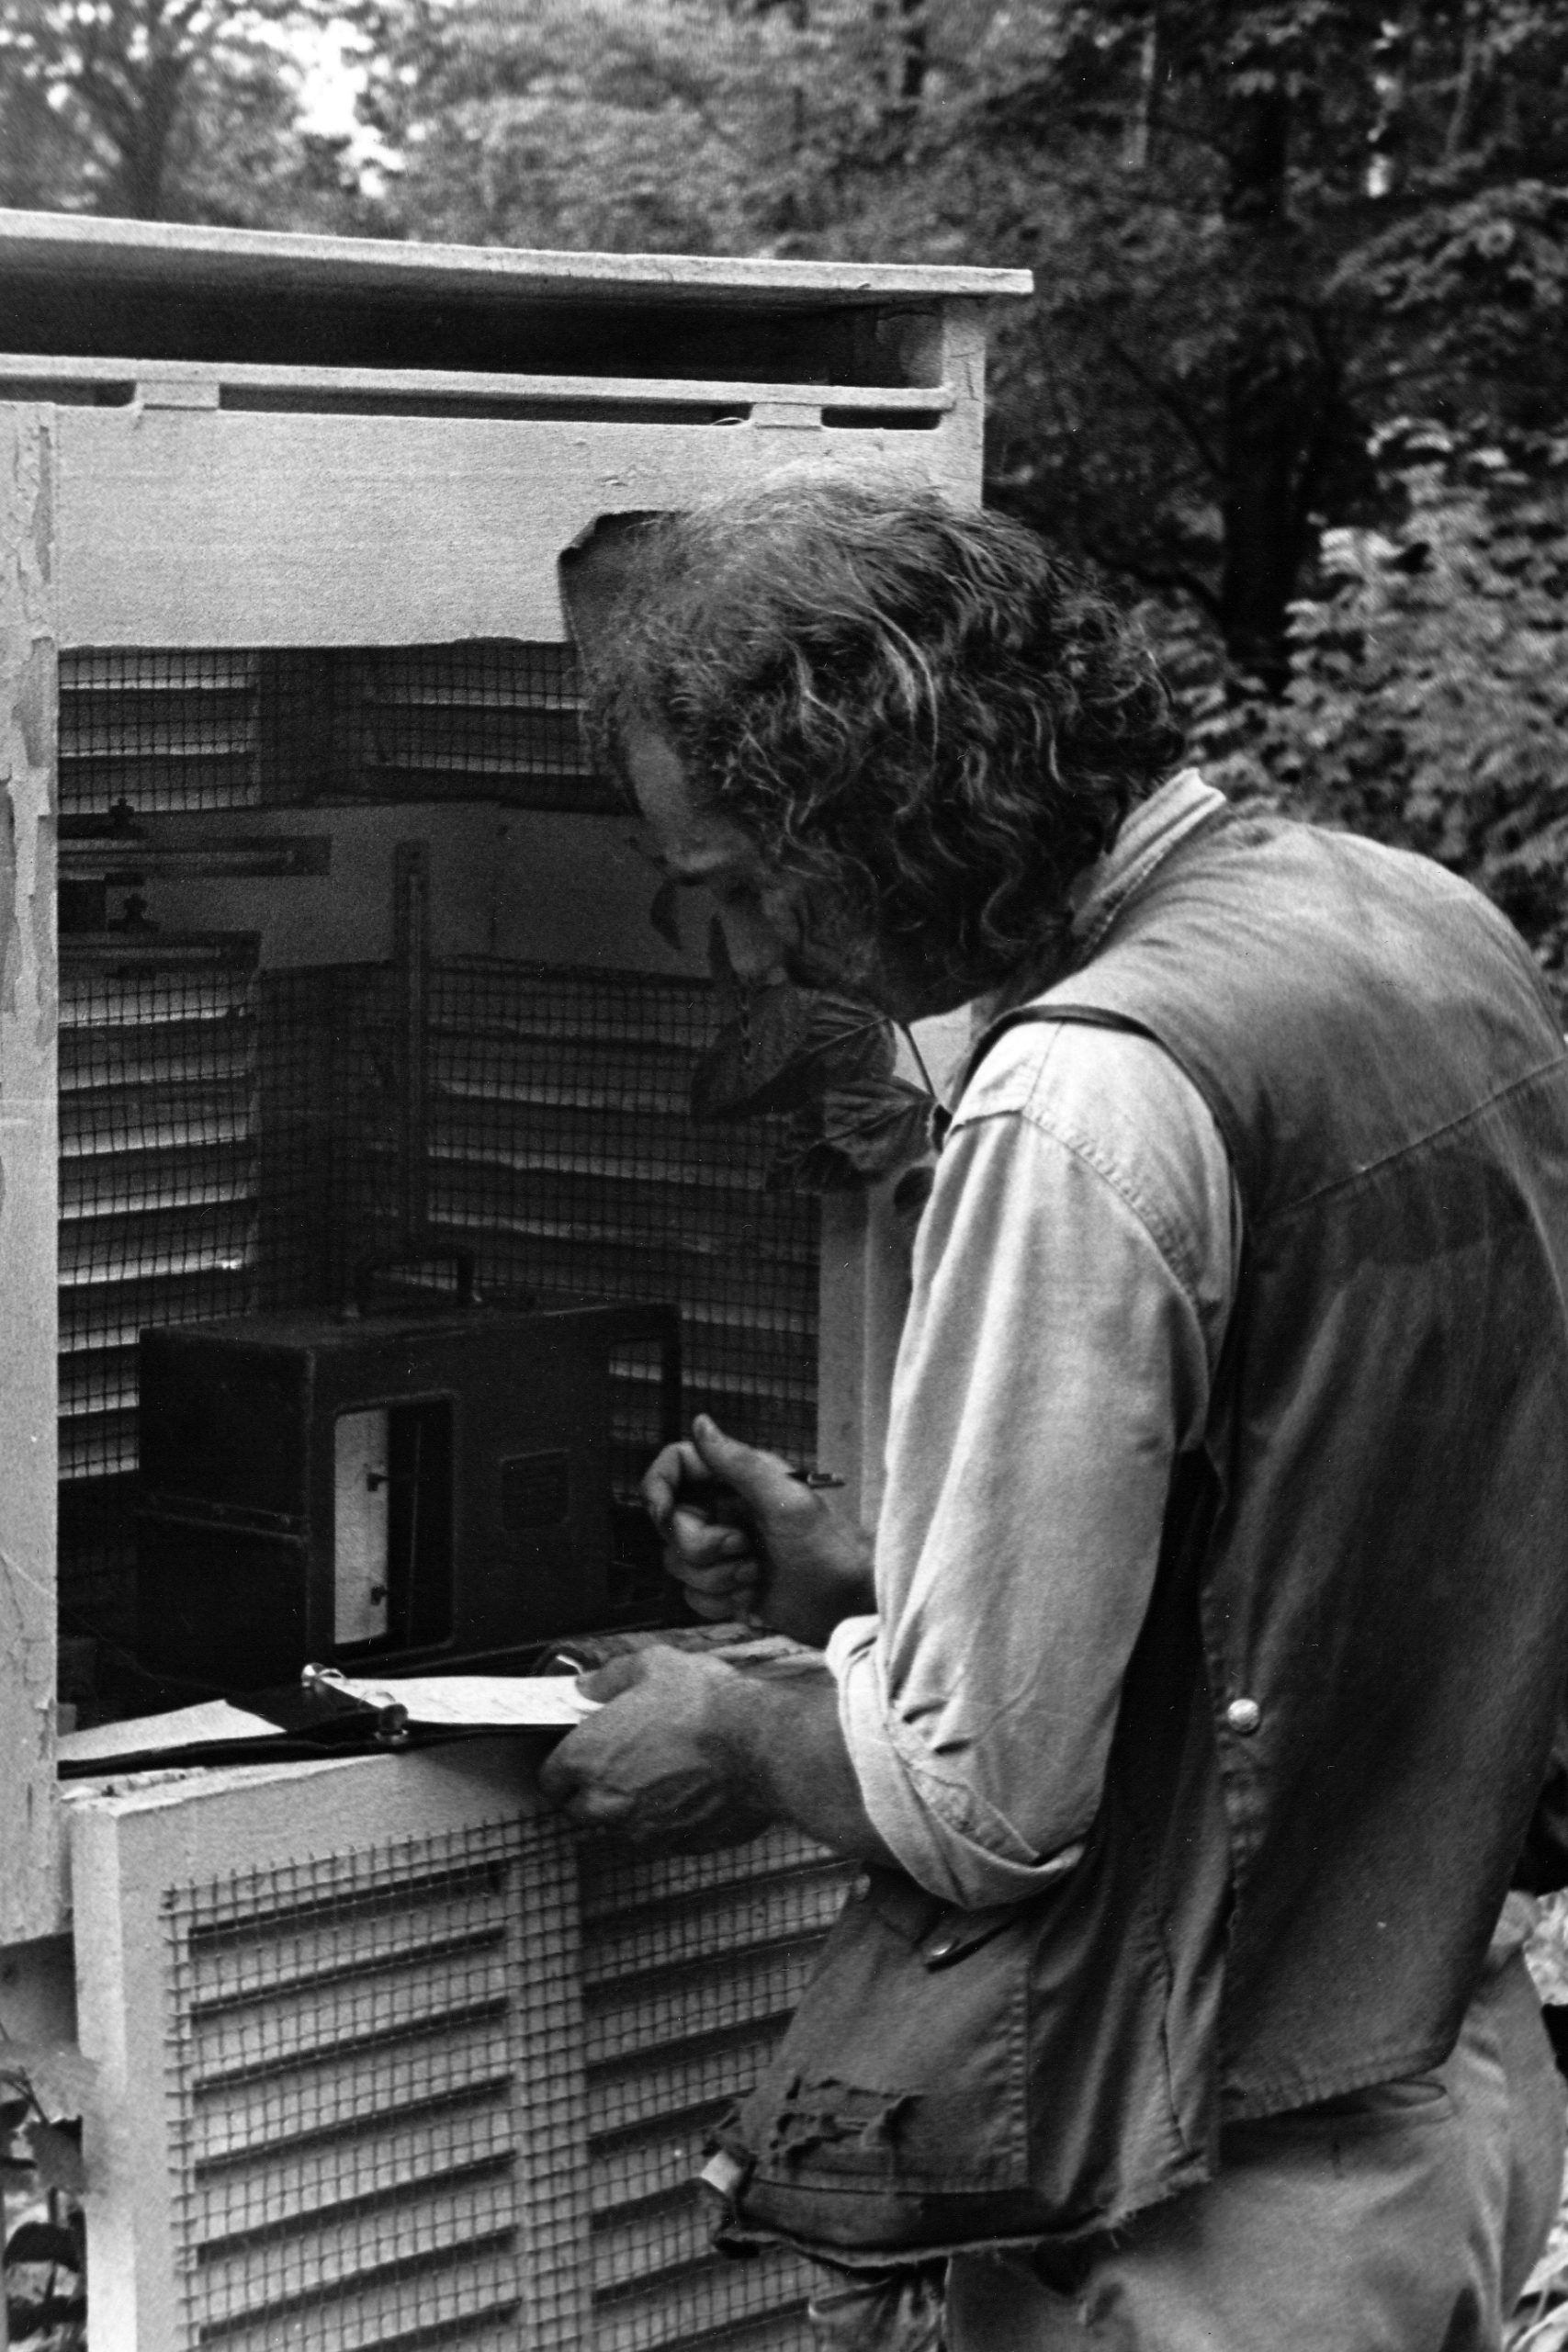
The white box on stilts is a weather station with an anemometer for measuring wind, a rain gauge for measuring precipitation, and a maximum and minimum thermometer for measuring the highest and lowest air temperatures.
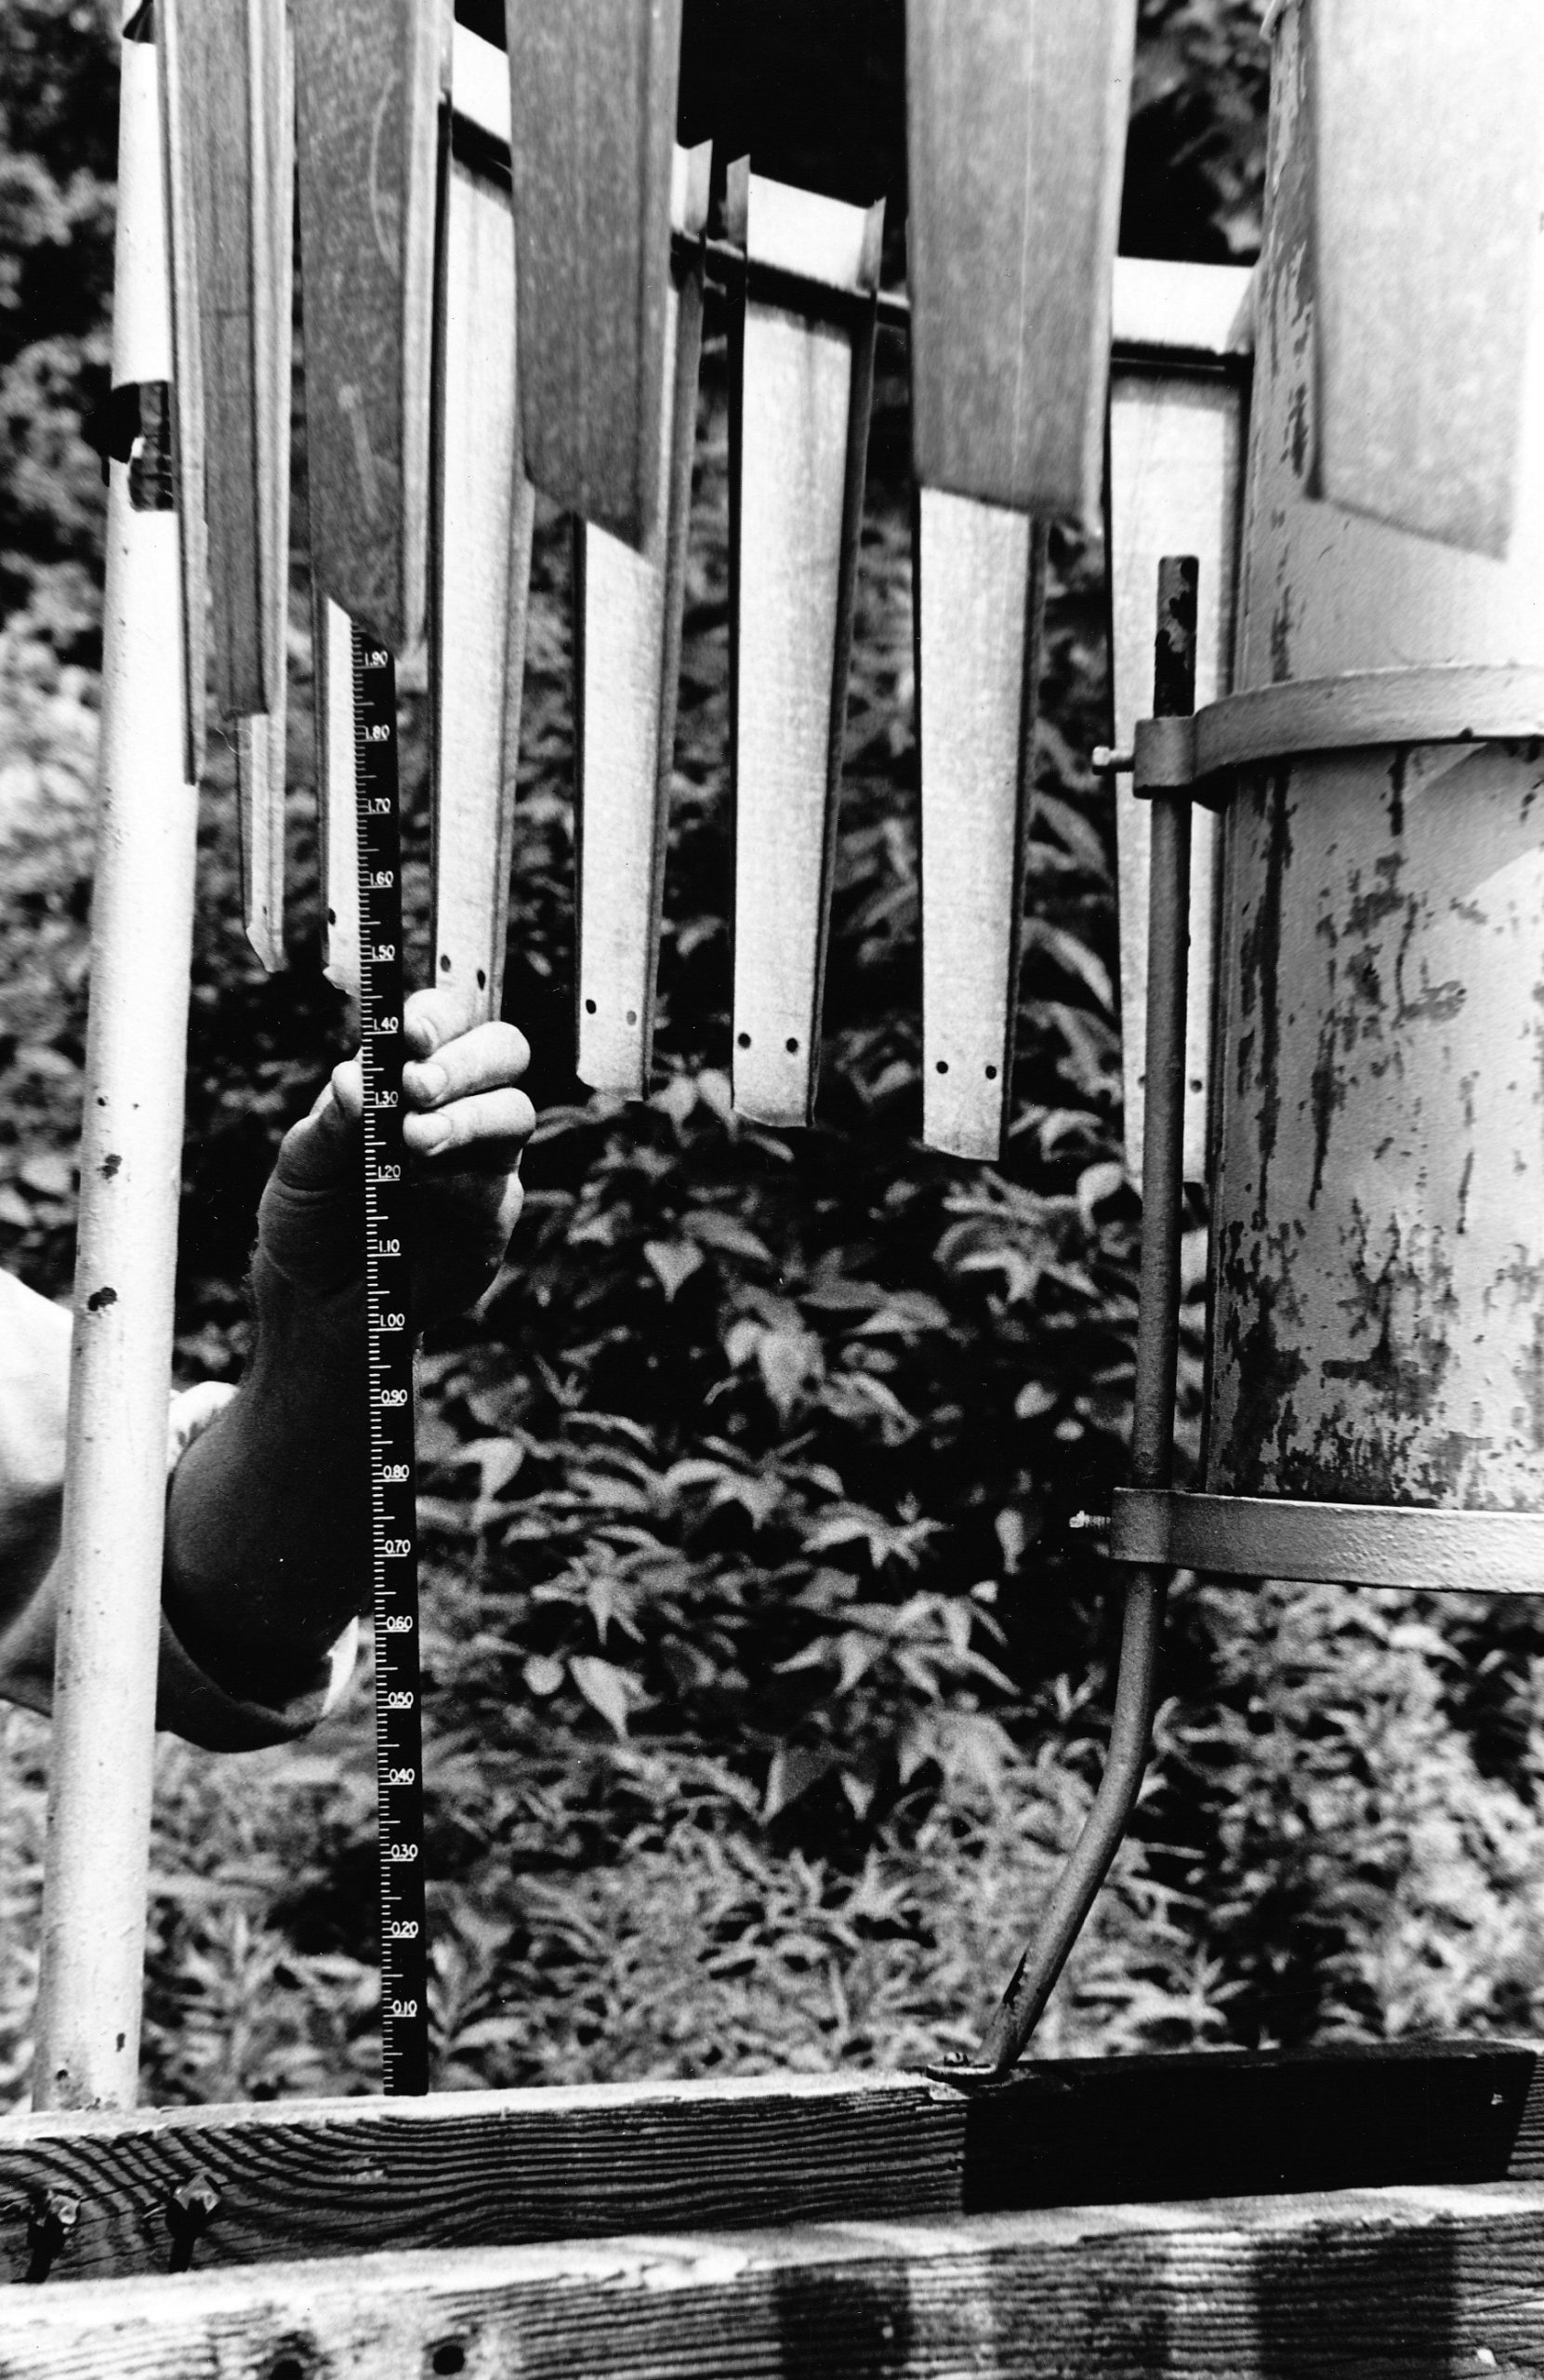
The rain gauge is a metal cylinder having an inverted cone-shaped top with an eight-inch-diameter opening. Water from the air rises along a ruler, or gauge, in the cylinder. A curious set of aluminum pennants hangs from a metal wire that encircles the opening of the gauge. The pennants move with only a slight gust of wind. These are good wind deflectors. The water collected must be only what falls straight down, not what is blown in from the sides.
The maximum and minimum thermometer hangs in the louvered white box. Metal bars rest on the ends of the mercury, which push the bars to the highest and lowest numbers as the temperature rises and falls. The data gatherers record the daily temperatures and then move the metal bars with a magnet to rest again on the mercury’s two ends.
On top of the white box, twirling cups of the anemometer catch the breezes. Turning cups move a red stylus that marks an uneven red line on the paper attached to a turning drum inside the white box. The stylus continuously records the turning rate of the cups and consequently the force of the wind blowing the cups around and around.
It took three years before Dr. Likens felt that the weather measurements were accurate. When this book first came out, Hubbard Brook had recorded over twelve years of daily facts. Now it has recorded 50 years of weather information! There is so much variation from year to year that it takes several years to get enough data for dependable averages. Now fairly correct predictions can be made with only small margins of error for rainfall and temperature. Weather data are now available to anyone working on a project in the study area.
The Forest Service has been measuring precipitation for many, many years. There is about one gauge for every 32 acres (13 hectares). They are located on each experimental plot and in the undisturbed forest. The Forest Service measurements have helped the ecologists a lot, but further measurements have been needed.
What chemicals are in the water that reaches the ground? These chemicals are available to life beneath the canopy. To make measurements, the ecologists set up collecting spots throughout their study areas. When it rains or storms, some poor graduate students must rush out to the forest to take water samples from each collecting site, getting drenched in the process.
Even up here away from the manufacturing and cities, researchers are finding heavier acid rains. The air currents take some of the pollutants away from their sources and spread them all over the countryside. Changes in the acidity of rain measurements are an indicator of more or less pollutants in the air. Just as a thermometer measures the warmth of the air, degree of acidity can measure air pollution. Fifty years of records tell us that acidity of rain increased by more than 100 times in some places.
Will pollution continue to increase? People in the country who share the many manufactured products and modern conveniences produced near the cities find themselves sharing the unhealthy by-products too.
In a clear-cut it is hot. Layers of sweater and jacket come off. The slight air movement that lightly touches faces, drying and cooling them by evaporating perspiration, is appreciated.
A clear-cut “happening” will make you forget the heat. Tip your head backward and fasten your eyes on a piece of sky over the clearing. There, hanging in the air, upright as if it were standing on its tail, a kestrel (previously known as a “sparrow hawk”) is batting its wings. Like a helicopter, it stays in one spot. Its strong, magnifying eyes probe the clearing for food. Through binoculars you can see its reddish cap surrounded by blue, the same slate blue that bars its wings. The male’s rufous back and tail accent the blue. Its dark-black sideburns give it a proud, medieval look. In one smooth, quick motion, its long pointed wings fold close to its broad shoulders as it arches downward, diving like a free-falling missile. At the last moment feet thrust forward, wings spread to catch the air, and the kestrel, with a furry mouse clutched hard in its talons, rises quickly to a high limb of a yellow birch beside the cut area. Was it that jumping mouse? This microenvironment suits the red-backed mouse and white-footed mouse too. Which has been prey for the predator?

Making a clearing changes the kinds of plants and animals that can live in an area. There’s more cover for safety, more seeds and food for more mice. More mice mean more food for our kestrel friends.
Halfway to the stream, stop and peer at the side of a gray log. Poke a thin weed down a tiny but perfectly round neat hole. Near another hole just like it a long narrow beetle flashes its shiny metallic green and purple in the sun. Half an inch long, its six legs move it securely up the round log. The boring beetle is another member of the clear-cut community.
