Principal Hubbard Brook investigators like Dr. Likens and Dr. Bormann obtained their own grants of money from the National Science Foundation to cover research expenses. They asked other recognized research scientists to work under their “umbrella” and figure out sections of the Hubbard Brook ecological jigsaw puzzle. Their grant enabled them to give summer salaries to students working on master’s and doctoral degrees. Students earned their degrees and at the same time worked on their chosen pieces of the Hubbard Brook ecosystem.
While Dr. Likens gave intensive study to the aquatic ecology of the study area, Dr. Bormann, a botanist, became the terrestrial ecologist and looked at the plants. As plant taxonomist for the group, he named and identified the plants. Concentrating on the woody vegetation and the forest ecology, he listed all the species or kinds of plants present. Then he counted how many of each species grew in the study area. He chose Watershed 6 to sample. It was impossible to count every tree, shrub, and sapling in his sample study area. So he marked off a 25-meter-square grid and numbered each square in the grid.
If you numbered each square on a piece of graph paper, you would be making the same kind of chart as Dr. Bormann did in the forest.
Next, he selected at random the squares to sample. Each square had the same chance to become a sample square. After the sample squares were selected, all the plants in each sample were counted and recorded by species name.
The part, or percentage, of the sample square covered by the canopy – the portions of the sky covered by the top branches of the trees – was recorded too.
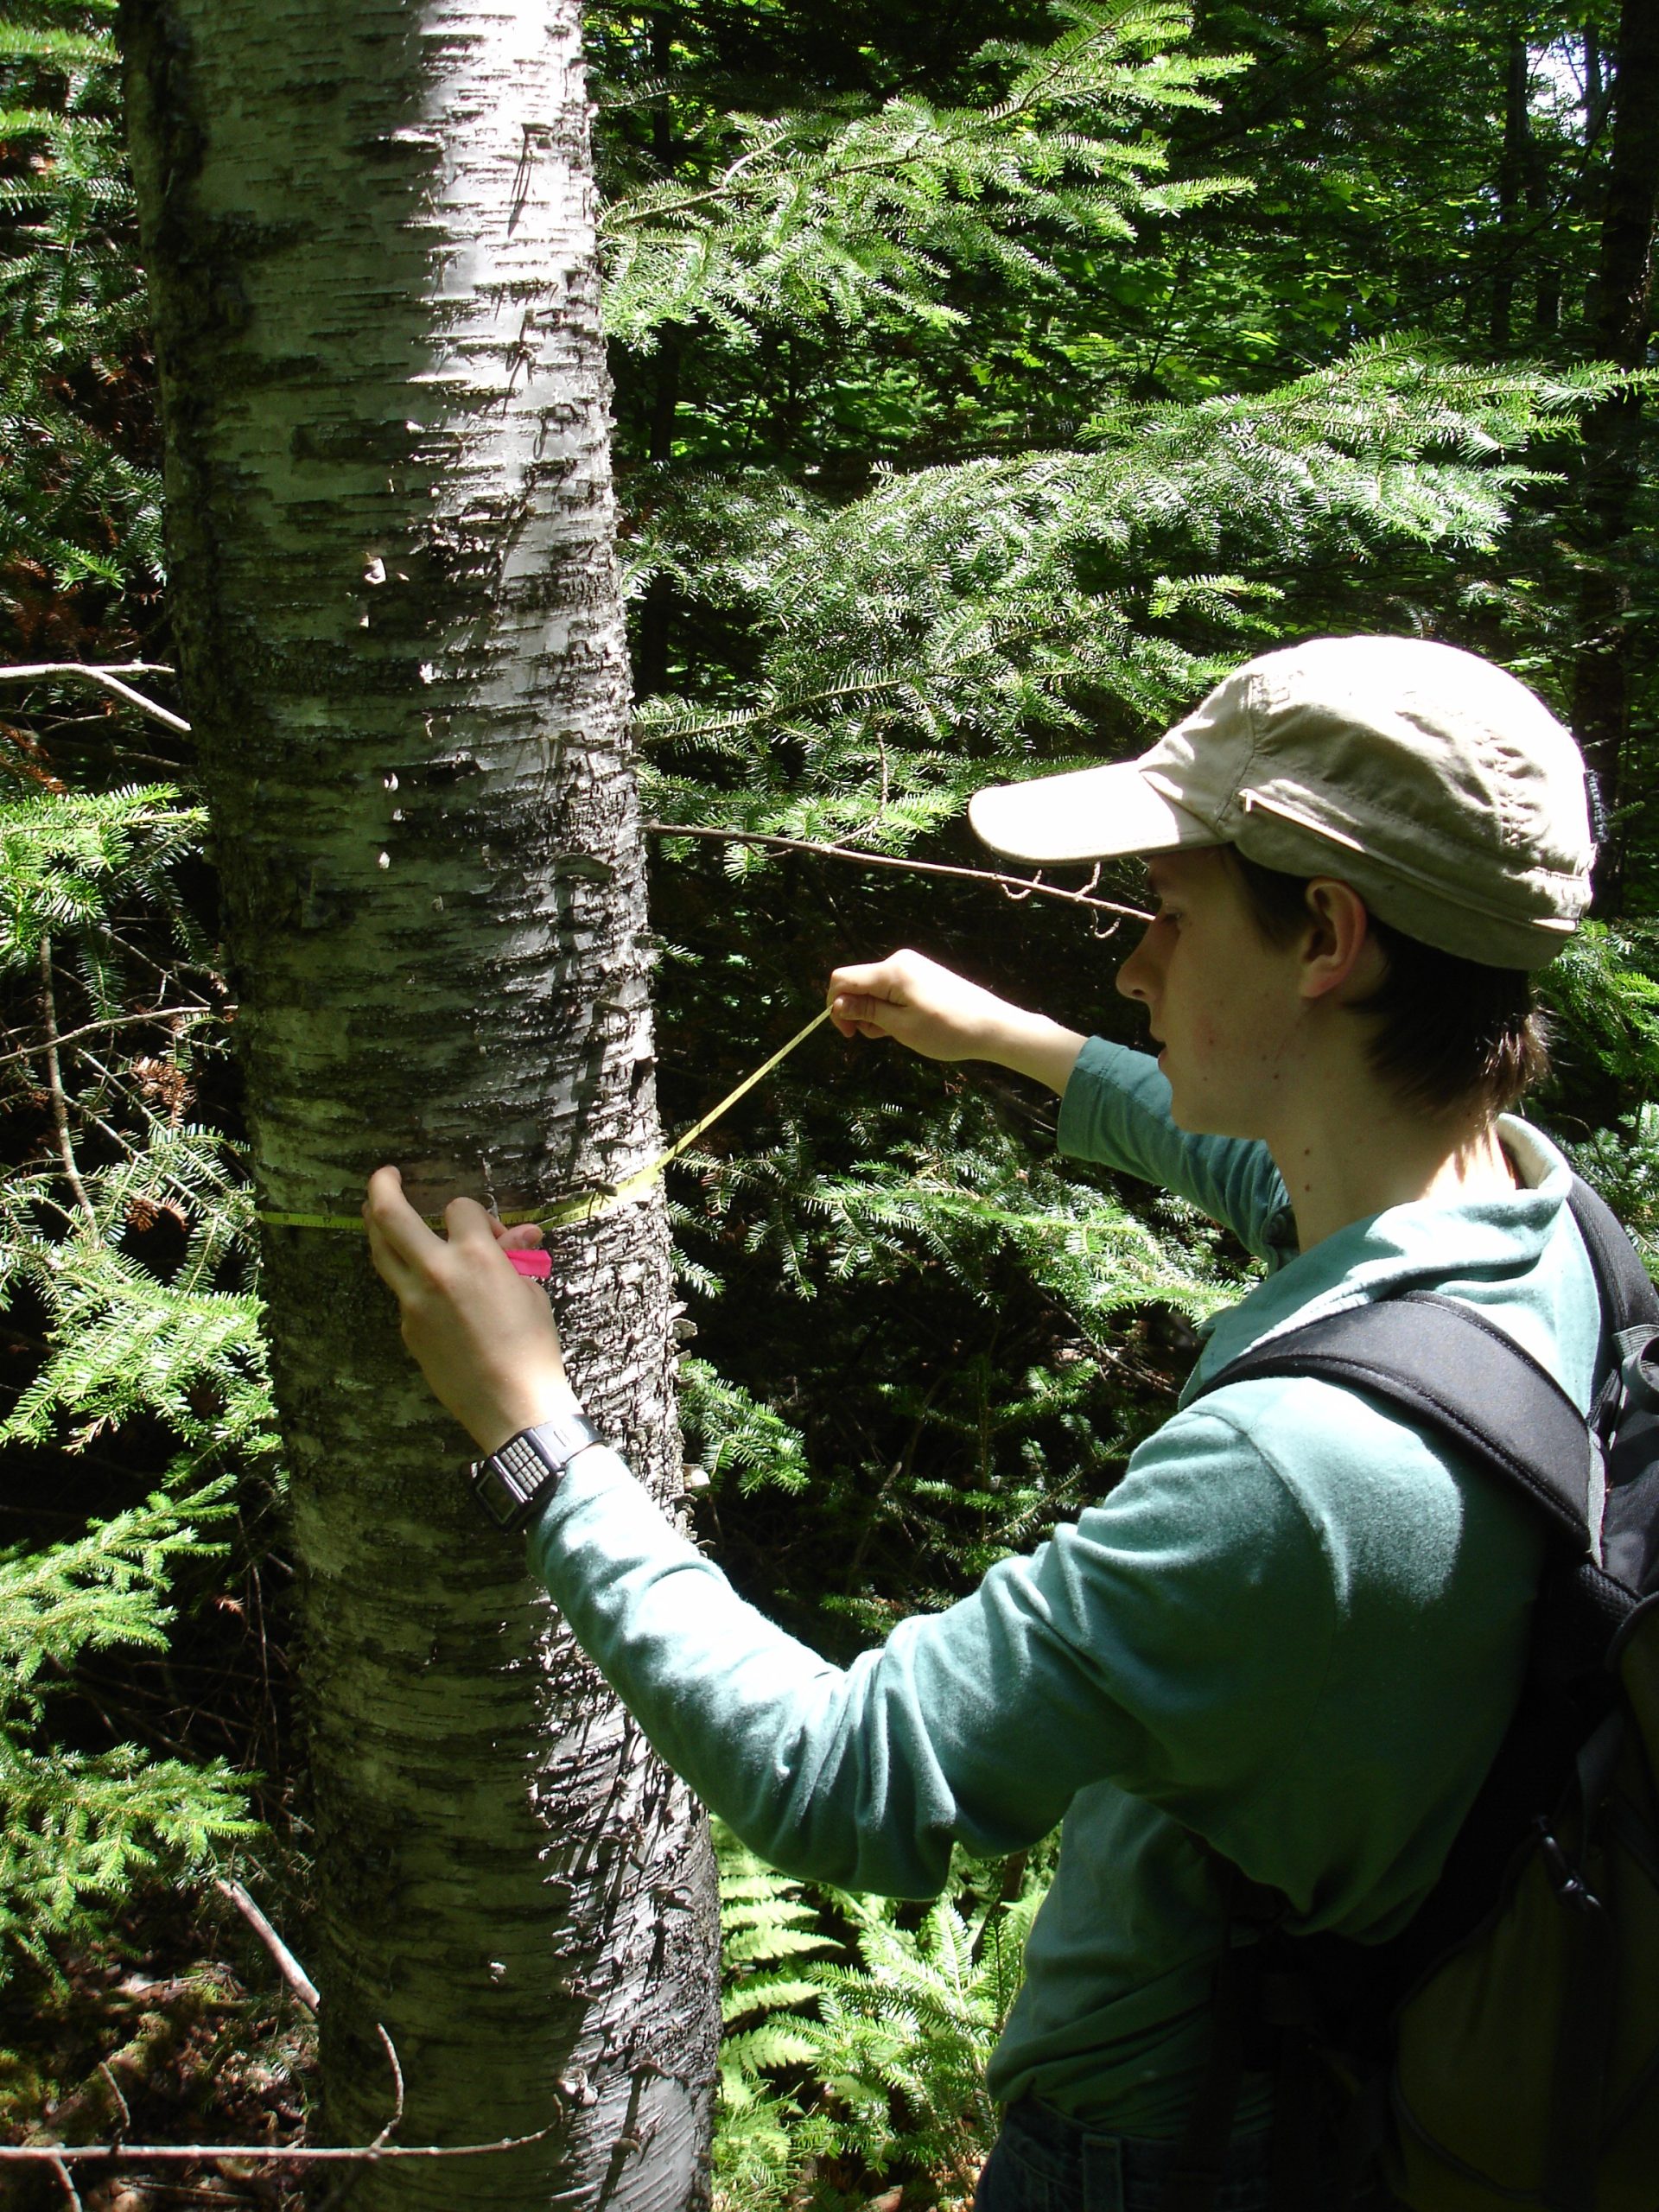
To figure out the standing crop or biomass of the woody plants, the DBH, or diameter of each plant at breast height (four and a half feet off the ground), the height of the plant, and the surface area of each stem were measured.
In figuring out the nutrient content, or the chemicals present, and the energy content, a measured amount of each type of plant was burned in a device called a bomb calorimeter. This measured the amount of heat energy given off. Then the ash was analyzed for chemicals. Mathematical formulas were used to figure the amount of energy in the plant biomass of each sample area and the amount of energy in the plant biomass for the whole study area. The nutrient content was expressed in kilograms per hectare, while the energy content was expressed in calories per hectare. The ecologist multiplied the number of kilograms or calories by the number of hectares in his study plot and the forest. In this way the total amount of mineral content and energy for the study area and the forest could be determined.
Plant density was reported for three elevational levels: lower (maximum density), mid-levels (less dense), and the highest levels (least dense).
Dr. Robert Whitaker sampled the major tree species. Cutting six of each species, he measured their dry weight. He hoped to get a base line against which to measure forest changes. One goal was to learn how much new biomass the major tree species created from the energy they received.
During the time Dr. Bormann was determining the composition (what was there) and dynamics (how it worked) of the control watershed, he liked to get a bird’s-eye view of the mountains and the basins by climbing favorite peaks that were in the Hubbard Brook basin, but out of the watershed area he studied.
He led expeditions and invited anyone around who wanted to hike. One afternoon his daughter, Becky, Dave Z., a birder, and Sheryl, a birder’s daughter, joined an expedition to the top of Mt. Kineo.
As they left the road, the forest closed like a soundproof door behind them. A whitethroat’s song, clear and loud a few steps before, was faint and soon lost as the climbers penetrated deeper into the woods. They immediately felt cooler. Entering the forest was like entering an air-conditioned room after a full blast of humid summer heat.
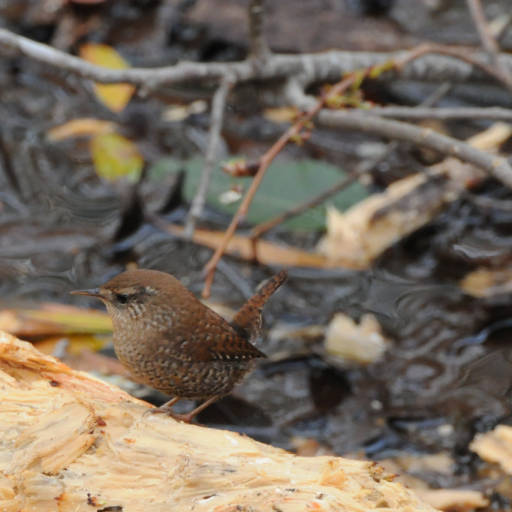
Here high quick trills and tinkling warbles rolled over each other again and again. The songster exercised his voice, ending on one high trill. Again, but closer, the beautiful full song filled the forest with melody. It must be a large bird to have such a large voice.
A “non-birder” would have scanned the treetops. But Dave pointed to the top of a small young bush. Straining their eyes, the girls finally spotted a tiny brown bird. When the song continued, Sheryl focused her binoculars, expecting to eliminate this speck of bird as the source of song. Surprisingly its throat vibrated with each trill. No more than four and a half inches from beak to tail tip, the winter wren had its stubby fanned-out tail cocked jauntily over its back. A long line over its eye resembled the line of a white eyebrow pencil. Its white belly was heavily barred with brown. Its rounded, dark-brown body shook with bursts of song. Finally the song ended. There was a silence and an emptiness in the forest. Bobbing its head, the winter wren flitted to a mossy table of stems and branch ends on the low damp rocks next to the stream.
Thunk, thunk, thunk – a downy woodpecker caught their ears and then their eyes. The black-and-white back and striking red spot on top of his head were very familiar. “Downies” make their homes in many places. They are widely distributed. They don’t have to migrate like many insect-eating birds. Their steady supply of insect food is from the eggs and pupae formed in the fall and lying dormant though the cold winter in the bark of trees. They are not dependent on the warming spring’s burst of new insects.
Windfall, the weakened limbs of trees blown to the ground, made treacherous footing as it lay wholly or partially hidden beneath the past fall’s brown leaves. A cover of dried surface leaves hid the spongy, slippery layers of leaves holding winter and spring moisture.
Among established beech, sugar maple, birch, and occasional ash and hemlock, spindly saplings tried to grow and to add more leaves to the canopy above. Seeking a spot to bask in the sun’s light, the young trees found the going rough. The canopy was already thick, crowding out newcomers. Very few young trees would get enough food, needed for growth, with only the filtered sunlight slipping though the leaves above them. What kinds of plants would grow in the new environment created by the shade? The success of the tall trees had changed the growing conditions for any newcomers. Though the future of the young trees was uncertain, their presence at the moment aided the hikers, who grabbed limbs to pull themselves up the hillside in their scramble to the top of Mt. Kineo.
Dr. Bormann was a rapid, enthusiastic climber, always in the lead. Leaving the level forest floor, the expedition followed him up rocky stream beds blocked by giant wedges of granite rock to be skirted on the steep stream banks, through dense table of stunted spruce whose sharp needles and rough nubs dub into their clothing and scratched their hands as they covered their heads. Using the full weight of their bodies, they broke through the short, tight, flexible branches that filled the space between the spruce trees.
There weren’t many clumps of needled evergreen trees in these mountains, but they really stuck together! The hikers couldn’t see the mountain for the trees and almost missed the top. As they concentrated on each step, pressure toward the toes of their boots instead of the heels told them they were going down the other side. Dave climbed a tree to reconnoiter and reported they had indeed found the top. Down was two ways.
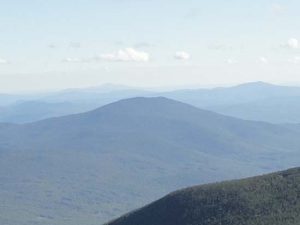
Dr. Bormann, waiting for the group, had found a rocky outcrop. They all peered straight across the valley, as a bird would fly, to Mt. Mooselauke. Turning their heads 180 degrees, they could see another valley with its surrounding mountains – another basin.
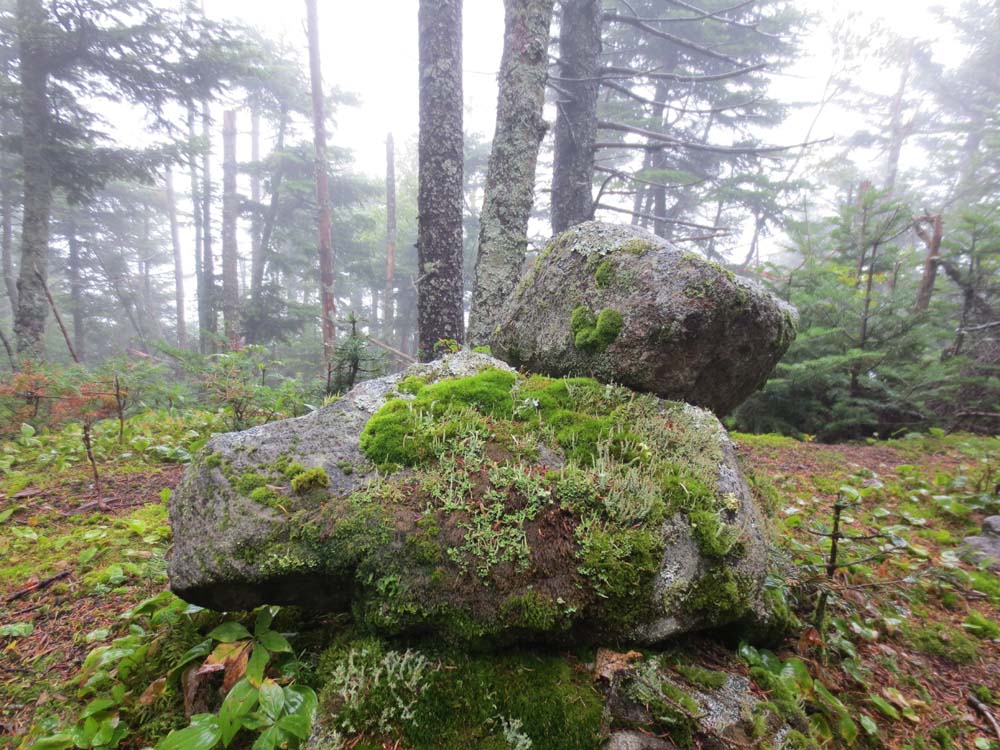
It had been worth the climb, the scratches, and the three hours to conquer a mountain. The trees below were framed against a cloudless blue sky.
The trees they saw as they gazed across the valleys were not uncut, virgin forests. Except for a few protected acres, the virgin forests of Native American days were gone. The forests had been harvested several times since the pioneers had built their cabins, made their furniture, and burned their logs. These trees were a renewable resource. Handled properly, this forest would provide enjoyment for future peoples.
On the way down the mountain, Dr. Bormann introduced the group to spruce gum, a hard resin from the spruce tree that became soft like chewing gum as the hikers heated it in their mouths. Turning the resin into gum required alternate chewing and spitting for about fifteen minutes. The taste was terrible. It was like the odor of lacquer or paint thinner. But after a quarter hour or more the strong taste was gone. The gum makers chewed and chewed until their jaws were sore and tired. The diversion of chewing helped keep their weakened legs and tired feet going downward. The climb down was almost as tricky as the climb up. Hidden limbs and logs beneath the slippery leaves on the steep trail caused a number of falls. After the six-hour hike, the group was glad to take the last climbing steps into the van.
Back at the farmhouse, Tink and Patsy, Yale botany students, came out lugging long bunches of limbs and twigs. They dumped them near a flimsy, wobbly camp table and went back upstairs to their second-floor bedrooms. Again the front screen door swung open as they lugged more branches between them and piled the wood on the first bunch. All the dried branches and leaves had been in the students’ bedrooms under their beds! This was the only way they knew to keep the wood dry.
“That’s the last of my batch,” Patsy said.
“Mine too. Get the measuring tape out. I’ve got the cutters. We’ll need the data sheet too,” Tink directed. “Measure the diameter of each main branch and twig. Measure the length of the central branch, each branchlet and twig. Count and measure the leaves too.”
Tink and Patsy busily pulled a measuring tape from its round capsule. As Patsy called out measurements, Tink recorded them on the chart securely fastened to his clipboard. After they measured lengths and diameters and counted the leaves, their information was plugged into a statistical formula that included a factor for error. The formula figured a total biomass for the tree they had cut down.
Your body has mass, or substance. Gravity pulls on that mass and gives you weight. If you squeeze your arm, you feel that mass. Iron shaped like your body would have a lot more mass than you do. Iron is denser than you are, which means that there is more mass of iron packed into a given volume than in your body. Tink and Patsy were trying to figure out the masses of different kinds of trees. Water-soaked wood weighs more than dry wood. Measuring wet wood would not give accurate weight. They would be weighing extra water as well as wood.
Next, Patsy and Tink put the measured tree pieces in the truck to take to the college for ashing, caloric measurement, and chemical analysis. The dry branches and leaves were burned in the special bomb calorimeter oven that measured heat. The heat measurement told them the amount of energy contained in the tree they had cut.
We defined energy as the ability to do work. A squirrel or chipmunk runs around getting food, burying nuts, and escaping predators. We can see that animals need energy to propel their activities. But a tree just stands in one place. What does it do? Why does it need energy? And how would it get its energy in the first place?
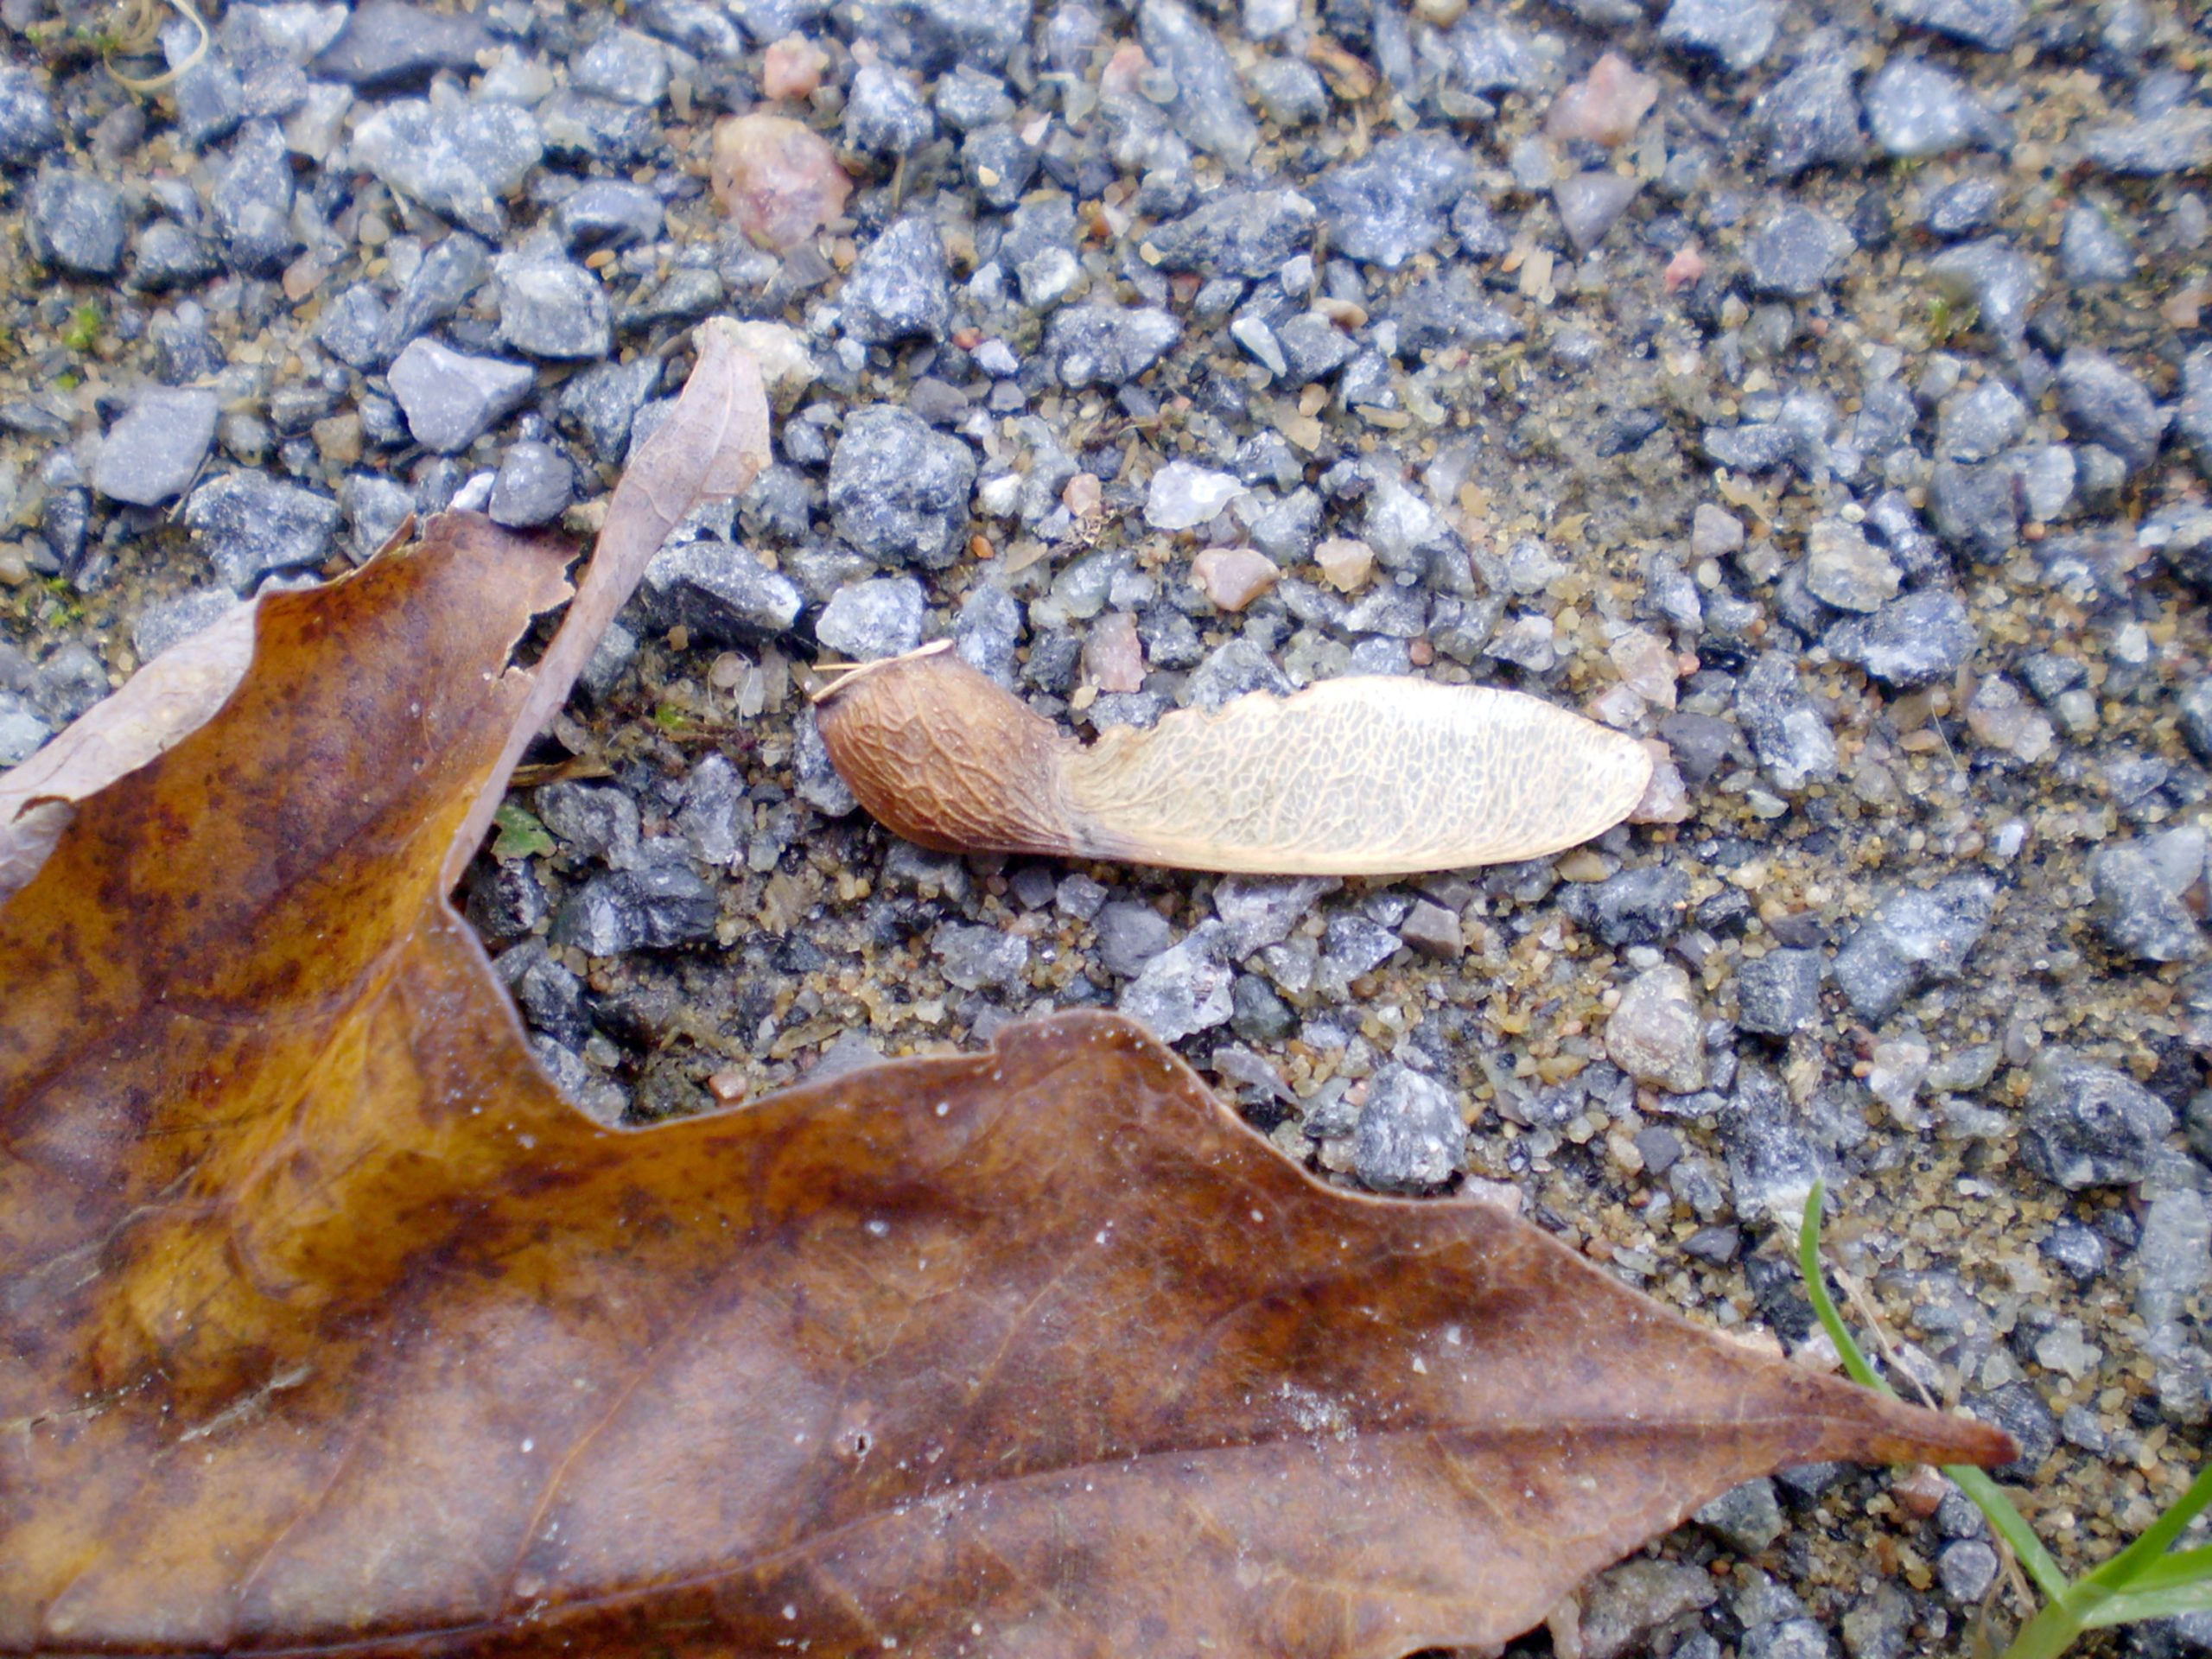
A tree does move, though it doesn’t run around. It grows taller and wider, moving up and out. Granite monoliths have been cracked and split by the continual push of a seedling striving to grow and survive. Roots push down. Stems push up. Flowers, fruits, and seeds form. Cuts heal. Energy is needed to change the soil nutrients absorbed by the plant roots into tree growth. “Blueprints” are put into the seed by its parents. Each tree grows according to the instructions in its seed. Different instructions are in each plant species. From the same materials very different-looking plants appear. The organism’s blueprints are in its genes.
The sun is the builder that provides the energy to change the soil chemicals into different arrangements. This process, occurring in green plants, is called photosynthesis. The light from the sun strikes chlorophyll, the green part of a plant, and by complicated chemical reactions a plant stores or keeps the energy of the sunlight bound up in its parts. When the plant needs to do something, like grow, the sun’s energy, stored away in stems, twigs, and tubers as food, is ready to help. Man’s body cannot duplicate the green plant’s process. Man, all other animals, and nongreen plants could not live without green plants.
Some animals, like cows, are primary consumers, or herbivores – they eat only plants. Other animals eat only meat and are called secondary consumers or carnivores. And omnivores, like humans, can eat both meat and plants. But somewhere along a carnivore’s food chain, an animal ate a plant and became a primary consumer for the secondary consumer that ate the plant eater.
The people in the world who eat only grains like rice, wheat, and barley are eating green plant storage bins for extra sugar. What a plant does not need for its own activities it stores in its leaves, stems, trunk, roots, fruits, and seeds. By measuring the mass of many trees and learning how much energy each tree released, the ecologists could estimate how much energy the forest produced and stored.
Stored energy made by plants and animals millions of years ago became today’s coal, natural gas and oil reserves. We burn them to get the energy to drive our cars and machinery and heat our homes. The reserves are finite. It is possible to use them all up. Eventually ecologists may be able to figure out how much energy forests, pastures, and farms produce. When mankind knows how much energy we can have to run the world indefinitely, we can pattern our activities to match our resources, keeping the endless chain of nature geared for survival on Planet Earth.
After the branches were taken to the lab, Tink jogged off to check measurements of root exudate–stuff that seeps out of the roots–in the study plots. Plants change the chemicals in the ground around them. They give certain chemicals to the soil as well as take chemicals from the soil. These chemical changes can be measured.
On nice days Pleasant View’s front porch was the scene of varied research activities. Dartmouth professor Bill R. and his crew of three busily picked leaves from branches and counted them. Picked in Watershed 2 (W2), a cut area, the leaves were used as a way of measuring new plant cover. No one dared interrupt Bill and his silent counters or they would have to start counting all over again.
Bob, a Yale graduate student, worked on a study of spring herbs that added more pieces of information to the Hubbard Brook ecosystem puzzle. He collected information about the herbs the same way Dr. Bormann studied the woody plants. Bob randomly picked sample plots to study from the quadrat or grid pattern he outlined over his section of forest.
He worked out a list of the species present. He estimated the biomass production of one species, Erythronium. First, he clipped off above-ground parts of the small plants. He estimated their biomass. Then he collected its bulbets, or corms, from the soil. He took soil samples from his plot and spread the soil on large trays. Carefully he separated the soil from the corm. The porch and dining room tables were his laboratory. Bob put each part of the plant – leaf, fruit, flower, stem, corm – in a small aluminum cup and weighted it on the balance scale that sat on the buffet. He subtracted the cup’s weight from each measurement. Eventually he added the weights together and knew about how much Erythronium biomass was present in each hectare of forest floor.
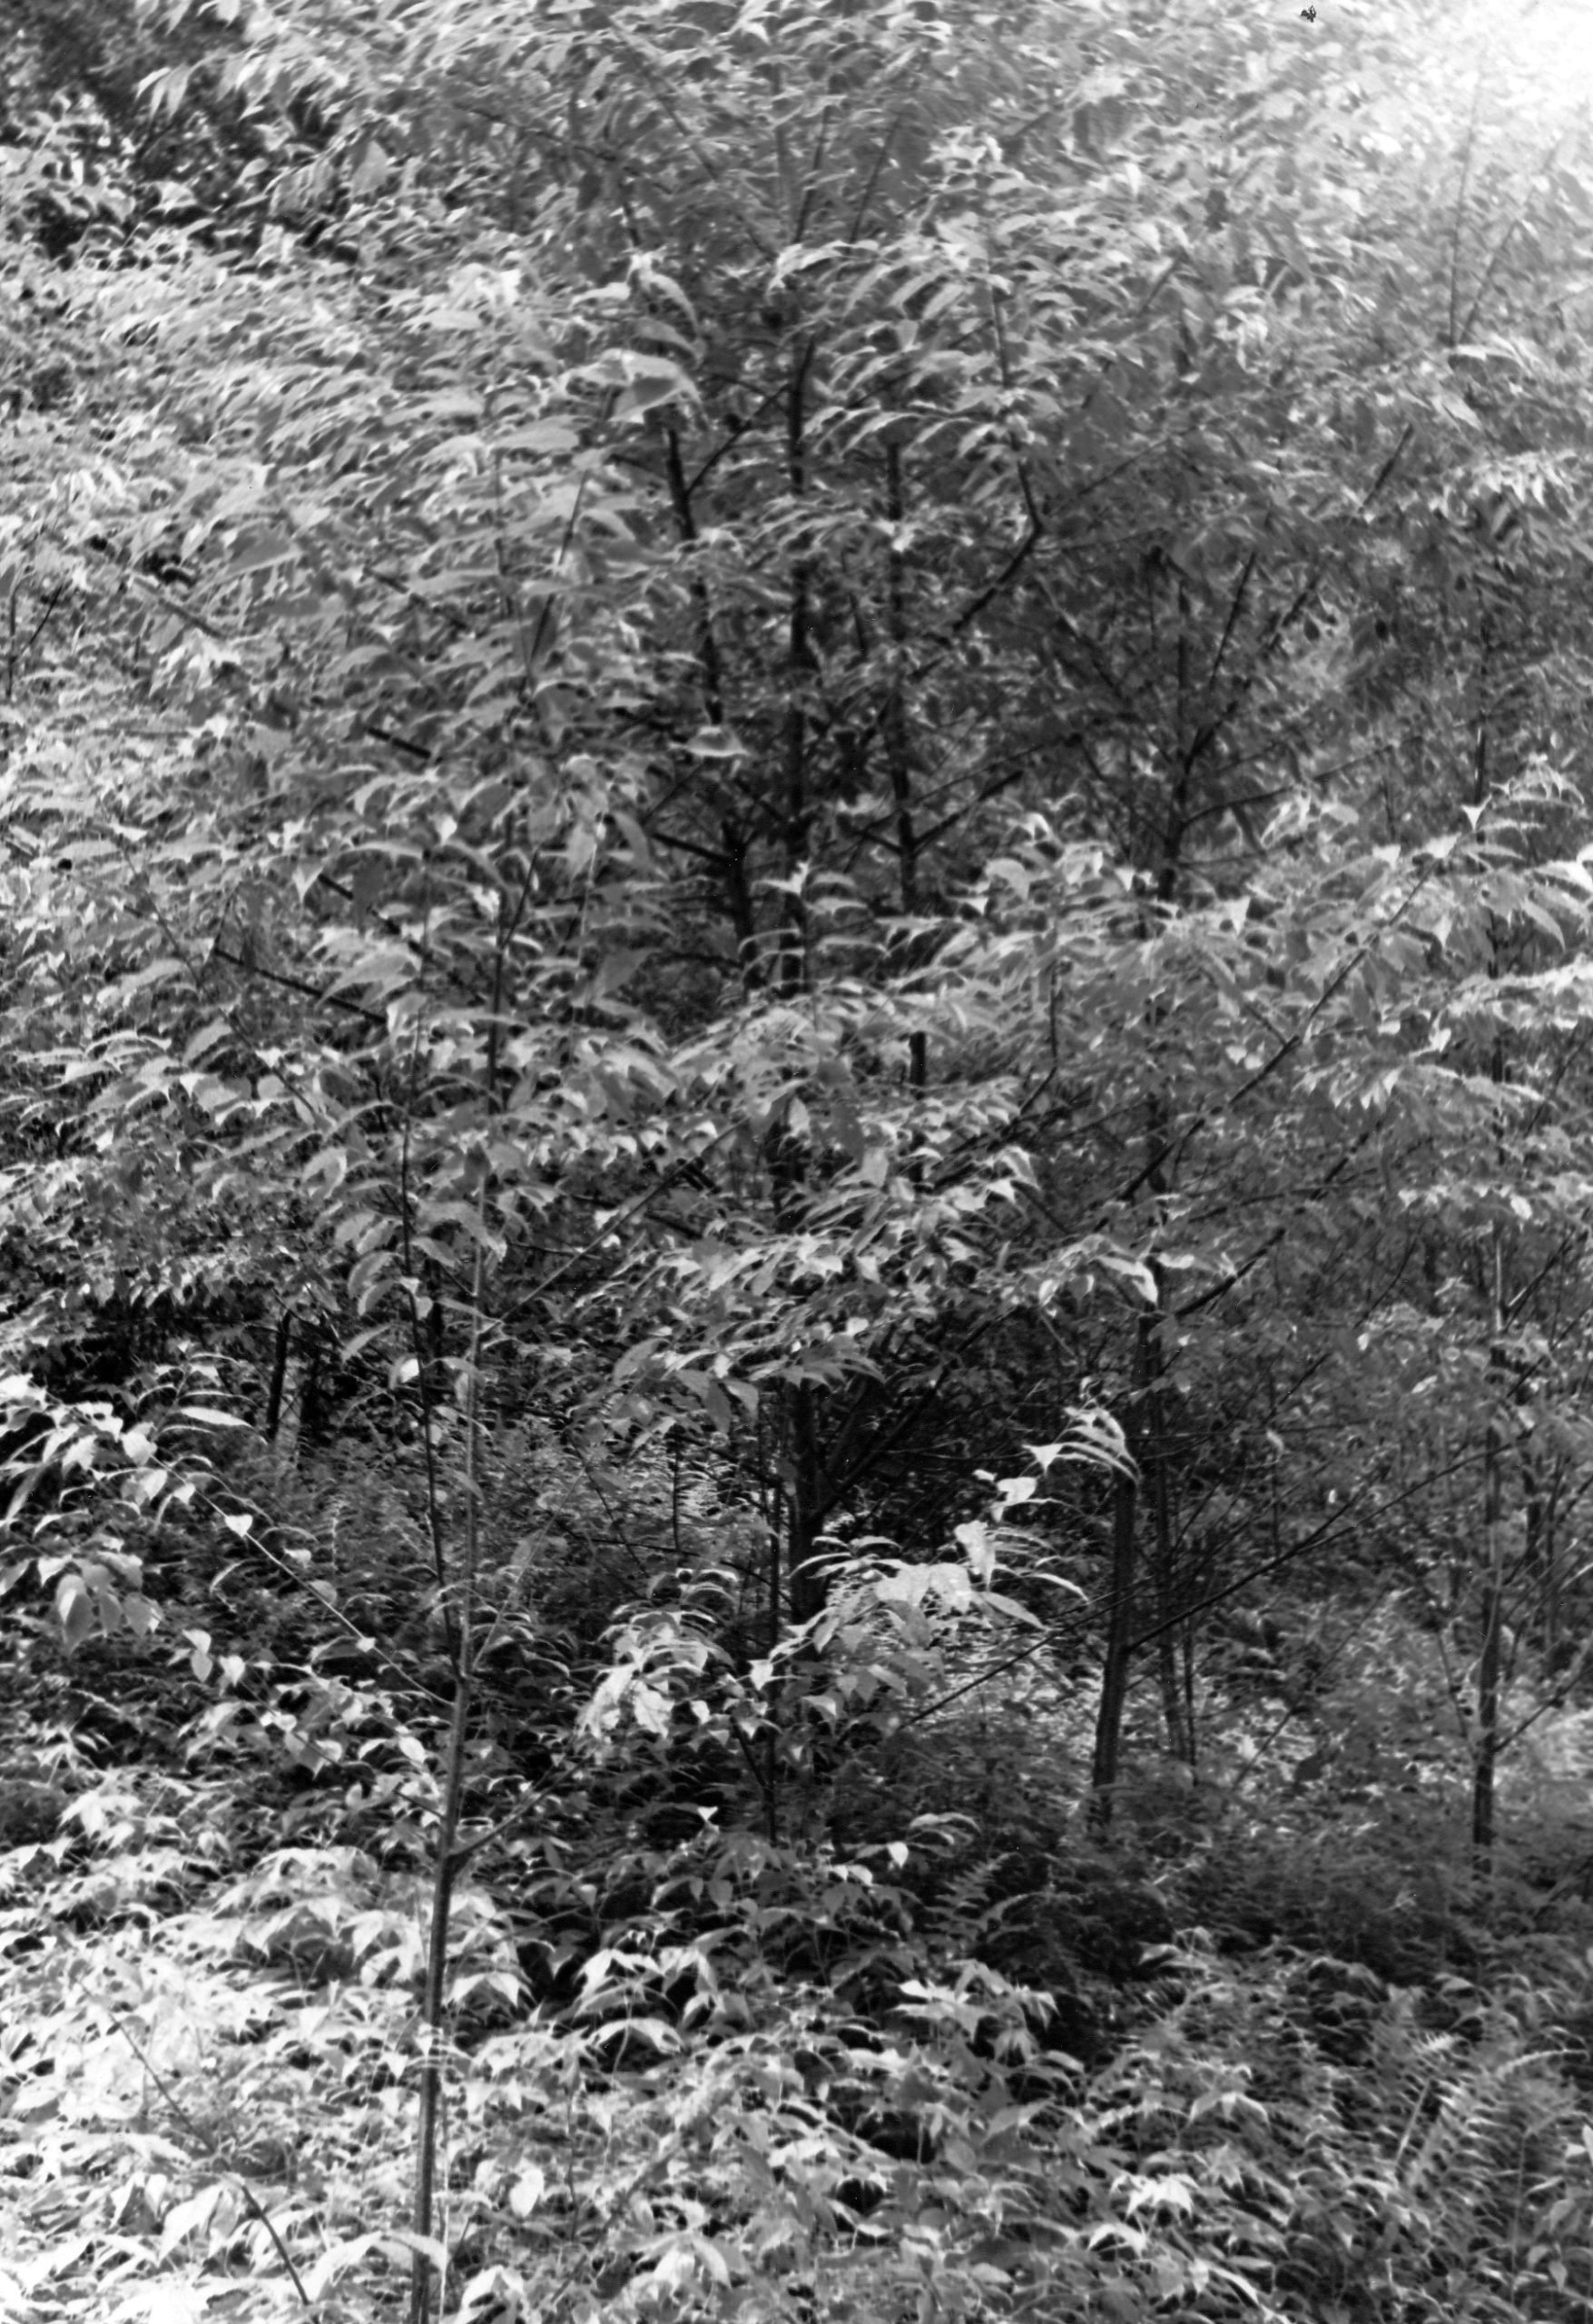
The Forest Service wanted to see what happened to water flow when more than one year passed without trees on a hillside. They clear-cut W2 and stump-sprayed to prevent root sprouting. After the Forest Service experiment, the pin cherry sprang up among the first sprouting plants in W2. This pioneer species in secondary succession interested graduate student Peter.
Like Bob, Peter took patches of forest soil from his sample plots and sorted them. He found a reservoir of pin cheery seeds that were just waiting to be exposed to the right environment of warm sun with no forest canopy. In those conditions the pin cherries sprouted quickly and grew rapidly. Pin cherries didn’t grow in a forest. So how could their seeds have been ready to sprout when the forest was cut?
They had formed in a warmer time when the tall forest trees were not present or were young and short. There had been no shading umbrella to keep out the pin cherry’s needed sun and warmth. The researchers watched. A past cycle repeated itself. A new reservoir of seeds was made as the pin cherry grew taller and denser. The pin cherry itself made the shade the hardwood tree seeds needed to grow. The pin cherry itself was the protective greenhouse for the hardwood plants that grew taller and forced the pin cherry out of the plot. But the pin cherry seeds would wait again for another clear-cut made either by man or by nature.
From Pleasant View’s front porch a visitor saw the cut grass lawn, a large, wide weedy field, white birch saplings edging the clearing, and mountains beyond. Visitors might spot a tree encircled by a four-foot-high wire fence – someone’s research. Or they might see a strange spongy, yellow foam collar around a telephone pole: The collar was an invention. It collected water that flowed down the pole the way water flowed down the stems and trunks of hardwood trees. When a researcher needed a measurement he often invented a device and technique. Ecologists must devise imaginative equipment.
The botanists knew that transpiring trees give off water and oxygen when they make food. So the trees themselves change the microclimate in the forest – the little climate right around each tree. Air and soil temperatures and moisture are different at different places in the forest. Researchers took the temperature of the air around the top of the canopy and under the tree canopy. They took the temperature of the soils in which the trees were rooted. Differences and changes in the forest microclimates showed in these measurements.
Another biomass measurement taken in the forest was a detritus measurement. Detritus is forest litter. All bits of formerly living things – bud scales, flowers, fruits, twigs, branches, trunks, logs, and so forth – were collected and measured.
Jim G., doing post-doctoral work at Hubbard Brook, estimated the amount of material falling to make detritus. He determined the rate of decomposition of the softer materials. As detritus decomposes, its chemicals become available for new plant production and continue to cycle in the ecosystem.
Again, plots were selected at random. Jim cleared his plots of all litter. Then he regularly gathered every new thing that fell in his cleared plot. He set out cloth bags in frames to catch falling leaves. After collecting the detritus, he weighed the litter and converted it to kilograms per hectare. Knowing the amount of detritus for one hectare, he multiplied by the number of hectares in his study plot. Next, he multiplied by the number of hectares in the forest and estimated the detritus standing crop, or biomass, in the study forest ecosystem. Of course he didn’t measure only one plot. He measured many plots and took an average of them to estimate the single factor in his multiplication problem.
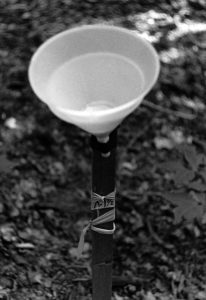
One of the stranger things visitors saw in the control forest was white plastic funnels. The funnels may have looked like those a cook uses in a kitchen, but their purpose was different. The funnels were taped to three-food-high sticks stuck in the ground. Jim G. collected the smaller litter, such as flower parts, bud scales, and frass with these funnels.
Frass is hard, tiny round pellets, something like half a BB. Frass is the excrement from the busy munching caterpillars that eat their way though leaf after leaf in the forest.
One of Jim’s experiments was to grow caterpillars in a cage. He measured and weighed the frass produced by the leaf-eating caterpillars. Later he collected and weighed the frass collected by his funnels in the field. Knowing the area of the funnel and the area of the study plot, he figured how many funnels would be needed to cover the whole plot. He knew the average amount of frass collected in a funnel. He multiplied the amount of frass in one funnel by the number of funnels needed to cover the whole plot. In the laboratory he counted the number of leaves given to a caterpillar and the amount of frass those leaved produced after the caterpillar had eaten them. Then he could measure frass and estimate how many leaves had been eaten in the forest. He expressed the leaf biomass as kilograms of leaf material per hectare.
The birders measured frass too, but for a different reason. They wanted to discover the number of caterpillars in the forest, the potential bird food. From the amount of frass, they estimated the number of caterpillars needed to make that same amount of frass. As the amount of frass changed, they knew the number of caterpillars changed.
Most of the plant studies listed the species present, the plant density, or number of individuals per hectare, and the standing crop, or biomass. Some studies discovered the amount of energy in a standing crop of plants. Biomass was then expressed as calories, or energy, per hectare.
The botanists determined the nutrient, or chemical, content of the plants and their dynamics – the ways the plants affected the environment and the ways the environment affected the plants. The amounts of materials and how they moved or cycled within the ecosystem (intrasystem cycling) were studied too. The plant ecologists learned how materials came into the ecosystem and moved out of the ecosystem. Streams were an important way of moving materials out of the ecosystem, so they measured the chemical content of the water and weighed the biomass of plants and animals floating out of the system.
The researchers studied in order to predict what might happen to the forest and the rivers when changes were made in the ecosystem and the larger ecosystem, Planet Earth. The Hubbard Brook research station and more like it around the world act like a thermometer and take environmental temperatures. Such an eco-study thermometer can tell us whether the Earth is sick or healthy.
