Chapter 22: Inferences in Pictures and Graphs
Make inferences in pictures
We can apply the same steps we learned about how to draw a conclusion when we are presented with a picture, cartoon, or photograph to make inferences about them. Using the photo below, see what inferences you can make using the steps we’ve already learned.
 For the photo to the right:
-
Make some observations. What do you see?
-
Mix these observations with your own logic and experience. What do you know about anything going on in this picture?
-
Draw a conclusion by explaining the story behind this picture. Remember to stick to strong inferences and avoid guesses. What is happening here?
Make inferences reading charts and graphs
Reading charts and graphs can be challenging, but rewarding! When you are reading a chart or graph, you’ll spend a little more time in the observation step of the process of making an inference. You want to be sure you fully understand the data in the graph before trying to make inferences about it. If you’re missing some information, your inferences might be incorrect.
The first step is to make some observations. Read the chart fully and carefully to be able to make a strong inference.
- Who? Read the title and subtitle and try to figure out who was surveyed to get this data or who this data is about.
- What? What is the general topic of the graph?
- When? What year or years are represented in this data? You might have to read the fine print, or you might be able to find years in the data as it is represented.
- Where? This means to find the source of the data. Who accumulated this data and put it into this chart? This is also a good time to assess the credibility of the source.
- Why? This means to fully understand every data point and why this chart or graph was created. Make sure you know exactly what this chart is trying to teach you. Try to pick a data point and explain it to make sure you understand.
Remember the more you know about a topic, the better inferences you will be able to make. Building your knowledge base can make you a better reader and a better student for this reason.
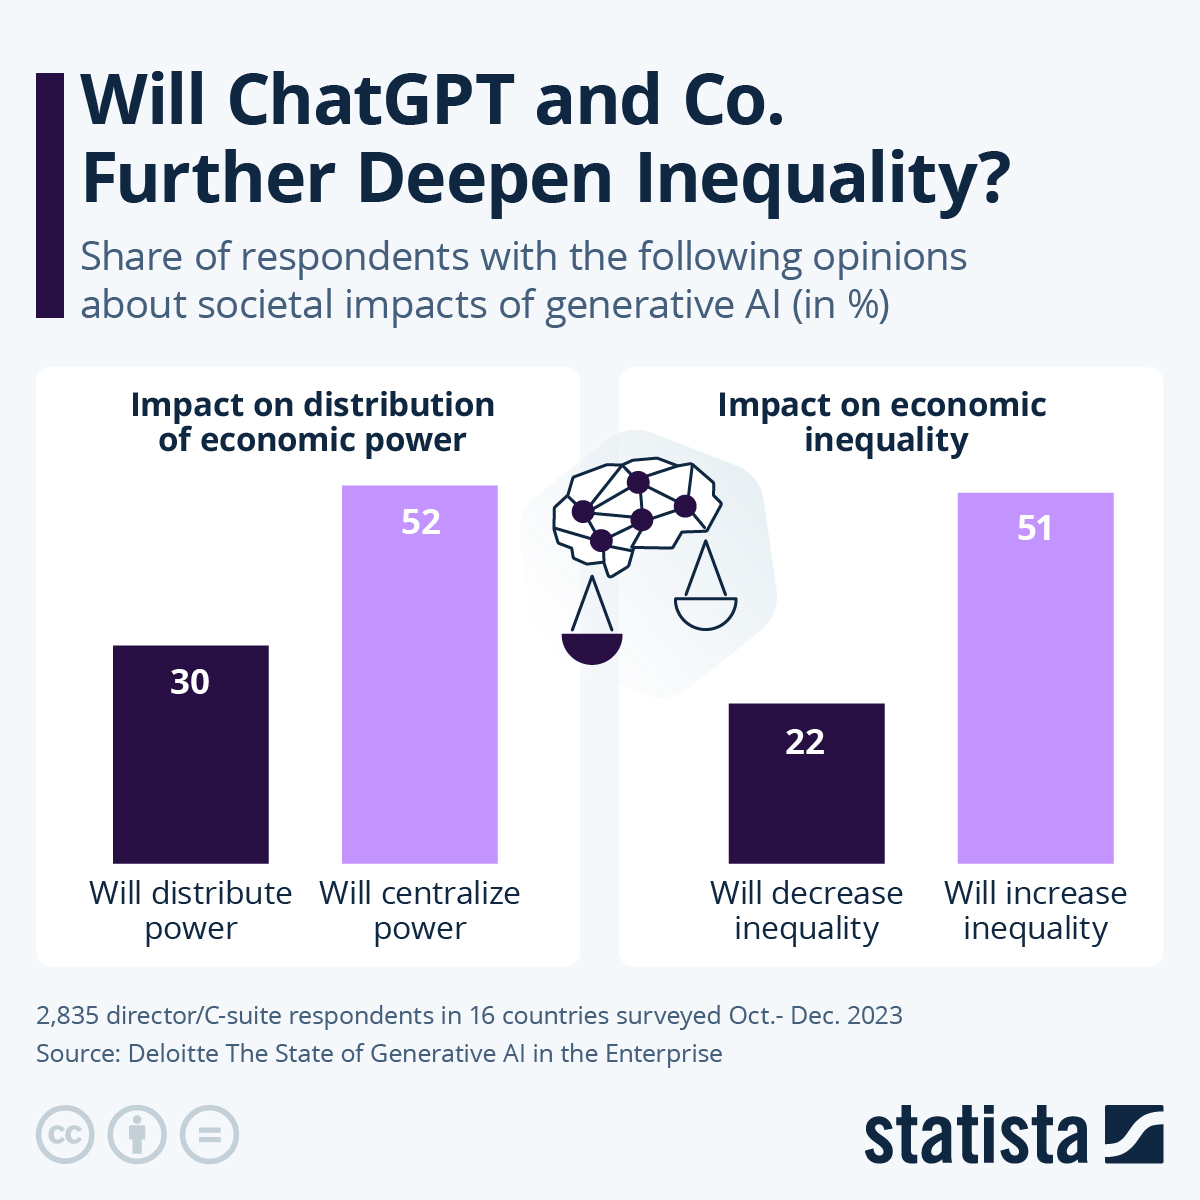
Pick the data point that is most interesting to you and try to explain the why behind it. What is the story behind those numbers? You will also have to make an inference to answer this question: What do these opinions suggest about how workers might use AI in corporations in the coming years?
Practice 22.1

-
-
Make an observation: What does this graph tell you about successful students?
-
Make another observation: what does this graph tell you about students who have a failing grade?
-
Make an inference: Do more students pass or fail the Reading Support class?
-
Make an inference: Why might more students fail the Reading Support class than pass successfully?
-
Make an inference: What could be done to increase the success rate in the course?
-
Attributions
Strengthening Reading and Comprehension © 2025 by Audrey Cross and Katherine Sorenson is licensed under Creative Commons Attribution-NonCommercial 4.0 International
Media Attributions
- U.S. veterinarian share K-9 care techniques with BDF Military Police © Magnus Manske
- ChatGPT Chart © Statista is licensed under a CC BY-NC (Attribution NonCommercial) license
(dā-tə / dă-tə), n.
Facts, statistics, or information collected for analysis or reference.
(jĕn-ər-ə-tĭv ā-ī), n.
Artificial intelligence capable of creating content, such as text, images, or music, based on input data.
