13 Chapter 13: Causal Inference in Epidemiology
Chapter 13: Causal Inference in Epidemiology
Objectives
After completing this module, you should be able to:
Conceptualize causation and causal inference in epidemiology.
Describe criteria used when considering causation in epidemiology.
Describe models of causation.
13.1 Introduction
The word “epidemiology” is derived from the Greek words epi (“upon”), demos (“people”), and logos (“study”). Epidemiology can thus be defined as the study of the distribution and determinants of health-related states or events in specified populations and the application of this study to control health problems. To apply epidemiology to control health problems, we need to establish valid associations between exposures and health outcomes. Once valid associations are established, we need to consider whether an association is causal. If we determine that an association is causal (i.e., the exposure is a cause of the outcome), we can make strong recommendations to control the exposure, which can have a significant effect on the public’s health and ensure that the people whom we serve have a lower burden of disease. On the other hand, spurious causal relationships can lead to a failure to control diseases or inappropriate treatment. Findings from epidemiological studies can be distorted in many ways, such as by methodological flaws, chance, biases, confounding, and misinterpretation of a non-causal association to be a causal association.
In epidemiology, causal inference refers to the process of determining whether an observed association is likely to be causal. In other words, it is the process of determining whether an exposure is a cause of an outcome or whether there are alternative explanations for the observed association. When alternative explanations exist, our understanding of diseases tends to change. For example, until the end of the 19th century, it was believed that miasma (toxic vapor or gases from cesspools or swamps or filth) was the cause of cholera, as well as other diseases (LaMorte, 2016). The work of John Snow, the father of epidemiology, in London during the 1854 Broad Street Cholera Outbreak disproved the theory that miasma or odor caused cholera and proposed a new hypothesis that it was water (or something in the water) that caused cholera (to be exact: the Vibrio cholera bacteria in the water). When evidence is adequately strong and no alternative explanations exist, then the notion of causality can be established and influence public health. A good example is the drastic change in US culture around smoking following the US Surgeon General’s report on smoking and health that was published in 1964, which linked smoking cigarettes with lung cancer, heart disease, and other health effects.
13.2 Criteria for a Causal Relationship
In epidemiology, there are many ways to measure the relationship between an exposure and an outcome. Measures of association, such as risk ratio and odds ratio, are comparisons of the disease (or exposure) between comparison groups. However, an association can be a causal association (where the exposure causes the outcome) or non-causal (where the exposure does not cause the outcome, but the measures of disease (or exposure) are simply different between comparison groups). One key principle behind this interpretation is “Correlation does not imply causation.” Just because an exposure is significantly associated with the outcome does not mean that the exposure causes the outcome.
13.2.1 Hill’s Criteria
In order to assess whether an association is causal (and is relevant for making recommendations to protect the public’s health), we can apply a number of criteria to assess causality. In the 1950s and 1960s, epidemiologist Dr. Austin Bradford Hill and colleagues studied the association between smoking and certain diseases such as lung cancer. Hill and colleagues found strong associations, and the studies were high quality, but there were many debates and arguments as to whether the observed associations were causal, i.e., whether smoking actually caused these diseases. Therefore, in 1965, Hill and colleagues proposed a set of nine criteria (Hill actually called them “viewpoints”) to be considered when trying to draw conclusions about causality (LaMorte, 2016; Rothman & Greenland, 2005). The criteria are not meant to be rigid, and not all of them have to be met in order to draw a conclusion about causality (Box 13.2.1.1).
Box 13.2.1.1 Hill’s Criteria and Nine Viewpoints for Causation
|
Is there evidence from true experiments in humans? (experimental evidence) Yes Class I evidence: Randomized controlled trial No Class II evidence: Cohort studies Class III evidence: Case-control studies Class IV evidence: Descriptive studies Were the major sources of bias avoided or, if present, measured? Were the sampling, assessment of exposure, assessment of outcome, and analysis processes at an acceptable level? Is the association strong? Is it stronger than the alternatives? (strength) Do other investigators consistently find the same result? (consistency) Is the temporal relationship in the proper direction? (temporality) Is there a gradient or dose-response relationship? (biological gradient) Is the association consistent with other knowledge? (coherence) Is the association biologically sensible? (plausibility) Does the exposure lead to a single effect, not multiple effects? (specificity) Is the relationship analogous to another well-accepted relationship? (analogy)
|
Criterion 1. Experimental Evidence
In general, evidence from experimental studies is stronger than evidence from observational (non-experimental) studies. In experiments, conditions can be controlled, thus eliminating the effect of external factors. Among observational studies, evidence from cohort studies is stronger than case-control and descriptive (cross-sectional) studies. Theoretically, cohort studies allow us to establish temporality: exposures are measured among “healthy” individuals, who are then followed until the outcome occurs. Ultimately, an intervention that addresses the cause of a disease is expected to have an effect on the outcome. Therefore, the strongest level of evidence of causation (Class 1 evidence) is evidence from randomized controlled trials.
Hill did not elaborate on the details of the most suitable experimental evidence. However, Hill seems to imply that the evidence from a prevention trial that assesses the effect of removing a harmful exposure on the occurrence of an outcome holds more weight than the results of laboratory experiments (Rothman & Greenland, 2005).
Criterion 2. Strength
Strength is defined by the size of an estimated risk within the constraints of probability levels, confidence intervals, or other measures of likelihood. High strength (e.g., very high or very low odds ratio or relative risk) suggests a high probability of causation. However, a strong but non-causal association between an exposure and an outcome is also not hard to find because of the possible effect of bias and confounding. On the other hand, a weak association does not rule out a causal connection.
The notions of strength of association and effect size are measures of a causal relationship. In public health communication and planning, a measure called “population attributable fraction” (PAF) is as important as the measure of association (e.g., odds ratio or relative risk). PAF refers to the percentage of cases of disease in a given population that could be prevented if the exposure was removed, assuming that the exposure causes the disease.
Criterion 3. Consistency
Consistency refers to the repeated observation of an association in different populations under different circumstances. If the findings of your study are similar to those in other studies, then there is consistency. The lack of consistency, however, does not rule out a causal association because some effects are produced by their causes only under specific circumstances.
Criterion 4. Temporality
Temporality refers to the necessity that the cause precedes the effect in time. Any observation of causation must involve the putative cause C preceding the disease D. However, if there is an observation that D precedes C, it does not mean that there is evidence against the hypothesis that C can cause D. The observation that D precedes C only shows that C could not have caused D in these instances. The observation provides no evidence for or against the hypothesis that C can cause D in instances where C precedes D. Only if it is found that it is absolutely impossible for C to precede D can we dispense with the causal hypothesis that C could cause D.
Criterion 5. Biological gradient
Biological gradient is also called the “dose-response relationship”. If the association between an exposure and an outcome is weaker at a low level of exposure and stronger at a high level of exposure, there is a biological gradient/dose-response relationship. However, associations that show a trend in disease frequency with increasing levels of exposure are not necessarily causal. Confounding can result in a monotonic relation between a non-causal risk factor and disease if the confounding factor itself demonstrates a biological gradient in its relationship with disease.
Criterion 6. Coherence
Coherence implies that a cause-and-effect interpretation for an association does not conflict with what is known in other fields of knowledge of the natural history and biology of the disease. If the association between an exposure and an outcome in an epidemiological study is not coherent with the knowledge in other fields, it does not imply that the epidemiologist is wrong, but simply that the knowledge from other fields can refute the epidemiologist’s hypothesis and that the epidemiology may be wrong (Rothman & Greenland, 2005).
Criterion 7. Plausibility
To establish causation, one must be able to describe the etiology (manner of causation) of the disease or condition or how the disease could plausibly have developed from the exposure. Plausibility, in Hill’s criteria, refers to the “biological plausibility of the hypothesis,” which can be explained by incorporating inputs from biological sciences, toxicology, pharmacology, and other sciences. Plausibility is important but not objective or absolute (Rothman & Greenland, 2005).
To help explain the steps in the association between exposure to a risk factor and disease occurrence/outcome (also known as a “pathway”), a useful tool is the directed acyclic graph (DAG), and students should incorporate DAGs into causal inference. Details of DAGs are covered in other modules.
Criterion 8. Specificity
“The criterion of specificity requires that a cause leads to a single effect, not multiple effects”. (Rothman & Greenland, 2005). This argument is the weakest of all of Hill’s criteria. An exposure, such as smoking, can have many effects (lung cancer, pancreatic cancer, bladder cancer, heart disease, emphysema, etc.).
Criterion 9. Analogy
The criterion of analogy posits that a causal association between an exposure and an outcome is likely to be consistent with other studies with similar risk factors and similar effects. However, analogies are made based on the imagination of scientists (Rothman & Greenland, 2005), and associations in other studies can also be due to chance, bias, and confounding.
13.2.2 Koch’s Postulates
In 1884, German physician and microbiologist Robert Koch and German microbiologist Friedrich Loeffler formulated four criteria to establish a causative relationship between a microbe and a disease. These criteria are known as Koch’s Postulates, and they were used to describe the etiology (causality) of cholera and tuberculosis (from Vibro cholerae and Mycobacterium tuberculosis, respectively).
Koch’s Postulates state that in order for bacteria to cause a disease:
The bacteria must be present in every case of the disease.
The bacteria must be isolated from the host with the disease and grown in pure culture.
The specific disease must be reproduced when a pure culture of the bacteria is inoculated into a healthy susceptible host.
The bacteria must be recoverable from the experimentally infected host.
Koch’s Postulates have a number of limitations. The criteria do not apply to non-communicable diseases. Diseases caused by viruses, such as AIDS, may not meet all of the criteria (for example, individuals may become asymptomatic carriers of HIV without developing AIDS). Bacterial diseases, such as tuberculosis, may also not meet the criteria (individuals can be infected with M. tuberculosis without ever developing the disease if they have strong immunity and other protective factors). This may be due to the differences in the nature of diseases and pathogens; thus, suspected causal relationships should not be dismissed if not all of the criteria are met (LaMorte, 2016).
13.3 Models of Causation
Essentially, two main concepts of causation are applied in epidemiology at present. The first one, a probabilistic model, is based on a statistical concept and states that a cause increases the probability of the disease. The second one, a deterministic model, states that if the causes of diseases are present in proper time windows (known as “windows of exposure”), diseases will follow. The probabilistic model can be used to predict the disease outcome, while the deterministic model may explain the probabilistic model by providing reasons for its empirical behavior.
It is still controversial as to which model is the best model for establishing causation. The best concept of causation is the concept that provides the most interesting and useful results and makes sense for the users of epidemiological findings. The following are different models of causation commonly discussed in epidemiology.
13.3.1 Model of Sufficient Component Causes
American epidemiologist Kenneth J. Rothman posits that the occurrence of a disease is complex and “no specific event, condition, or characteristic is sufficient by itself to produce disease” (Rothman, 2005). A cause is defined as an antecedent event, condition, or characteristic that was necessary for the occurrence of a disease at the moment it occurred, given that other conditions are fixed. Rothman called each of these conditions a “component cause” of disease. When all of the component causes for a disease are present, they will become the sufficient cause, “a set of minimal conditions and events that inevitably produce disease”. This model of causality is called the “model of sufficient-component cause”. In the sufficient-component cause model, there is also a sub-type of component cause called the “necessary cause”, defined as “a component cause that must be present in every sufficient cause of a given outcome” in order for the outcome to occur (LaMorte, 2016). For example, HIV exposure is necessary for AIDS to occur, and tuberculosis exposure is necessary for tuberculosis infection to occur.
Sufficient cause of a given disease may vary according to each individual and the specific context. For example, if we were to apply the sufficient-component cause model to tuberculosis, the scenario for the occurrence of a disease may vary by period, setting, and individual. For example, the sufficient causes for tuberculosis in the UK population vary by period, as shown in Figure 13.3.1.1.
Figure 13.3.1.1 Three sufficient causes of tuberculosis in three different scenarios in the UK population
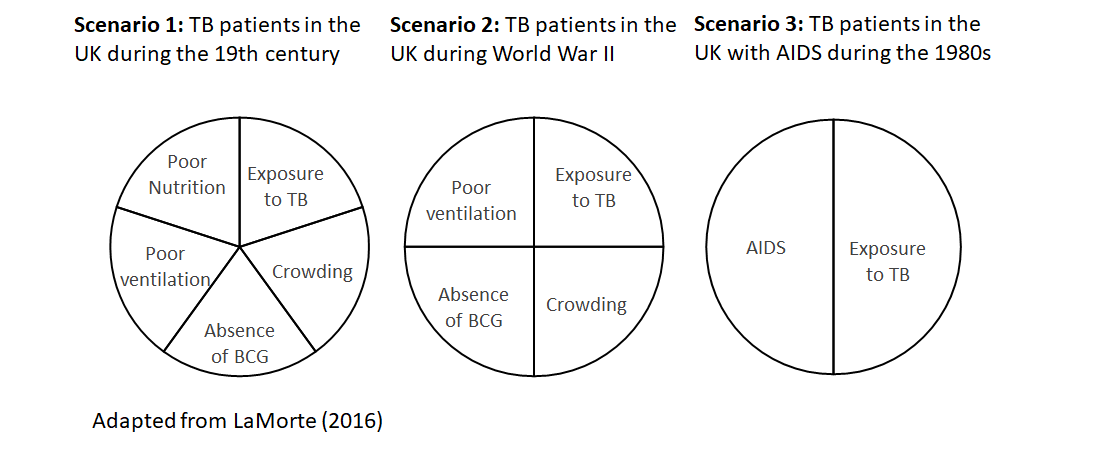
In Scenario 1, during the 19th century, people lived in crowded conditions with poor ventilation, there was no BCG vaccine to prevent tuberculosis, and nutrition was generally poor. People who were exposed to these conditions were immunocompromised and could develop TB when they were exposed to the M. tuberculosis bacterium.
In Scenario 2, during World War II, the UK had an effective food rationing system that ensured the entire population had adequate nutrition. However, people still lived in crowded conditions with poor ventilation and there was no BCG vaccine, so the UK population who were in these conditions and were exposed to M. tuberculosis were bound to develop tuberculosis.
In Scenario 3, during the beginning of the AIDS epidemic in the 1980s, people no longer lived in crowded conditions with poor ventilation. In addition, there was now a BCG vaccine and adequate food to ensure good nutrition, so people were not immunocompromised. People who were exposed to M. tuberculosis would not develop tuberculosis unless they were exposed to HIV and developed AIDS, which would compromise their immunity, and then tuberculosis would occur.
In Scenario 1, the sufficient cause of tuberculosis had five component causes. In Scenario 2, the sufficient cause of tuberculosis had four component causes. In Scenario 3, the sufficient cause of tuberculosis had only two component causes. HIV-infected persons who developed AIDS and were exposed to tuberculosis would also develop tuberculosis regardless of other factors. Exposure to tuberculosis was present in all scenarios, and tuberculosis would not occur unless there was a tuberculosis pathogen; thus, exposure to tuberculosis was a necessary cause of tuberculosis. However, exposure to tuberculosis alone would be insufficient to cause tuberculosis. The exposed individuals also had to experience other component causes in order to develop tuberculosis, and these components vary by scenario (crowding, absence of a BCG vaccine, poor ventilation, and poor nutrition in Scenario 1; crowding, absence of a BCG vaccine, and poor ventilation in Scenario 2; AIDS in Scenario 3).
The primary features of the sufficient-component cause model are (LaMorte, 2016):
1. “A cause is not a single component, but a minimal set of conditions”: Notice how there is always more than one component in each scenario.
2. “Each component in a sufficient cause is called a component cause”: Epidemiologists can use the term “causes” interchangeably with “component causes” in each scenario; a disease will not develop in a given sufficient cause model until all components are present.
3. “There may be a number of sufficient causes for a given disease.”
4. “A component cause that must be present in every sufficient cause of a given outcome [i.e., in every scenario] is referred to as a necessary cause”: An example is exposure to the tuberculosis pathogen in the development of tuberculosis.
5. “The completion of a sufficient cause is synonymous with the biological occurrence of the outcome.”
6. “The components of a sufficient cause do not need to act simultaneously; they can act at different times”: For example, in Scenario 3, exposure to tuberculosis may occur in a patient during childhood, but the patient remained healthy even after infection with HIV, and it was only after the patient had AIDS for some time that they also developed tuberculosis.
13.4 Conclusion
In epidemiology, causal inference refers to the process of determining whether an observed association is likely to be causal. Bradford Hill proposed that nine criteria can be considered when trying to draw conclusions about causality. These criteria should be considered flexible, and not all nine criteria have to be met in order to draw a conclusion about causality. Similarly, Koch’s Postulates have been used to establish a causative relationship between a microbe and disease. These criteria (postulates) also have several limitations; they may not apply to all infectious diseases and do not apply to non-communicable diseases. A commonly used model of causation is the “model of sufficient component causes”. In this model, a cause is defined as an antecedent event, condition, or characteristic that was necessary for the occurrence of disease at the moment it occurred, given that other conditions are fixed. Each of these conditions is called a “component cause” of disease. When all of the component causes for a disease are present, they will become the sufficient cause—“a set of minimal conditions and events that inevitably produce disease”. This model of causality is called the “sufficient-component cause model”.
References
LaMorte, W. W. (2016, February 19). Causal Inference. Boston University School of Public Health. http://sphweb.bumc.bu.edu/otlt/MPH-Modules/EP/EP713_Causality/
Rothman, K. J., & Greenland, S. (2005). Causation and Causal Inference in Epidemiology. American Journal of Public Health, 95(S1), S144–S150. https://doi.org/10.2105/AJPH.2004.059204
