3 Chapter 3: Overview of Epidemiological Study Designs and Measurement of Association between Health Outcomes and Their Determinants
Chapter 3: Overview of Epidemiological Study Designs and Measurement of Association between Health Outcomes and Their Determinants
Objectives
After completing this module, you should be able to:
1. Identify study designs in epidemiology.
2. Calculate and interpret cross-tabulations between an exposure and an outcome.
3. Calculate and interpret the odds ratio in a cross-sectional study.
4. Calculate and interpret the odds ratio in a case-control study.
5. Calculate and interpret the risk ratio in a cohort study and a randomized trial.
6. Calculate and interpret attributable risk (AR) and population attributable risk (PAR).
3.1 Introduction
Epidemiology is the study of the distribution of health outcomes and their determinants and the application of this knowledge to control and prevent health problems. In the previous chapter, we covered the measurement of the distribution of health outcomes and their determinants. In this chapter, we will cover how to apply this knowledge regarding the distribution to control and prevent health problems.
To apply the knowledge regarding the distribution of diseases, epidemiologists investigate either the distribution of the outcome between those with and without the exposure (i.e., the determinants) or the distribution of the exposure between those with and without the outcome. There are different ways to do this, which are called “study designs”.
3.2 Epidemiological Study Designs and Relative Measures of Association
3.2.1 Ecological Studies
Ecological studies are descriptions of the association (correlation) between an outcome and an exposure using aggregated data at the group (population) level. When an epidemiologist conducts an ecological study, the epidemiologist compares the level of an exposure and outcome between different populations. The purpose of an ecological study is to provide an initial hypothesis that may warrant further investigation. For example, a comparison of the level of fear of COVID-19 and the level of face mask use in various countries suggests that the fear of COVID-19 may be associated with face mask use. This finding can be used as the rationale for further investigation (Figure 3.2.1.1).
Figure 3.2.1.1 Comparison of national populations by face mask use and proportion of population indicating fear of coronavirus infection
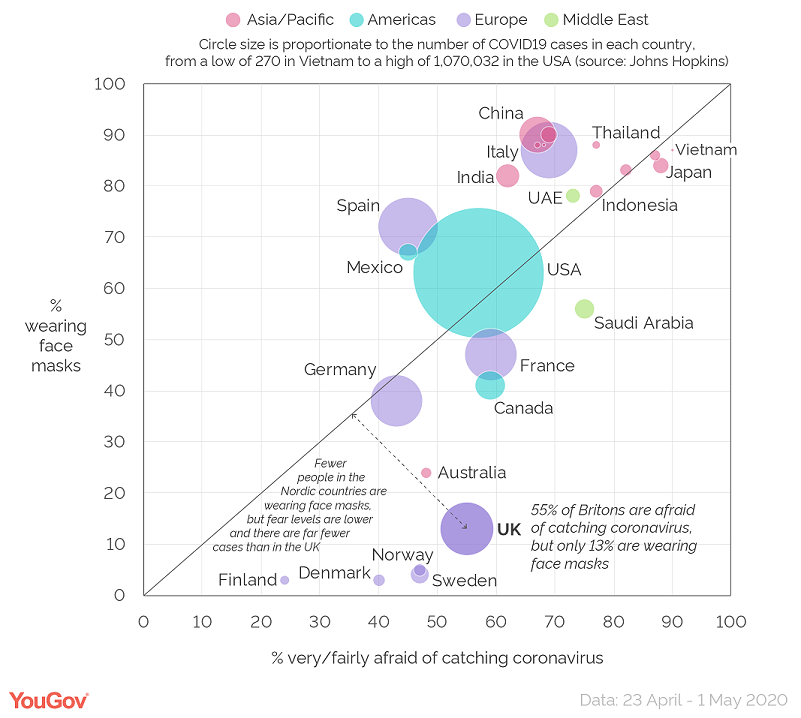
Source: Smith, 2020
As the association in ecological studies are based on correlations, the strength of the association (correlation) is commonly measured by the correlation coefficient (represented by the letter r, or the Greek letter rho). Correlation coefficient values range between -1 and 1. The coefficient of -1 indicates a perfect negative correlation, where a higher value of the exposure perfectly correlates with a lower value of the outcome. A coefficient of 0 indicates absolutely no correlation. The coefficient of 1 indicates a perfect positive correlation, where a higher value of the exposure perfectly correlates with a higher value of the outcome. The correlation coefficient was not stated in the example above, but examples in Chapter 4 do have examples of ecological studies with calculated correlation coefficients.
3.2.2 Cross-sectional Studies, Odds, and Odds Ratios
A cross-sectional study is an observational study that entails the collection and analysis of data from members of a defined population at a single time point. The distribution of outcome and exposure in this study can be considered as prevalence. Thus, the study is also known as a “prevalence study” or a “survey”.
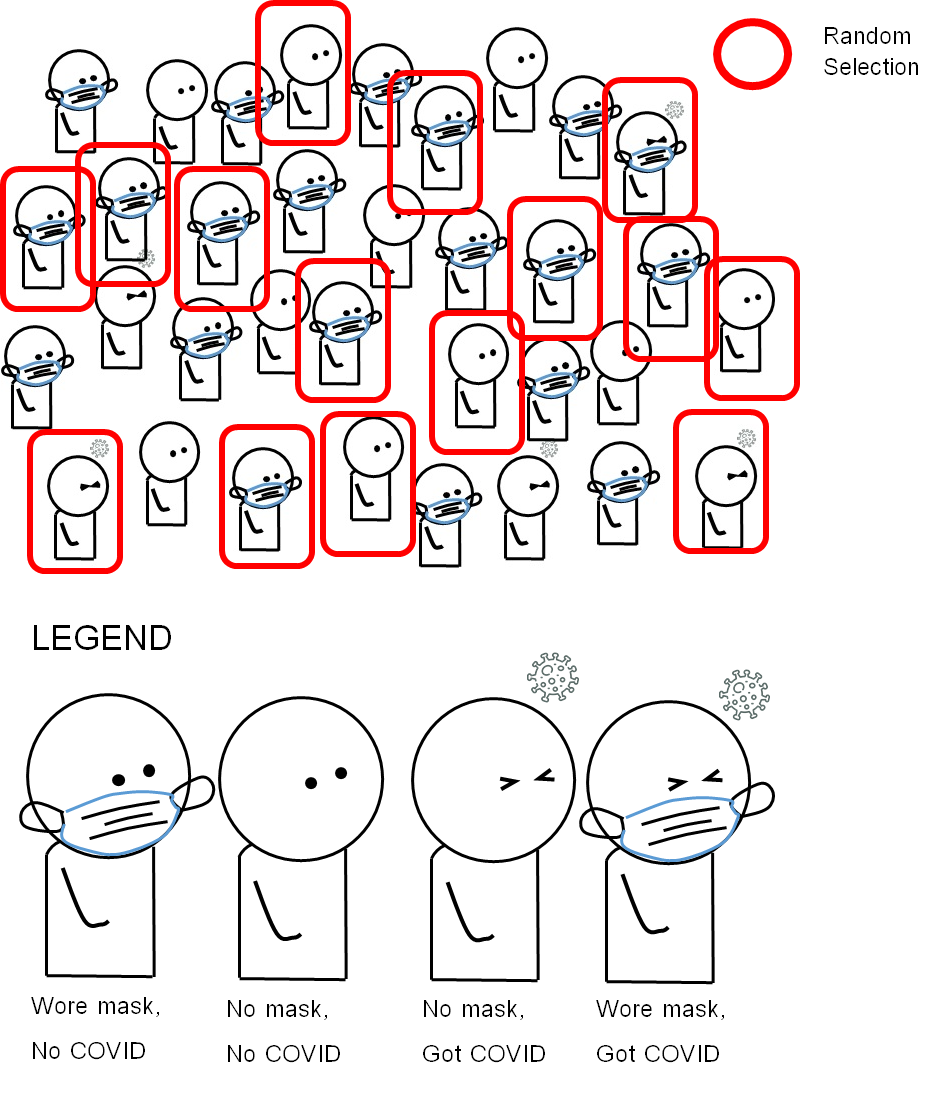
Findings from a cross-sectional study can help an epidemiologist look at the individual-level association between an exposure and an outcome. For example, there is a new emerging infectious respiratory disease called COVID-26 happening in a small city called Covidville, with a population of 2,500 persons. There is a hypothesis that not using face masks in public can elevate the probability of COVID-26 infection. An epidemiologist wished to investigate the association between the non-use of face masks (“going mask-free”) and COVID-26 infection in Covidville. The epidemiologist sampled 1000 persons, collected data from each person on face mask use, and tested them for COVID-26 infection. The design of the study based on our given example of COVID-26 in Covidville is summarized in Figure 3.2.2.1.
Figure 3.2.2.1 Design of a cross-sectional study on the association between face mask use (or lack thereof) and a hypothetical emerging disease called “COVID-26”
The hypothetical data from the case-control study is as follows:
The findings are found in Table 3.2.2.1.
Table 3.2.2.1 Distribution of face mask use and COVID-26 infection status among 1,000 city residents
|
|
COVID-26 — Infected (Outcome) |
COVID-26 — Not infected (No outcome) |
Total |
|
“Going mask-free” (Exposed) |
50 (cell a) |
250 (cell b) |
300 |
|
Used face mask (Non-Exposed) |
10 (cell c) |
690 (cell d) |
700 |
|
Total |
60 |
940 |
1000 |
The table above displays two categories of outcome (outcome vs. no outcome) by two categories of exposure (exposed vs. non-exposed). Once an epidemiologist has this data, they can then measure the association between the exposure and the outcome.
One common way to measure the association is to compare the odds of an outcome between the exposed and the non-exposed groups. Odds refer to the ratio of the probability that something occurs versus the probability that the event does not occur. In this mentioned comparison, the odds of an outcome refer to the number of persons in a group with the outcome divided by the number of persons in the same group with no outcome. Thus, we have:
The odds of the outcome among the exposed
= exposed with outcome / exposed without outcome
= (cell a) / (cell b) = a/b
= 50/250 = 1:5 or 0.200
The odds of the outcome among the non-exposed
= non-exposed with outcome / non-exposed without outcome
= (cell c) / (cell d) = c/d
= 10/690 = 1:69 or 0.014
Once we have the odds of the outcome between each comparison group, we can divide the odds of the outcome among the exposed by the odds of the outcome among the non-exposed. Such division also creates a ratio of two odds, known as the odds ratio (OR). If the odds of the outcome among the exposed are equal to the odds of the outcome among the non-exposed, then the OR will equal 1. The interpretation is that there is no association between the exposure and the outcome. If the odds of the outcome among the exposed are higher than the odds of the outcome among the non-exposed, then the OR will be higher than 1. The interpretation is that there is a positive association between the exposure and the outcome. If the odds of the outcome among the exposed are lower than the odds of the outcome among the non-exposed, then the OR will be less than 1 (i.e., between 0 and 1). The interpretation is that there is a negative association between the exposure and the outcome, i.e., there is a potential protective effect against the outcome. To interpret an OR in a cross-sectional study with a positive association, we use phrases such as:
“The odds of the [OUTCOME] among the [EXPOSED] were … times [(or … percent)] higher than the odds among the [NON-EXPOSED].”
The terms in the square brackets can be replaced with the particular exposure and outcome of interest.
In our example, the OR can be calculated as follows:
OR = The odds of the outcome among the exposed / The odds of the outcome among the non-exposed
= (a/b) / (c/d)
Remark: The formula above can also be rewritten as OR = ad/bc = (50*690)/(250*10) = 13.80
From the obtained OR, we can make the following interpretation:
“The odds of COVID-26 infection among city residents who were ‘going mask-free’ were 13.8 times higher than the odds among those who used face masks.”
The word “percent” is generally used as a supplementary description when the OR is between 1 and 2 to ease communication. A bracket at the end of the sentence may also help to clarify the description. For example, if the OR in the association was 1.47 instead of 13.80, the interpretation could be written as follows:
“The odds of COVID-26 infection among city residents who were ‘going mask-free’ were 47% higher than the odds among those who used face masks (OR = 1.47).”
To interpret an OR in a cross-sectional study with a negative association (i.e., potential protective effect), we use phrases such as:
“The odds of the [OUTCOME] among the [EXPOSED] were …% lower than the odds among the [NON-EXPOSED].”
“Percentage lower” is calculated using the formula:
Percentage = (1-OR)*100%
For example, for an OR of 0.75, the odds of the outcome among the exposed compared to the non-exposed could be considered (1-0.75)*100 = (0.25)*100 = 25% lower among the exposed compared to the non-exposed.
In other words, if the OR in the example was 0.75 instead of 13.80, the interpretation could be written as follows:
“The odds of COVID-26 infection among city residents who were ‘going mask-free’ were 25% lower than the odds among those who used face masks (OR = 0.75)”
Please note that mathematically the OR of 13.80 can also be interpreted as the odds of having the exposure be 13.80 times higher among those with the outcome compared to those with no outcome. The comparison of the odds of the outcome in this sub-section merely presents a way to interpret the association among novice epidemiologists and enables the findings to be more easily communicated to a general audience.
3.2.3 Case-Control Studies
A case-control study is an observational study that compares the exposure between members of a population with the outcome and members of a population with no outcome. Case-control studies are commonly conducted in investigations of rare outcomes, as they allow for the assessment of the association between exposure and outcome to be conducted with greater efficiency. In case-control studies, the number of control participants is generally equal to that of the cases. In addition, the controls should come from the same base population that gave rise to the cases.
For example, the fictitious COVID-26 newly emerges in a fictional nation of Covidia (population: 20 million). There are only 200 cases in the entire country. We hypothesize that face mask use is protective against COVID-26 infection. However, if we are to study the association between face mask use and the transmission of COVID-26 with a cross-sectional study design, we will need to select all or nearly all 20 million citizens of Covidia, a very expensive endeavor.
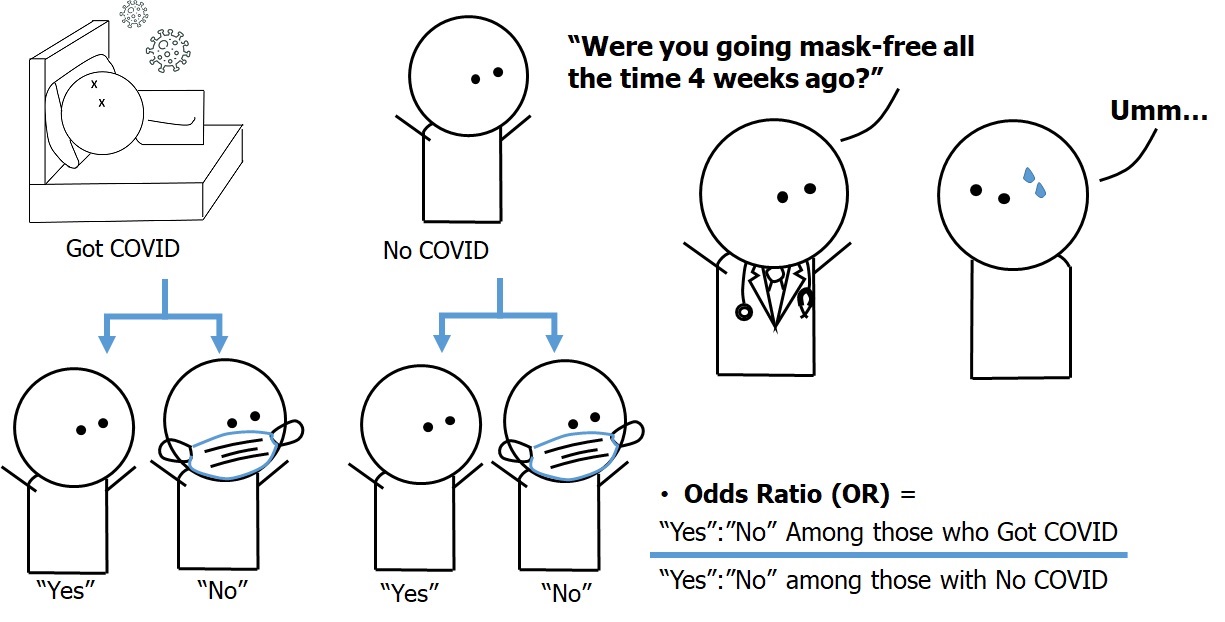
A more efficient way to test our hypothesis would be to collect data from all 200 COVID-26 patients (cases, or those with outcome) regarding their past face mask use behaviors, then sample 200 Covidia citizens without COVID-26 (controls, or non-cases, or a comparison group, or those with no outcome) from the same base population, and also collect data regarding their past face mask use behaviors. We can then compare face mask use between the cases and the controls and assess the extent to which face mask use is associated with COVID-26 infection. The design of a case-control study based on our given example of COVID-26 in Covidia is summarized in Figure 3.2.3.1.
Figure 3.2.3.1 Design of the case-control study on the association between face mask use (or lack thereof) and a hypothetical emerging disease called “COVID-26”
The hypothetical data from the case-control study is as follows:
Table 3.2.3.1 Face mask use among COVID-26 cases and non-cases in Covidia
|
|
Infected with COVID-26 (Cases, or outcome) (n = 200) |
Not infected with COVID-26 (Controls, or no outcome) (n = 200) |
|
“Going mask-free” (Exposed) |
150 (a) |
20 (b) |
|
Used face mask (non-exposed) |
50 (c) |
180 (d) |
|
Total |
200 |
200 |
The odds ratio in this study can be calculated as follows:
ODDS of EXPOSURE = (number EXPOSED / number NON-EXPOSED)
Odds Ratio (OR) = (Odds of EXPOSURE among CASES) / (ODDS of EXPOSURE among CONTROLS)
OR = (a/c) / (b/d)
Remark: OR can also be re-written as ad/bc in the same way as in a cross-sectional study.
In case-control studies, we compare the ODDS of EXPOSURE between the CASES and the CONTROLS. Thus, the interpretation needs to follow suit as follows:
“The odds of ‘going mask-free’ among cases of COVID-26 were 27 times higher than among the non-cases (controls) from the same population in Covidia.”
The interpretation of weaker positive associations as percentages and the interpretation of negative (protective) associations as percentages of lower odds follow the same wording pattern as in the example from the cross-sectional study.
Cross-sectional studies and case-control studies are useful for the generation of hypotheses on the association between exposure and outcome. However, in both of these study designs, we simply do not know with certainty whether the exposure actually occurs before the outcome. Cross-sectional and case-control studies generally produce evidence that is inferior to cohort studies and randomized trials, which select participants without the outcome and measure the exposure or allocate an exposure (i.e., intervention) among the study participants (known as the baseline visit), follow the participants over time, then measure the outcome at a subsequent visit (the follow-up visit). This type of study design allows for the direct measurement of incidence or risk.
3.2.4 Cohort Studies and Risk Ratios
The term “cohort” refers to a group of persons who share a common characteristic. A cohort study is an observational study that compares the incidence of the outcome among cohort members who have the exposure to the incidence of the outcome among cohort members who do not have the exposure. Incidence is also known as risk, and similar to the calculation of odds ratios in cross-sectional and case-control studies, a ratio between the incidence of disease among the exposed and the incidence of disease among the non-exposed can be calculated as a measurement known as the risk ratio (RR).
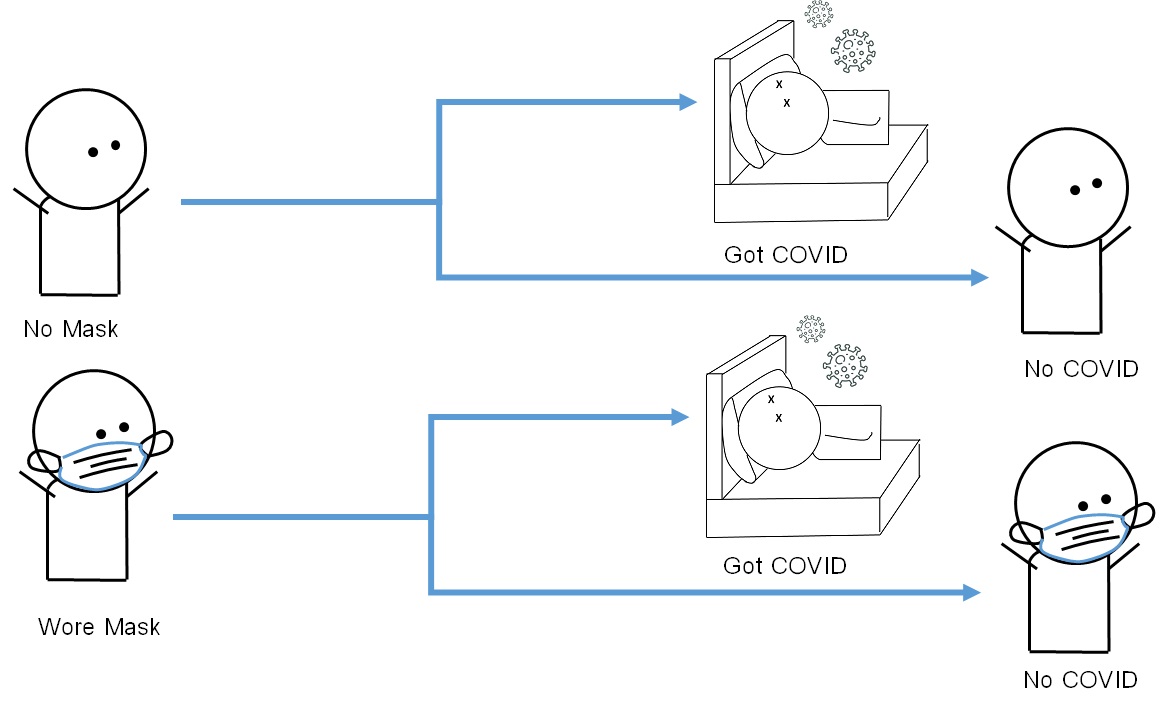
Conducting a cohort study generally entails identifying susceptible individuals (those without the outcome of interest but are susceptible to developing the outcome) from a defined population. Investigators first measure the exposure(s) among the study participants (known as cohort members) in what is known as the baseline visit. After the baseline visit, the investigator generally allows a period of time to pass before re-contacting cohort members (known as the follow-up period). Members of the investigation team will then ask for permission to measure the outcome in what is known as the follow-up visit. Since cohort members are free from the outcome at the baseline visit and develop the outcome during the follow-up period, the occurrence of the outcome at the follow-up visit can be considered as incidence (risk) and interpreted accordingly. The design of a cohort study on the risk of COVID-26 among residents of Covidville who went mask-free and those who wore masks is summarized in Figure 3.2.4.1
Figure 3.2.4.1 Design of the cohort for the study on the association between face mask use (or lack thereof) and the fictional disease ‘COVID-26’
 The hypothetical data from the cohort study is as follows:
Table 3.2.4.1 Risk of COVID-26 among residents of Covidville who went mask-free and those who used face masks
|
|
Infected (Outcome) |
Not infected (No Outcome) |
Total |
|
Went mask-free (Exposed) (n = 600) |
500 (a) |
100 (b) |
600 (a+b) |
|
Used face mask (non-exposed) (n = 1400) |
200 (c) |
1200 (d) |
1400 (c+d) |
The risk ratio (RR) in this study can be calculated as follows:
Risk of outcome = (number with outcome / total number in the category)
Risk ratio (RR) = (risk of outcome among exposed) / (risk of outcome among non-exposed)
RR = [a/(a+c)] / [c/(c+d)] = (500/600) / (200/1400) = 5.83
Interpretation: Those who went mask-free had a 5.83 times higher risk (incidence) of COVID-26 infection than those who used face masks.
3.2.5 Randomized Trials
An experimental study is a study in which the investigator allocates the exposure to some study participants (i.e., the exposed or intervention group), while other participants either receive nothing or undergo an alternative procedure (i.e., the non-exposed or control group). A randomized trial is a type of experimental study in which the exposure is randomly allocated to the participants. This process is known as randomization. The investigator then delivers the intervention to the intervention group and delivers the alternative procedure, or simply observes the control group, for a period of time known as the follow-up period and measures the incidence of the outcome during the follow-up visit. The investigator then compares the occurrence of the outcome between the intervention group and the control group in a similar manner to that done in a cohort study.
If randomization has been properly conducted, the characteristics of comparison groups will be similar to one another, and the differences between the two groups are thus only attributed to the intervention. Since the risk or incidence of the outcome in the intervention group is generally lower than that in the control group, the relative difference is known as the efficacy of the intervention. Efficacy is generally expressed as a percentage based on the following formula:
Efficacy (percent) = (1-RR) * 100%
The media most commonly reports findings from randomized clinical trials, in which investigators test new drugs or treatments in a controlled setting at medical schools or advanced care centers. However, randomized trials may also include preventive procedures, such as the use of face masks, for the prevention of new diseases (Figure 3.2.5.1).
Figure 3.2.5.1 Design of a randomized trial on the use of face masks (intervention group) vs. non-use (control group) and incidence of the fictional disease “COVID-26”
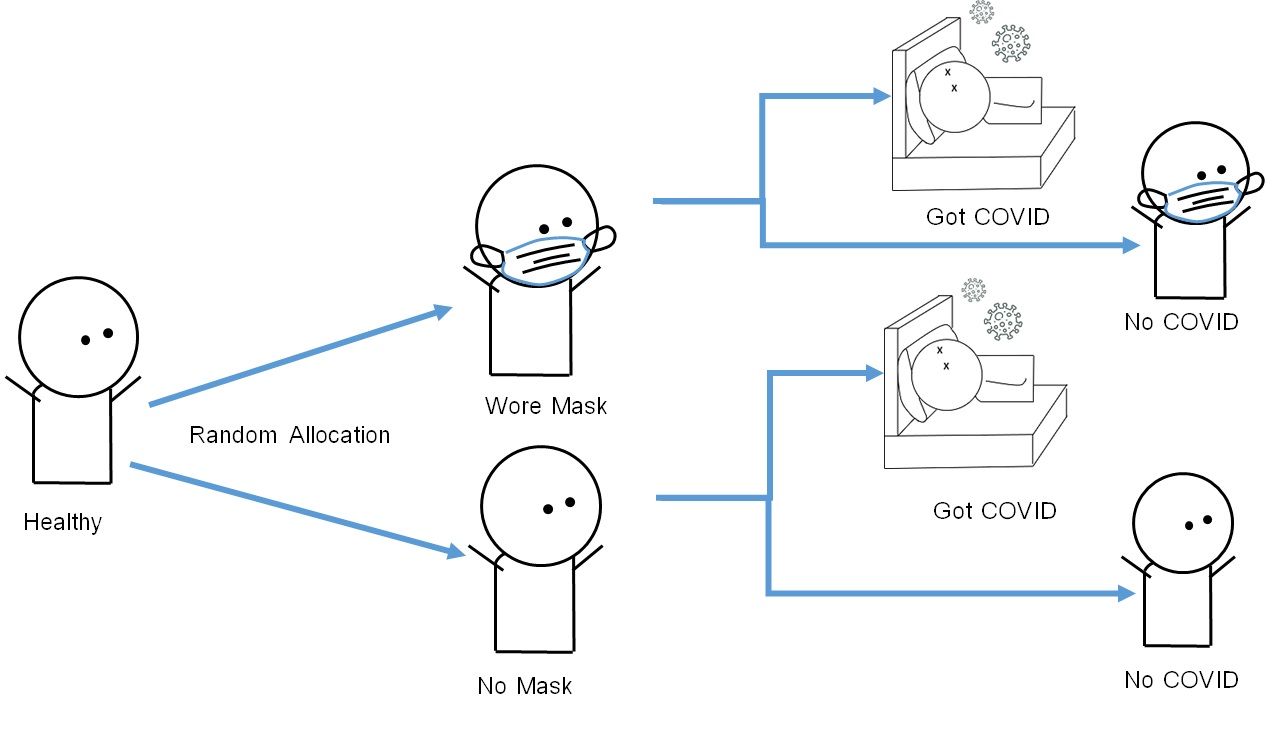
The calculation of risk ratios (RRs) in randomized trials is similar to that in cohort studies. For example, in a randomized trial on the effect of face masks in preventing COVID-26 infection (sample size = 600 participants), 300 participants were allocated to the mask-wearing campaign (intervention group), whereas 300 participants were allocated to the non-intervention, mask-free group (control group). The incidence of COVID-26 at the follow-up visit was as follows:
Table 3.2.5.1 Risk of COVID-26 among participants in a randomized trial on the effect of face masks in preventing COVID-26 infection (n = 600)
|
|
Infected (OUTCOME) |
Not infected (NO OUTCOME) |
Total |
|
Used face masks (intervention or exposed) (n = 300) |
50 (a) |
250 (b) |
300 (a+b) |
|
Went mask-free (control or non-exposed) (n = 300) |
200 (c) |
100 (d) |
300 (c+d) |
The risk ratio (RR) in this study can be calculated in a similar manner as in a cohort study:
Risk Ratio (RR) = (RISK of OUTCOME among INTERVENTION) / (RISK of OUTCOME among CONTROL)
RR = [a/(a+b)] / [c/(c+d)] = [50/300] / [200/300] = 0.25
Efficacy = (1-RR) * 100% = (1-0.25) * 100 = 0.75 * 100 = 75%
Interpretation: The risk of COVID-26 among participants in the face mask (intervention) group was 75% lower than that in the mask-free (control) group.
3.3 Absolute Measures of Association
Once epidemiological investigations are made and repeated in various populations to the extent that the scientific community is certain that the association is valid, the next step will be to communicate the findings to stakeholders in public health and public policy as well as the general public, with the hope that such communications can influence policy and practice. Examples of these efforts include tobacco control in the 1960s (after there was evidence that smoking was associated with lung cancer and chronic diseases), seat belt laws in the 1980s and 1990s (after there was evidence that seat belt use prevented automobile accident deaths), and encouraging exclusive breastfeeding (after there was evidence that formula did not offer the same benefits as breast milk).
Communicating with odds ratios and risk ratios may not always be suitable for stakeholders and the general public. Stakeholders may wish to focus on the number (or percentage) of disease cases that can be prevented by changes in policy and practice (Heller, 2003). These numbers (or percentages) must be clear and ready to use. Therefore, the epidemiologist needs to turn the relative measures into measures of impact based on the assumption that the exposure causes the outcome. It is important to state this assumption because epidemiological evidence never allows for absolute certainty that the exposure is causally associated with the outcome, but the measure of impact is based on the assumption that the exposure certainly causes the outcome.
There are two commonly used measures of impact: attributable risk (AR) and population attributable risk (PAR).
3.3.1 Attributable Risk (AR)
Attributable risk (AR), also known as risk difference (RD), refers to the difference in the incidence between the exposed group and the non-exposed group. Attributable risk shows the incidence of outcome in the exposed group that can be prevented if the exposure is removed.
AR = Iexposed – Inon_exposed
Where:
Iexposed = Incidence in the exposed group
Inon_exposed = Incidence in the non-exposed group
Attributable risk can be interpreted as follows: “Among those with [the exposure], the incidence of [the outcome] can be reduced by [AR, with the unit of incidence] if there is no [exposure], assuming that [the exposure] causes [the outcome].”
A related measure of impact is attributable risk percent (AR%), which refers to the percentage of the incidence of disease in the exposed group that can be prevented if the exposure is removed.
AR% = [(Iexposed – Inon_exposed)/Iexposed] * 100%
AR% = [AR/Iexposed] * 100
Alternatively:
AR% = [(RR-1)/RR] * 100%
Attributable risk percent (AR%) can be interpreted as follows: “among those with [Exposure], the incidence of [Outcome] can be reduced by [AR%] percent if there is no [Exposure], assuming that [Exposure] causes [Outcome].”
3.3.2 Population Attributable Risk (PAR)
Population attributable risk (PAR) refers to “the proportion by which the incidence of the outcome in the entire population would be reduced if the exposure was eliminated” (Porta, 2008), assuming that the exposure causes the outcome.
PAR = (Ipopulation – Inon_exposed)/Ipopulation
Alternatively (Levin’s Formula):
PAR = [Pexposure(RR-1)]/[1+ Pexposure(RR-1)]
Where:
Ipopulation = Incidence in the population
Inon_exposed = Incidence in the non-exposed group
Pexposure = Prevalence of the exposure
PAR can be interpreted as follows: “In the [population of interest], the incidence of [Outcome] can be reduced by a factor of [PAR] if there is no [Exposure], assuming that [Exposure] causes [Outcome].”
Some policymakers may be more comfortable with percentages, so we can calculate the population attributable risk percent (PAR%), which refers to the percentage of the incidence of disease in the entire population that could have been prevented if there was no exposure, assuming that the exposure causes the disease.
PAR% = PAR*100%
PAR% can be interpreted as follows: “In the population of interest, [PAR%] percent of [Outcome] can be prevented if there is no [Exposure], assuming that [Exposure] causes [Outcome].”
Example 3.3.2.1 In fictional Covidia, findings from a recent randomized trial suggest that going mask-free is associated with a 4 times higher risk of COVID-26 infection compared to using face masks (RR = 4.0). Approximately 30% of Covidia’s population goes mask-free (see Table 3.2.2.1 and 3.2.4.1). Thus:
Pexposure = 30% = 0.30
RR = 4.0
PAR = [Pexposure(RR-1)]/[1+ Pexposure(RR-1)]
PAR = [0.30(4-1)] / [1+0.30(4-1)]
PAR = (0.9) / (1+0.9) = 0.9/1.9 = 0.473
PAR% = PAR * 100 = 47.3%
Interpretation: Approximately 47.3% of the cases of COVID-26 in Covidia can be prevented by enforcing mandatory face mask use on everyone, assuming that going mask-free causes COVID-26 infection.
3.4 Conclusion
In this chapter, we have covered an overview of study designs in epidemiology, including ecological studies, cross-sectional studies, case-control studies, cohort studies, and randomized trials. For each study design, we have covered the calculation and interpretation of measures of association, including odds ratios (OR), risk ratio (RR), attributable risk (AR), and population attributable risk (PAR). In the next chapters, we will explore each type of epidemiological study in greater detail.
References
Bonita, R., Beaglehole, R., & Kjellstrom, T. (2006). Basic Epidemiology (2nd edition). WHO Press. Retrieved from http://whqlibdoc.who.int/publications/2006/9241547073_eng.pdf
Heller, R. F., Buchan, I., Edwards, R., Lyratzopoulos, G., McElduff, P., St Leger, S. (2003). Communicating risks at the population level: application of population impact numbers. British Medical Journal, 327 (7424): 1162–5.
Porta, M. (Ed.). (2008). A Dictionary of Epidemiology (5th edition). Oxford University Press.
Punsawad, C., Phasuk, N., Bunratsami, S., Thongtup, K., Siripakonuaong, N., Nongnaul, S., Prevalence of intestinal parasitic infection and associated risk factors among village health volunteers in rural communities of southern Thailand. BMC Public Health, 17(1): 564. doi: 10.1186/s12889-017-4486-2.
Rothman, Kenneth J. (2002). Epidemiology: An Introduction (1st edition). Oxford University Press.
Weiss, N. S., & Koepsell, T. D. (2014). Epidemiologic Methods: Studying the Occurrence of Illness (2nd edition). Oxford University Press.
WHO. 2018. Tuberculosis Country Profile: Indonesia. https://extranet.who.int/sree/Reports?op=Replet&name=%2FWHO_HQ_Reports%2FG2%2FPROD%2FEXT%2FTBCountryProfile&ISO2=ID&LAN=EN&outtype=html
WHO. 2018. Tuberculosis Country Profile: United States. https://extranet.who.int/sree/Reports?op=Replet&name=%2FWHO_HQ_Reports%2FG2%2FPROD%2FEXT%2FTBCountryProfile&ISO2=US&LAN=EN&outtype=html
