4 Chapter 4: Ecological Studies
Chapter 4: Ecological Studies
Objectives
After completing this module, you should be able to:
1. Define ecological studies.
2. Understand the concept of ecological fallacy.
3. Create plots for ecological correlation assessments. (Optional)
4.1 Introduction
As stated in Chapter 3, ecological studies are observational studies that assess the extent to which an outcome is associated with an exposure at an aggregated or group level (e.g., villages, provinces, regions, countries, or continents). Other types of epidemiological studies generally assess this association at the individual level.
In ecological studies, the primary measure of association is the extent to which the value on the x-axis correlates with the value on the y-axis. This correlation is measured as the correlation coefficient (denoted by the Greek letter rho / r). The values of correlation coefficients can range from -1 to 1. A correlation coefficient of r = 0 denotes no correlation between the exposure and the outcome. A correlation coefficient of r = -1 denotes the strongest possible negative correlation between the exposure and the outcome (the higher the value of the exposure, the lower the value of the outcome). A correlation coefficient of r = 1 denotes the strongest possible positive correlation between the exposure and the outcome (the higher the value of the exposure, the higher the value of the outcome). Consider, as additional examples to those shown in Chapter 3, the correlation between GDP (nominal) per capita (a proxy for average income) and life expectancy in G20 member countries (Figure 4.1.1.1) or the correlation between the Gini index (a measure of income inequality) and life expectancy among these same countries (Figure 4.1.1.2).
Figure 4.1.1.1 Correlation between GDP per capita (nominal) and life expectancy among G20 member countries
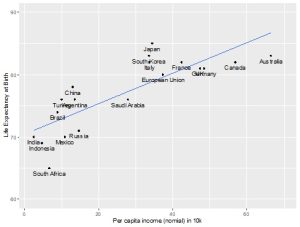
(rho = 0.705, p-value < 0.001)
Data sources
GDP per capita (nominal). https://www.imf.org/en/Publications/WEO/weo-database/2022/October
Life expectancy at birth. https://data.worldbank.org/indicator/SP.DYN.LE00.IN?end=2020
Figure 4.1.1.2 Correlation between Gini index and life expectancy among G20 member countries
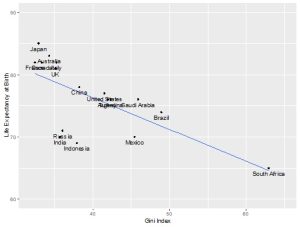
(rho = -0.715, p-value < 0.001)
Data sources
Gini Coefficient. URL: https://data.worldbank.org/indicator/SI.POV.GINI/
Life Expectancy at Birth. URL: https://data.worldbank.org/indicator/SP.DYN.LE00.IN?end=2020
The two figures showed that, on the one hand, GDP per capita (nominal) was significantly and positively correlated with life expectancy. In other words, countries with high GDP per capita (nominal) tended to have a higher life expectancy. On the other hand, the Gini index was significantly and negatively correlated with life expectancy. In other words, countries with a high Gini index (i.e., countries with higher inequality) tended to have lower life expectancy. The results of these analyses suggest that in addition to income, income inequality (or perception thereof) should also be investigated when studying the distribution of health outcomes.
4.2 Ecological Fallacies
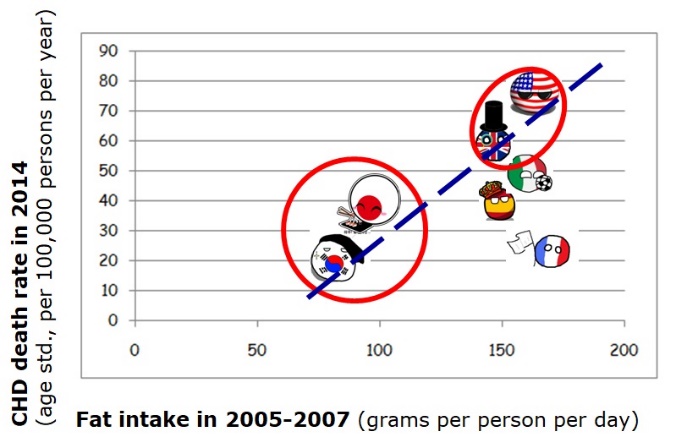
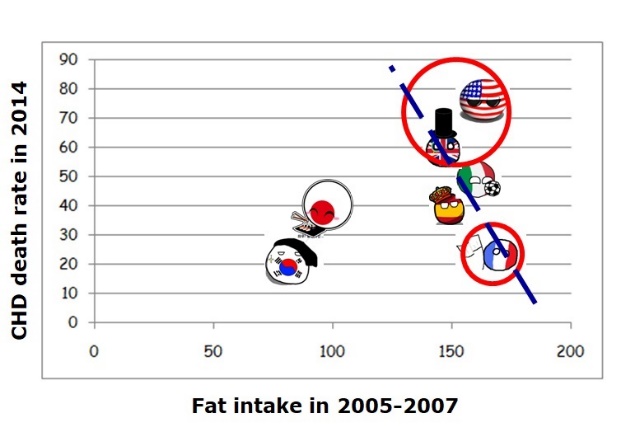
Ecological studies are used as a relatively low-cost, time-efficient means to formulate initial hypotheses that may warrant further individual-level investigation (Bovbjerg, 2020). Preliminary data are available from websites and can be compiled within a matter of hours. However, ecological studies may also be prone to incorrect conclusions. Consider, for example, Figure 4.2.1.1.
Figure 4.2.1.1 Coronary heart disease (CHD) mortality per 100,000 persons, level of fat consumption, and red wine consumption among selected G20 members
|
The Japanese and the Koreans eat little fat and have lower CHD deaths than the British and the Americans. |
The French eat a lot of fat and also have lower CHD deaths than the British and the Americans. |
|
The Japanese and the Koreans drink little red wine and have lower CHD deaths than the British and the Americans. |
The French and the Italians drink a lot of red wine and also have lower CHD deaths than the British and the Americans. |
|
Conclusion: Eat and drink whatever you like! It’s speaking English that kills you! |
|
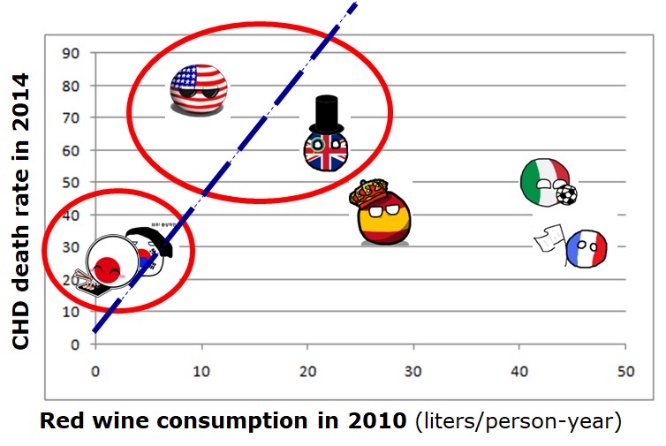
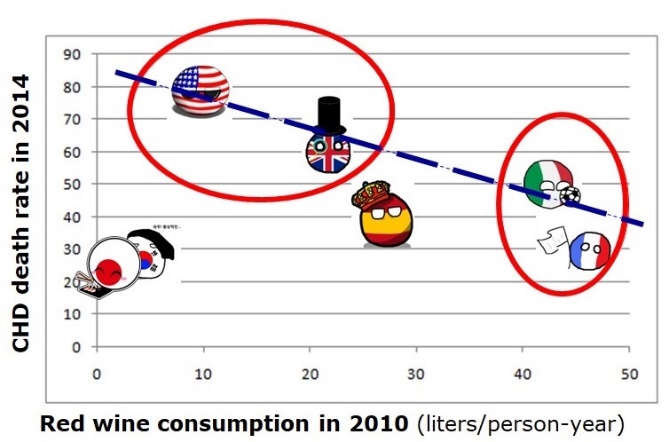
Data sources
Fat intake 2005-2007. URL: http://chartsbin.com/view/1156
Wine consumption per capita 2010. URL: http://www.wineinstitute.org/files/2010_Per_Capita_Wine_Consumption_by_Country.pdf
CHD death rate 2014. URL: https://www.worldlifeexpectancy.com/cause-of-death/coronary-heart-disease/by-country/
The conclusion in the above Figure 4.2.1.1 is an example of a phenomenon called ecological fallacy (also known as aggregation bias). Ecological fallacy is a type of invalid pattern of reasoning that occurs when one makes inferences about etiology at the individual level from aggregated data at the group (e.g., country) level (Szklo & Nieto, 2019). A number of factors may account for these differences at the individual level that are not observed at the population level, including (but not limited to) differences in population structures (e.g., distribution of age and sex) between countries, differences in other health-related behaviors (e.g., physical activity, tobacco use) between countries, and variation at the individual level otherwise not captured by aggregated data.
4.3 Conclusion
In this brief chapter, we have defined and covered the definition of ecological studies (observational studies that assess the extent to which an outcome is associated with an exposure at an aggregated or group level). We have also covered the phenomenon of ecological fallacy (a type of invalid pattern of reasoning that occurs when one makes inferences about etiology at the individual level from aggregated or group-level data).
References
Bovbjerg, M. L. (2020). Foundations of Epidemiology. Oregon State University. https://open.oregonstate.education/epidemiology/
Szklo, M., & Nieto, F. J. (2019). Epidemiology: Beyond the Basics (4th ed.). Jones & Bartlett Learning.
Media Attributions
- Fig_4_1_1_1
- Fig_4_1_1_2
