3
When conducting practice evaluation, techniques differ for situations in which a social worker is working with individual clients or groups of clients. For example, going back to one of our case examples, our social worker who is employed at the outpatient mental health center may have 20 clients, each with different clinical goals and objectives. However, our child welfare social worker may have twenty clients all with the same goal, such as family reunification. In the former situation, we could track interventions with individuals, and in the latter, we might track interventions for the whole group. This chapter focuses on how to engage in simple approaches to practice evaluation on individual client cases involving the use of process and outcome measurements derived from clinical goals and objectives.
We will review two specific techniques, goal attainment scaling and single system design (sometimes referred to as single subject design). Don’t let the technical jargon freak you out too much.
Goal attainment scaling
In order to engage in the practice of goal attainment scaling, you need to have thought about who will do what, to what extent, under what conditions and you will have determined what constitutes successful change (Bloom and Fisher, 2009). Going back to our discussion of clinical goals and objectives, goal attainment scaling would likely be used to track measurable objectives that together made up the goal. This is a quantitative approach that can be supplemented with qualitative data.
Measurable items, or data points, can be tracked hourly, daily, weekly or monthly, for example. You can track process measures about what is going on during the intervention, say, about level of client engagement. You can also separately track your progress towards an outcome measure, such as presentation of symptoms over time (ideally helping clients to alleviate or reduce them). Often, unstandardized behavioral observations are used as measures in goal attainment scaling as well.
Data points are tracked through the use of a scale that ranges from negative two to positive two. Negative two indicates that the client engaged in the measurable action much less than expected, while a score of positive twp indicates that the client engaged in the measurable action much more than expected. Further, a score of zero indicates the client engaged in the ideal behavior at an acceptable level. Please see figure 3.1 for an example of what a goal attainment scale looks like.
|
-2 (much less than expected |
-1 (less than expected) |
0 (Expected outcome) |
+1 (more than expected) |
+2 (much more than expected) |
|
Measurable item name/date |
|
|
|
|
|
Measurable item name/date |
|
|
|
|
|
Measurable item name/date |
|
|
|
|
Figure 3.1 Example of a goal attainment scaling table
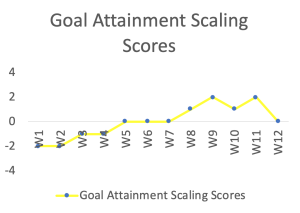
Over time, as data are collected, the social worker can visually track how the client or client system is doing vis-à-vis obtaining their goal. Some of my social work students get overwhelmed when they see a goal attainment scale plotted out in a graph. If you take a deep breath, slow down, and carefully orient yourself to the graph, it becomes much easier to interpret. Truthfully, plotting a graph is easily accomplished in any basic spreadsheet program or writing document where weeks are plotted horizontally and scores are plotted vertically. See Figure 3.2.

Figure 3.2 Visual plotting of goal attainment scaling scores
Single subject design
While goal attainment scaling is the basic tracking of process or outcome measures, single system design (sometimes called single subject design) allows for more complexity in analysis, without being too scary. I promise. According to Royse, Thyer and Padgett (2016), there are four steps social workers need to take in conducting single system design. First, the social worker must choose an easily measured, valid and reliable measure that can be collected over time. Second, data collection will commence and continue over the course of the intervention. Third, the social worker will create a graph showing time on the bottom, horizontal part of the graph and the measure on the left-hand or vertical side of the graph. We are talking about quantitative data in this graph, but these data can be supplemented with qualitative data for a mixed-methods approach. Fourth, the social worker will consider the data carefully, making reasonable inferences about what they see. At this stage, the social worker should be asking “are the data showing client improvement? Are the data demonstrating client deterioration? Do the data depict no change? Are the data unclear?”
The idea is that a social worker will begin by tracking an objective or a set of objectives over time as a baseline measure. Collection of baseline data helps to assess the nature of the presenting problem before the intervention takes place. This phase is referred to by evaluators as the “A” phase. Next, the social worker enters the “B” phase, in which an intervention is delivered to the client or client system. This is tracked for a given time period. This is referred to as the A-B evaluation design. When we say, “evaluation design,” we are referring to decisions about when data are collected. You can also substitute the term “research design” here.
At this point, the social worker can revert to the “A” phase by removing the intervention, in order to see whether the presenting problem has shifted in any way. This is referred to as the A-B-A evaluation design.
Alternately, the social worker can engage in phase “C” in which a second intervention is implemented with the client or client system, to see how the presenting problem shifts. This would be referred to as the A-B-C evaluation design. Other evaluation designs exist with the A, B and C phases as well, but these are the evaluation designs that are most often used. (Insert this callout: You can learn more about how to design a simple line chart for single subject design by viewing this information sheet at this link:
https://combsorme.files.wordpress.com/2011/06/template-instructions1.docx
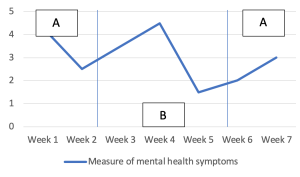
Now, let’s look at one of our case examples through the use of single system design line chart. We can start by considering how our social worker in the mental health clinic might use such a chart, such as that shown in Figure 3.3. As denoted by the letters written on the chart, this single subject design used an A-B-A design. On the left-hand side of the chart, otherwise known as the vertical axis, you see the numbers zero to five, which could represent a Likert scale scoring approach used to track the presence of mental health symptoms, for example. On the bottom of the chart, otherwise known as the horizontal axis, you can see the progression of time, in this case, weeks that the social worker is doing therapy with the client. The jagged line in the middle of the chart helps us to track how the mental health symptoms are manifesting over time as therapy progresses.
It may help to consider what is going on in figure 3.3. During the first A phase, consisting of two weeks, we see the symptoms are noted to be at a level 4 during the first week, but that the drop to about 2.5 during the second week, suggesting volatility of mental health symptoms. However, as we enter the B phase, as the treatment intervention begins, we see an increase over two weeks, followed by a decrease. Now, as we enter the second A phase, we see that mental health symptoms are gearing up again. What does this chart tell us about our social worker’s practice with this client? This chart might suggest some limited support for the efficacy of the social worker’s intervention choice.

Figure 3.3 Example of a single subject design line chart for micro practice
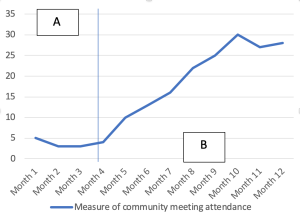
We have considered our micro social work practice example, so now let us consider our macro practice example involving the social worker doing community organizing work. This example uses the AB design. During the A phase of this intervention, our community organizer notes that attendance at community meetings is low, with five or so people attending any given one. What does this chart tell us about our social worker’s work with the community? Starting in month 4, as the community organizing intervention goes into full swing, we see attendance numbers rise consistently over the rest of the year, suggesting that community engagement may be rising.

Figure 3.4 Example of a single subject design line chart for macro practice
Next, let’s think about best practices you should consider when planning to do single client-focused practice evaluation.
Best practices in the ethical conduct of individual client tracking to inform your practice:
Now that you have goal attainment scaling and single subject design concepts under your belt, let’s consider how a social work practitioner would prepare for and conduct a practice evaluation project focused on tracking individual client work.
- Always explain to your client that you will be evaluating your practice during the time you will be working together (i.e. the intervention period and maybe after) in order to determine whether the intervention is effective.
- Explicate that your practice evaluation data will be kept in the client’s record and will be kept confidential and not reported outside of the agency unless a funder requires it, but may be used in supervision.
- After identifying your treatment goal, work together to choose observable and measurable objectives to be used as process and/or outcome measures.
- Commit to sharing your practice evaluation results with your client during the course of the intervention. This can lead to good conversations and progression in the intervention process.
- Share your data with your supervisor and your client in order to consider the intervention process more deeply as a reflexive and reflective practitioner.
In summary, there are two simple ways that social workers can track the progress of their work with individual clients, goal attainment scaling and single system design. Both approaches to practice evaluation use simple, readily accessible technology to track client processes. Engaging in practice evaluation at this level is vital in the quest to be a reflexive and reflective practitioner – as well as an ethical one!
Discussion questions for chapter 3:
- What distinguishes goal attainment scaling from single system design?
- Give an example of a client situation that would benefit from the use of goal attainment scaling.
- Thinking about a client in your field placement, propose a single subject design. Would you use the ABA design, the ABAB design, the ABC design, or something else? Why?
Media Attributions
- Graph depicting goal attainment scaling
- Graph 2 depicting single subject design
- Graph depicting single subject design
