6 Chapter 6 – Bonds
Learning Objectives
- Understand bond terminology.
- Compute the price and yield to maturity (YTM) of a zero-coupon bond.
- Compute the price and yield to maturity (YTM) of a coupon bond.
- Analyze why bond prices change over time.
- Understand how credit risk affects the expected return from holding a corporate bond.
6.1 Introduction to Bonds and Basic Bond Features
6.1.1 Bond Terminology and Structure
Bonds are financial instruments that represent a loan made by an investor to a borrower, typically a corporation or government. These are widely used to raise capital for large projects, public infrastructure, or business expansion. Understanding the terminology and structure of bonds is fundamental for evaluating them as investments.
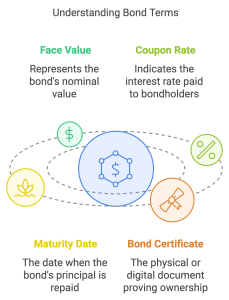
1. Bond Certificate and Maturity Date
-
- The bond certificate is the formal agreement that outlines the terms of the bond, including the issuer, maturity date, coupon rate, and face value.
- The maturity date is when the issuer repays the bond’s face value, marking the end of the bond’s life.
2. Face Value (or Principal)
-
- The face value, also called the par value or principal, is the amount paid back to the investor at maturity. Most bonds have a face value of $1,000.
- This amount is crucial as it determines the bond’s coupon payments.
3. Coupon Payments and Coupon Rate
-
- Bonds often provide periodic interest payments, called coupon payments, based on the coupon rate.
- The coupon rate is expressed as a percentage of the face value and is typically fixed. For example, a bond with a 5% coupon rate on a $1,000 face value will pay $50 annually.
6.1.2 Calculating Coupon Payments
The formula for calculating coupon payments is straightforward:
[latex]\text{Coupon Payment (CPN)} = \frac{\text{Coupon Rate} \times \text{Face Value}}{\text{Number of Payments per Year}}[/latex]
Example Calculation
Suppose a bond has:
-
- Face Value: $1,000
- Coupon Rate: 6%
- Semiannual Payments
The semiannual coupon payment would be:
[latex]\text{CPN} = \frac{6\% \times 1,000}{2} = \$30[/latex]
This means the investor receives $30 every six months until the bond matures.
Practical Example: Analyzing Bond Payments and Structure
Imagine you purchase a corporate bond with the following features:
-
- Face Value: $5,000
- Coupon Rate: 4%
- Annual Payments
- Maturity: 10 years
1. Annual Coupon Payment
[latex]\text{CPN} = \frac{4\% \times 5,000}{1} = \$200[/latex]
The investor will receive $200 each year.
2. Total Interest Over Bond’s Life
[latex]\text{Total Interest} = 200 \times 10 = \$2,000[/latex]
3. Principal Repayment
At maturity, the investor receives the $5,000 face value in addition to the final coupon payment.
6.1.3 Benefits of Bond Investments
1. Predictable Income
•Bonds provide regular, predictable cash flow, making them attractive for income-focused investors like retirees.
2. Capital Preservation
•For high-credit-quality bonds (e.g., U.S. Treasury bonds), there is minimal risk of losing the principal.
3. Portfolio Diversification
•Bonds often behave differently from stocks, providing stability during market volatility.
6.1.4 Comparison of Government and Corporate Bonds
1. Government Bonds
•Issued by national or local governments, these are considered low-risk.
•Examples: U.S. Treasury bonds, municipal bonds.
2. Corporate Bonds
•Issued by companies, these typically offer higher yields to compensate for increased credit risk.
Extended Example
A government bond with a face value of $1,000, a 3% coupon rate, and annual payments provides $30 per year.
In contrast, a corporate bond with a face value of $1,000 and a 6% coupon rate pays $60 per year, but carries a higher risk of default.
6.2 Zero-Coupon Bonds
6.2.1 Zero-Coupon Bond Cash Flows
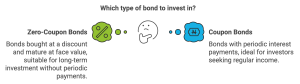
Zero-coupon bonds are a unique type of debt security that does not make periodic interest (coupon) payments. Instead, these bonds are issued at a discount to their face value and repay the full face value at maturity. The difference between the purchase price and the face value represents the bondholder’s return. For example, if you purchase a zero-coupon bond with a face value of $1,000 for $800, you earn $200 in interest over the bond’s life. These bonds are popular for their simplicity and are commonly used for specific financial goals, such as saving for future expenses.
The formula for pricing zero-coupon bonds is as follows:
[latex]Price = Face Value / (1 + r)^n[/latex]
where r is the discount rate (yield to maturity), and n is the number of periods until maturity.
For example, suppose an investor purchases a zero-coupon bond with a face value of $1,000, maturing in 5 years, at a discount rate of 6%. The price of the bond would be:
[latex]Price = 1000 / (1 + 0.06)^5 = 747.26[/latex]
This means the investor pays $747.26 today and receives $1,000 when the bond matures in 5 years. The difference of $252.74 represents the investor’s earnings.
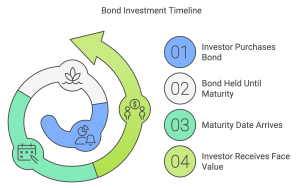
Zero-coupon bonds are especially attractive for investors with a specific financial goal and timeline, such as funding college tuition or retirement. By locking in the return now, they eliminate the uncertainty of market fluctuations, assuming the bond is held to maturity.
Applications of Zero-Coupon Bonds
Zero-coupon bonds are widely used in several financial contexts, such as retirement accounts, education savings plans, and funding future liabilities. For example, parents saving for a child’s college tuition can purchase a zero-coupon bond maturing in 18 years, knowing precisely how much they will receive at that time. Additionally, these bonds are used as benchmarks for risk-free rates, particularly in government-issued bonds like U.S. Treasury STRIPS.
6.2.2 Yield to Maturity of a Zero-Coupon Bond
The yield to maturity (YTM) of a zero-coupon bond is the annualized rate of return an investor earns if the bond is held until maturity. Since zero-coupon bonds do not provide periodic payments, the YTM reflects the bondholder’s total return over the life of the bond, accounting for the difference between the purchase price and the face value.
The formula for calculating YTM is derived from the zero-coupon bond pricing formula:
[latex]YTM = (Face Value / Price)^(1/n) - 1[/latex]
Where:
-
- Face Value is the amount paid to the bondholder at maturity.
- Price is the bond’s current purchase price.
- n is the number of periods until maturity.
Example: Calculating Yield to Maturity
Suppose an investor buys a zero-coupon bond for $600, with a face value of $1,000, and a maturity of 10 years. To calculate the YTM:
[latex]YTM = (1000 / 600)^(1/10) - 1[/latex]
[latex]YTM = (1.6667)^(0.1) - 1[/latex]
[latex]YTM ≈ 0.0519 or 5.19%[/latex]
This means the investor earns an effective annual return of 5.19% by holding the bond until maturity.
Comparing Different Maturities and Prices
Let’s examine how the time to maturity and purchase price affect the YTM. Consider two bonds:
-
- Bond A: 5-year maturity, purchased for $800, face value of $1,000.
- Bond B: 10-year maturity, purchased for $600, face value of $1,000.
For Bond A:
[latex]YTM = (1000 / 800)^(1/5) - 1[/latex]
[latex]YTM ≈ 0.0466 or 4.66%[/latex]
For Bond B:
[latex]YTM = (1000 / 600)^(1/10) - 1[/latex]
[latex]YTM ≈ 0.0519 or 5.19%[/latex]
As seen, longer maturities often result in higher YTMs for the same face value when the purchase price is lower. This highlights the tradeoff between time and return in zero-coupon bonds.
Practical Applications
Zero-coupon bonds are often used as benchmarks for risk-free rates in financial modeling, especially government-issued bonds like U.S. Treasury STRIPS. Their predictable returns make them attractive for long-term financial planning, such as retirement savings or funding specific future liabilities. Additionally, they are favored for their simplicity in calculating returns and for eliminating reinvestment risk since no interim payments are made.
6.2.3 Risk-Free Interest Rates
Risk-free interest rates represent the theoretical return on an investment with no risk of financial loss. In practice, government-issued zero-coupon bonds, such as U.S. Treasury bonds, are often used as proxies for risk-free rates due to their high creditworthiness and negligible default risk.
Why Use Zero-Coupon Bonds as Benchmarks?
-
- No Reinvestment Risk: Zero-coupon bonds do not make interim payments, avoiding the uncertainty of reinvesting coupons at fluctuating rates.
- Simplicity: Their pricing structure, based solely on the face value and time to maturity, provides a straightforward measure of interest rates for a given time horizon.
- Government Backing: Treasury zero-coupon bonds are considered virtually risk-free, making them reliable for financial models and comparisons.
The Role of Risk-Free Rates in Finance
Risk-free rates are foundational in financial calculations and decision-making. They:
-
- Serve as the starting point for pricing other securities by adding risk premiums.
- Help assess opportunity costs in capital budgeting and investment appraisals.
- Determine the cost of equity in models like the Capital Asset Pricing Model (CAPM).
Example: Using Risk-Free Rates in Investment Decisions
Imagine an investor is deciding between two investments:
•A corporate bond offering a 7% yield with moderate credit risk.
•A 10-year Treasury zero-coupon bond yielding 3.5%.
The difference in yield, known as the risk premium, is:
Risk Premium = Corporate Bond Yield - Risk-Free Rate
Risk Premium = 7% - 3.5% = 3.5%
The investor must evaluate whether the additional 3.5% return compensates for the credit risk associated with the corporate bond.
Real-World Application: Risk-Free Rates in Corporate Finance
A company evaluates a project with an expected return of 8%. The project’s risk-adjusted cost of capital is based on the 10-year Treasury rate of 3% plus a risk premium of 4%:
Cost of Capital = Risk-Free Rate + Risk Premium
Cost of Capital = 3% + 4% = 7%
Since the project’s return (8%) exceeds the cost of capital (7%), the company decides to proceed.
Challenges in Estimating Risk-Free Rates
-
-
- Inflation Expectations: Nominal risk-free rates reflect anticipated inflation, making it important to adjust for real returns in long-term analyses.
- Currency and Country Risk: In global finance, different governments have varying credit standings, leading to multiple benchmarks for “risk-free” rates.
-
Key Insight
The risk-free rate sets the baseline for evaluating all financial assets. Whether in valuing investments, pricing bonds, or determining discount rates, understanding and applying this concept is crucial for informed decision-making.
Case Study: Planning for Future Expenses with Zero-Coupon Bonds
Case Study Overview
This case highlights how an investor, Jane, uses zero-coupon bonds to plan for her child’s college education, leveraging the bonds’ predictable growth and risk-free nature. The scenario explores the benefits and considerations of investing in zero-coupon bonds to meet specific future financial goals.
Scenario
Jane’s child will begin college in 10 years, and tuition costs are projected to be $30,000 at that time. Jane decides to invest in a 10-year U.S. Treasury zero-coupon bond to secure this amount. The bond currently offers a yield to maturity (YTM) of 5%.
Step 1: Calculating the Initial Investment
To determine how much Jane needs to invest today, we use the zero-coupon bond pricing formula:
$$\text{Price} = \frac{\text{Face Value}}{(1 + r)^n}$$
Where:
-
- Face Value = $30,000
- r = 5% or 0.05 (YTM)
- n = 10 years
Substitute the values:
$$\text{Price} = \frac{30,000}{(1 + 0.05)^{10}} = \frac{30,000}{1.6289} \approx 18,421.05$$
Initial Investment: Jane needs to invest $18,421.05 today to ensure $30,000 in 10 years.
Step 2: Comparing Alternatives
Jane considers an alternative investment: a savings account offering 3% annual interest, compounded annually. To calculate the future value of the same $18,421.05 investment in this account, we use the compound interest formula:
$$\text{Future Value} = \text{Principal} \times (1 + r)^n$$
$$\text{Future Value} = 18,421.05 \times (1 + 0.03)^{10} \approx 18,421.05 \times 1.3439 \approx 24,741.39$$
Result: The savings account would grow to $24,741.39 in 10 years, falling short of the $30,000 goal. The zero-coupon bond is the better option for this specific objective.
Step 3: Exploring Risk and Tax Implications
-
- Risk: The zero-coupon bond has negligible default risk because it is a U.S. Treasury bond. Jane is guaranteed the $30,000 if held to maturity.
- Tax Considerations:
-
- If held in a tax-advantaged account (e.g., 529 plan), the bond’s interest income accrues tax-free.
- In a taxable account, Jane must pay taxes annually on the bond’s imputed interest, even though she doesn’t receive cash until maturity (a concept known as “phantom income”).
Step 4: Monitoring Bond Value Over Time
To understand how the bond’s price changes as it approaches maturity, Jane can calculate its price at different intervals. For example:
-
- 5 Years Remaining:
$$\text{Price} = \frac{30,000}{(1 + 0.05)^5} = \frac{30,000}{1.2763} \approx 23,502.75$$
-
- 2 Years Remaining:
$$\text{Price} = \frac{30,000}{(1 + 0.05)^2} = \frac{30,000}{1.1025} \approx 27,210.88$$
These calculations demonstrate how the bond’s value grows predictably over time.
Lessons from the Case Study
-
- Predictability: Zero-coupon bonds offer a guaranteed outcome if held to maturity, making them ideal for specific financial goals.
- Comparative Returns: While other investments may offer higher potential returns, their risk and variability might not align with fixed financial needs.
- Tax Efficiency: Investors should consider the tax implications of holding zero-coupon bonds in taxable accounts.
Conclusion
By investing $18,421.05 in a 10-year zero-coupon bond, Jane secures her child’s future tuition needs while avoiding market volatility. This example illustrates the practical application of zero-coupon bonds for achieving specific financial objectives with minimal risk.
6.3 Coupon Bonds
6.3.1 Coupon Bond Cash Flows
Concept Overview
Coupon bonds are a type of debt security where the issuer makes periodic interest payments (called coupon payments) to the bondholder until the bond matures. At maturity, the bondholder also receives the face value (principal) of the bond. Coupon bonds are widely used by corporations, governments, and other entities to raise capital.
Key Features
-
-
- Coupon Payments: Regular payments based on the bond’s coupon rate, calculated as a percentage of the bond’s face value.
- Maturity Date: The date on which the bond’s face value is repaid to the bondholder.
- Face Value (Principal): The amount repaid at maturity, typically $1,000 per bond.
-
Formula for Coupon Payment
[latex]\text{Coupon Payment (CPN)} = \frac{\text{Coupon Rate} \times \text{Face Value}}{\text{Number of Payments per Year}}[/latex]
Example Calculation
Consider a bond with:
- Face Value: $1,000
- Coupon Rate: 6%
- Semiannual Payments
Each payment is calculated as:
[latex]\text{CPN} = \frac{6\% \times 1,000}{2} = 30[/latex]
This bond pays $30 every six months until maturity.
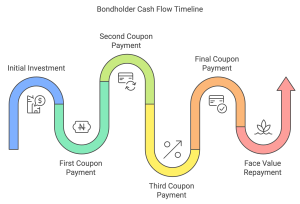
Illustrative Example: Total Cash Flows of a 10-Year Coupon Bond
A company issues a 10-year bond with the following terms:
-
- Face Value: $1,000
- Coupon Rate: 5% (semiannual payments)
- Maturity: 10 years
The bondholder receives:
1. Semiannual Coupon Payments:
[latex]\text{CPN} = \frac{5\% \times 1,000}{2} = 25[/latex]
Payments of $25 are made every six months for 10 years, totaling:
[latex]25 \times 20 = 500[/latex]
2. Face Value at Maturity:
At the end of the 10th year, the bondholder receives the $1,000 face value in addition to the final coupon payment.
Total Cash Flows:
[latex]500 (\text{Coupon Payments}) + 1,000 (\text{Face Value}) = 1,500[/latex]
6.3.2 Yield to Maturity (YTM) of a Coupon Bond
Concept Overview
The yield to maturity (YTM) represents the total return an investor earns if the bond is held until maturity, considering both coupon payments and any capital gain or loss due to the bond’s purchase price. YTM is expressed as an annualized percentage rate.
YTM Formula
Finding the YTM requires solving the following equation for YTM, where C is the annual coupon payment, P is the current price, F is the face value, and N is the number of years to maturity.
$$P = \frac{C}{(1 + YTM)^1} + \frac{C}{(1 + YTM)^2} + … + \frac{C + F}{(1 + YTM)^N}$$
Where:
-
- P = Current Price of the Bond
- t = Time Period
- n = Number of Periods until Maturity
- r = YTM (to be solved for)
Example Calculation: YTM for a Discount Bond
A 5-year bond has the following characteristics:
-
- Face Value: $1,000
- Coupon Rate: 6% (semiannual payments)
- Current Price: $950
1. Coupon Payment:
[latex]\text{CPN} = \frac{6\% \times 1,000}{2} = 30[/latex]
2. YTM Calculation:
Using financial tools, the YTM is approximately 6.78% annually (3.39% per period). This is higher than the coupon rate because the bond was purchased at a discount.
YTM Interpretation
-
- If the bond is bought at par value: YTM equals the coupon rate.
- If the bond is bought at a discount: YTM is higher than the coupon rate.
- If the bond is bought at a premium: YTM is lower than the coupon rate.
Case Study: Comparing YTMs of Bonds with Different Prices
Consider three bonds with identical terms except for their prices:
-
- Bond A: Priced at $1,050 (premium)
- Bond B: Priced at $1,000 (par)
- Bond C: Priced at $950 (discount)
Bond A’s YTM will be lower than the coupon rate, Bond B’s YTM will equal the coupon rate, and Bond C’s YTM will be higher than the coupon rate. This example demonstrates how bond prices influence yields and helps investors assess whether a bond meets their return expectations.
6.3.3 Coupon Bond Price Quotes
Concept Overview
Bond prices are commonly quoted as a percentage of their face value. A bond trading at par has a quoted price of 100, meaning its price is equal to its face value. Bonds trading at a premium (above par) or a discount (below par) have quoted prices above or below 100, respectively.
Formula for Bond Price from Quote
[latex]\text{Price} = \text{Face Value} \times \frac{\text{Quoted Price}}{100}[/latex]
Example 1: Calculating Price from a Quote
Consider a corporate bond with:
-
- Face Value: $1,000
- Quoted Price: 105.5
The price of the bond is:
[latex]\text{Price} = 1,000 \times \frac{105.5}{100} = 1,055[/latex]
This bond is trading at a premium, meaning investors are paying $1,055 to purchase it.
Example 2: Discount Bond
If a bond with a face value of $1,000 is quoted at 97.25, its price is:
[latex]\text{Price} = 1,000 \times \frac{97.25}{100} = 972.50[/latex]
This bond is trading at a discount and costs $972.50.
Interpreting Bond Quotes in the Market
Bond price quotes reflect current market demand and interest rates. Several factors influence whether a bond trades at a premium or discount:
1. Coupon Rate vs. Market Rate:
•If the bond’s coupon rate is higher than prevailing market rates, it trades at a premium.
•If the bond’s coupon rate is lower than market rates, it trades at a discount.
2. Issuer Credit Risk: Bonds from issuers with strong credit ratings may trade at premiums due to perceived safety, while those with weaker credit ratings may trade at discounts.
3. Time to Maturity: Shorter-term bonds tend to have prices closer to par, while long-term bonds may show greater premiums or discounts depending on interest rate changes.
Case Study: Real-World Bond Quotes and Investor Decisions
Scenario:
An investor is evaluating two corporate bonds with the following details:
-
- Bond A: Quoted at 102, 5-year maturity, 4% coupon rate.
- Bond B: Quoted at 97, 10-year maturity, 4% coupon rate.
Analysis:
- Bond A costs:
[latex]\text{Price} = 1,000 \times \frac{102}{100} = 1,020[/latex]
- Bond B costs:
[latex]\text{Price} = 1,000 \times \frac{97}{100} = 970[/latex]
Although both bonds have the same coupon rate, Bond A trades at a premium because of its shorter maturity, making it less sensitive to interest rate risk. Bond B trades at a discount due to its longer maturity, which increases exposure to interest rate changes.
Investor Decision:
The investor considers their risk tolerance and investment goals:
-
- If they prefer stability and shorter time horizons, Bond A is more suitable despite its premium price.
- If they are comfortable with greater interest rate risk for potentially higher returns (via yield to maturity), Bond B might be the better choice.
6.4 Why Bond Prices Change
6.4.1. Interest Rate Changes and Bond Prices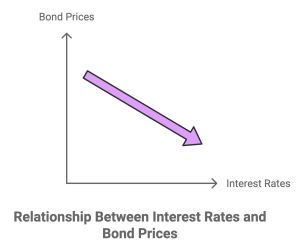
Concept Overview
Bond prices and interest rates have an inverse relationship:
-
- When interest rates rise, bond prices fall.
- When interest rates fall, bond prices rise.
This occurs because newly issued bonds reflect the current market rate, making older bonds with lower coupon rates less attractive, leading to a price decrease. Conversely, older bonds with higher coupon rates become more desirable when rates drop, increasing their prices.
Formula for Bond Price
The price of a bond is the present value of its future cash flows (coupon payments and face value), discounted at the market interest rate (r):
$$\text{Bond Price} = \sum_{t=1}^{n} \frac{\text{Coupon Payment}}{(1 + r)^t} + \frac{\text{Face Value}}{(1 + r)^n}$$
Example: Calculating Bond Prices at Different Interest Rates
Consider a bond with:
-
- Face Value: $1,000
- Coupon Rate: 5% (annual payments of $50)
- Maturity: 10 years
Step 1: Bond Price When Interest Rate = 3% (Premium Bond)
Market rate is below the bond’s coupon rate, making it more attractive.
$$\text{Bond Price} = \sum_{t=1}^{10} \frac{50}{(1.03)^t} + \frac{1,000}{(1.03)^{10}}$$
Using present value calculations:
$$\text{Coupon PV} \approx 431.35, \quad \text{Face Value PV} \approx 744.09$$
$$\text{Total Price} = 431.35 + 744.09 = 1,175.44$$
At 3%, the bond price is $1,175.44, trading at a premium.
Step 2: Bond Price When Interest Rate = 5% (Par Bond)
Market rate equals the bond’s coupon rate.
$$\text{Bond Price} = \sum_{t=1}^{10} \frac{50}{(1.05)^t} + \frac{1,000}{(1.05)^{10}} = 1,000$$
The bond trades at par value.
Step 3: Bond Price When Interest Rate = 7% (Discount Bond)
Market rate exceeds the bond’s coupon rate, making it less attractive.
[latex]\text{Coupon PV} \approx 351.51, \quad \text{Face Value PV} \approx 508.35[/latex]
[latex]\text{Total Price} = 351.51 + 508.35 = 859.86[/latex]
At 7%, the bond price is $859.86, trading at a discount.
6.4.2. Time to Maturity and Bond Prices
Concept Explanation
The time to maturity affects a bond’s price sensitivity to interest rate changes. Long-term bonds are more sensitive to interest rate fluctuations than short-term bonds, a phenomenon quantified by duration.
Duration
Duration measures a bond’s sensitivity to interest rate changes, expressed in years. Modified duration adjusts duration to account for yield to maturity.
Formula for Price Change Using Modified Duration
[latex]\text{Price Change (\%)} \approx -\text{Modified Duration} \times \text{Change in Interest Rate}[/latex]
Example: Impact of Duration on Bond Price
Consider two bonds:
-
- Bond A: 5-year maturity, modified duration = 4.2 years.
- Bond B: 20-year maturity, modified duration = 15 years.
If interest rates rise by 1%:
Bond A:
$$\text{Price Change (\%)} = -4.2 \times 1\% = -4.2\%$$
Bond B:
$$\text{Price Change (\%)} = -15 \times 1\% = -15\%$$
Analysis
Bond B’s longer maturity and higher duration make it more sensitive to rate changes, emphasizing the importance of time to maturity in assessing bond risk.
6.4.3. Interest Rate Risk and Bond Prices
Concept Overview
Interest rate risk refers to the potential for bond prices to fluctuate due to changes in interest rates. Bonds with longer maturities or lower coupon rates are more sensitive to interest rate changes, leading to greater price volatility. Investors managing portfolios must carefully balance interest rate risk based on their investment horizon and risk tolerance.
Detailed Example: Managing Interest Rate Risk in a Bond Portfolio
A portfolio manager oversees a $5,000,000 bond portfolio with the following composition:
-
- Bond A: A government bond with a modified duration of 3 years, market value = $1,000,000.
- Bond B: A corporate bond with a modified duration of 7 years, market value = $2,000,000.
- Bond C: A long-term Treasury bond with a modified duration of 15 years, market value = $2,000,000.
The manager forecasts a 1% rise in market interest rates and aims to minimize potential losses.
Step 1: Calculate Portfolio’s Current Modified Duration
The portfolio’s overall modified duration is the weighted average of its components:
[latex]\text{Portfolio Modified Duration} = \frac{\sum(\text{Bond Market Value} \times \text{Bond Modified Duration})}{\text{Total Portfolio Value}}[/latex]
[latex]\text{Portfolio Modified Duration} = \frac{(1,000,000 \times 3) + (2,000,000 \times 7) + (2,000,000 \times 15)}{5,000,000}[/latex]
[latex]\text{Portfolio Modified Duration} = \frac{3,000,000 + 14,000,000 + 30,000,000}{5,000,000} = 9.4 \text{ years}[/latex]
Step 2: Estimate Portfolio Price Change
Using the price change formula:
[latex]\text{Price Change (\%)} = -\text{Modified Duration} \times \text{Change in Interest Rate}[/latex]
[latex]\text{Price Change (\%)} = -9.4 \times 0.01 = -9.4\%[/latex]
The estimated dollar loss is:
[latex]\text{Dollar Loss} = \text{Portfolio Value} \times \text{Price Change (\%)}[/latex]
[latex]\text{Dollar Loss} = 5,000,000 \times -0.094 = -470,000[/latex]
If interest rates rise by 1%, the portfolio value is expected to decrease by approximately $470,000.
Step 3: Adjust the Portfolio to Reduce Duration
The manager decides to sell $1,000,000 of Bond C (longest duration) and reinvest in Bond A (shortest duration) to reduce the portfolio’s sensitivity to interest rate changes.
Revised Portfolio:
-
- Bond A: $2,000,000 at a modified duration of 3 years.
- Bond B: $2,000,000 at a modified duration of 7 years.
- Bond C: $1,000,000 at a modified duration of 15 years.
Step 4: Calculate Revised Portfolio Duration
[latex]\text{New Modified Duration} = \frac{(2,000,000 \times 3) + (2,000,000 \times 7) + (1,000,000 \times 15)}{5,000,000}[/latex]
[latex]\text{New Modified Duration} = \frac{6,000,000 + 14,000,000 + 15,000,000}{5,000,000} = 7.0 \text{ years}[/latex]
Step 5: Estimate New Portfolio Price Change
Using the new modified duration:
[latex]\text{Price Change (\%)} = -7.0 \times 0.01 = -7.0\%[/latex]
[latex]\text{New Dollar Loss} = 5,000,000 \times -0.07 = -350,000[/latex]
After the adjustment, the estimated loss is reduced to $350,000.
Case Study: Interest Rate Sensitivity in Portfolio Management
Scenario
A portfolio manager oversees a $2,000,000 bond portfolio, composed of short-, medium-, and long-duration bonds. With a forecasted 1% interest rate hike, the manager calculates the portfolio’s sensitivity to interest rates using modified duration and adjusts the allocation to mitigate potential losses.
Initial Portfolio Composition and Duration
-
- Bond A: Government bond with a duration of 3 years, valued at $500,000 (Modified Duration: 2.8).
- Bond B: Corporate bond with a duration of 7 years, valued at $700,000 (Modified Duration: 6.5).
- Bond C: Long-term Treasury bond with a duration of 15 years, valued at $800,000 (Modified Duration: 14.1).
The weighted average modified duration of the portfolio is calculated as 8.615, meaning a 1% interest rate increase would lead to an estimated 8.615% decline in portfolio value, or a $172,300 loss.
Adjusting the Portfolio
To reduce risk, the manager reallocates $400,000 from Bond C to Bond A, shortening the portfolio’s overall duration. After the adjustment:
-
- Bond A’s allocation increases to $900,000 (Modified Duration: 2.8).
- Bond B remains at $700,000 (Modified Duration: 6.5).
- Bond C’s allocation decreases to $400,000 (Modified Duration: 14.1).
The new weighted average modified duration is 6.355, reducing the estimated loss to $127,100 for a 1% interest rate hike.
Key Takeaways
This case highlights the importance of managing duration to control interest rate risk. By reallocating toward shorter-duration bonds, the manager effectively reduces the portfolio’s sensitivity to rate changes, demonstrating a practical application of modified duration in risk management.
6.4.5 Callable Bonds
A callable bond is a bond that allows the issuer to redeem it before the scheduled maturity date at a predetermined price, known as the call price. This feature gives issuers flexibility to refinance debt if interest rates drop, but it introduces reinvestment risk for bondholders, who may not be able to reinvest at the same return.
How Callable Bonds Work
When an issuer calls a bond, they typically pay bondholders the face value plus a premium, known as the call premium. For example, if a bond with a face value of $1,000 is called at a call price of $1,050, the bondholder will receive $1,050. Callable bonds usually offer higher coupon rates to compensate for the risk of early redemption.
Key Terms
-
- Call Price: The amount the issuer pays to call the bond, usually higher than the face value.
- Call Date: The first date the bond can be called by the issuer.
- Call Protection Period: A period during which the bond cannot be called.
- Yield to Call (YTC): The return an investor earns if the bond is called before maturity.
- Why Issuers Call Bonds
Issuers call bonds to save on interest payments. If market interest rates fall, they can call their existing bonds and issue new bonds at lower rates. This reduces their cost of borrowing.
Risks for Investors
Callable bonds introduce reinvestment risk. If a bond is called when interest rates are lower, bondholders may have to reinvest the proceeds at a lower return. This makes callable bonds less attractive compared to non-callable bonds.
Example of Reinvestment Risk:
-
- A $1,000 callable bond pays a 5% coupon and matures in 10 years. The bond is callable after 5 years at a call price of $1,050.
- If the bond is called after 5 years, the bondholder receives $1,050 but must now reinvest at prevailing lower rates.
Formula for Yield to Call (YTC)
The YTC formula is similar to the YTM formula, but it assumes the bond is called on the call date instead of held to maturity.
YTC Formula:
YTC ≈ (Annual Coupon Payment + (Call Price - Current Price) / Years to Call) / ((Call Price + Current Price) / 2)
Where:
-
- Annual Coupon Payment = Face Value × Coupon Rate
- Call Price = Price at which the bond is redeemed early
- Current Price = Price paid for the bond
- Years to Call = Time until the bond can be called
Example: Solving a Callable Bond Problem
Scenario:
A company issues a $1,000 face value callable bond with a 4% annual coupon rate. The bond is callable in 5 years at $1,050 and is currently priced at $980.
Calculate:
- The current yield
- The yield to call (YTC)
- The total cash flow if the bond is called in 5 years
Step 1: Current Yield
Current Yield = Annual Coupon Payment / Current Price
= (4% × $1,000) / $980
= $40 / $980
= 4.08%
Step 2: Yield to Call (YTC)
YTC ≈ ($40 + ($1,050 - $980) / 5) / (($1,050 + $980) / 2)
= ($40 + $14) / $1,015
= $54 / $1,015
≈ 5.32%
Step 3: Total Cash Flow if Called
Total Cash Flow = Coupon Payments for 5 Years + Call Price
= ($40 × 5) + $1,050
= $200 + $1,050
= $1,250
Final Notes for Problem-Solving
-
- YTC is only relevant if the bond is expected to be called. If the bond is unlikely to be called, use YTM instead.
- Investors should compare YTM and YTC to decide if the bond is worth investing in.
6.5 Corporate Bonds
 6.5.1. Credit Risk
Corporate bonds differ from government bonds primarily because they carry credit risk—the risk that the issuing company may default on interest or principal payments. The level of credit risk depends on the financial stability and creditworthiness of the issuing company.
Measuring Credit Risk
- Credit Ratings: Agencies like Moody’s, S&P, and Fitch assign credit ratings to corporate bonds based on the issuer’s creditworthiness. Ratings range from investment-grade (AAA to BBB) to speculative-grade or “junk bonds” (BB and below).
- Credit Spread: The difference in yield between a corporate bond and a risk-free government bond of similar maturity compensates investors for the additional risk.
Example: Credit Spread Calculation
Imagine a 10-year U.S. Treasury bond yields 2.5%, and a corporate bond from XYZ Corporation of the same maturity yields 4.5%. The credit spread is:
[latex]\text{Credit Spread} = \text{Corporate Bond Yield} - \text{Treasury Bond Yield} = 4.5\% - 2.5\% = 2.0\%[/latex]
This spread reflects the additional compensation investors demand for taking on XYZ Corporation’s credit risk.
Case Study: Impact of Credit Risk on Corporate Bonds During Economic Downturns
The 2008 financial crisis caused severe stress in corporate bond markets, leading to a widening of credit spreads, especially for high-yield bonds. As default risks rose, investors demanded higher yields on corporate debt, reflecting heightened credit risk.
Understanding Credit Spreads
Credit spreads are the additional yield investors require over risk-free bonds (like Treasuries) to compensate for credit risk. When default risk rises, these spreads widen as investors seek higher compensation.
Spread Widening During the Crisis
-
- Pre-Crisis: Before 2008, high-yield bond spreads were around 3-4% over Treasuries, with investment-grade spreads at 1-2%.
- Crisis Escalation: As financial instability grew, high-yield spreads surged to over 15%, and investment-grade spreads reached 5-6%.
- Impact on Yields and Prices: This widening caused yields to rise sharply and bond prices to fall. For instance, a high-yield bond yielding 7% pre-crisis might yield over 20% at the crisis peak, dropping its price as investors required higher returns.
Investor Sentiment and “Flight to Quality”
The crisis led to a flight to safety, with investors favoring Treasuries, which pushed Treasury yields lower and widened spreads further. This shift made refinancing costly for high-yield issuers facing elevated default risks.
Key Takeaways
-
- Economic Conditions and Credit Spreads: Credit spreads widened dramatically as investor risk aversion rose.
- Bond Ratings and Spread Impact: High-yield bonds saw the largest spread increases due to higher perceived risk.
- Market Volatility: Investor sentiment shifted sharply from risk-taking to risk-aversion, affecting bond prices and yields.
- Post-Crisis Recovery: Spreads narrowed after stabilization but showed how sensitive bond markets are to economic uncertainty.
6.5.2. Corporate Bond Yields
Concept Explanation
The yield on a corporate bond represents the return an investor expects to earn. This yield incorporates the bond’s coupon payments, the price paid, and the time until maturity.
Types of Yields
-
- Current Yield: The bond’s annual coupon payment divided by its market price:
$$\text{Current Yield} = \frac{\text{Coupon Payment}}{\text{Bond Price}}$$
-
- Yield to Maturity (YTM): The total return expected if the bond is held to maturity. YTM considers both coupon payments and capital gains or losses.
Example: Calculating Current Yield and YTM
Consider a corporate bond with:
-
- Face Value: $1,000
- Coupon Rate: 5% (annual payment of $50)
- Market Price: $950
1. Current Yield:
$$\text{Current Yield} = \frac{50}{950} \approx 5.26\%$$
2. Yield to Maturity:
YTM, considering the discount, is higher than the current yield. In this case, the YTM may be around 5.8%, depending on the exact time to maturity.
Case Study: Corporate Bond Ratings and Market Impact
In 2020, economic challenges from the COVID-19 pandemic led to widespread credit rating downgrades. When a company’s bond rating is downgraded, especially from investment-grade (e.g., BBB) to high-yield (e.g., BB), it signals increased risk to investors and has immediate impacts:
-
- Higher Borrowing Costs: Companies face higher yields on new bonds.
- Falling Bond Prices: Downgraded bonds often lose value due to reduced demand from risk-averse investors.
- Market Ripple Effect: Downgrades can affect investor sentiment broadly, increasing caution toward similar companies or industries.
For example, Company ABC’s bond rating dropped from BBB to BB, causing its bond yield to rise from 4% to 7% and its price to fall from $1,000 to $860.
6.5.3. Bond Ratings
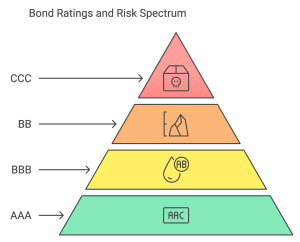
Bond ratings, assigned by agencies like Moody’s, S&P, and Fitch, assess the creditworthiness of a corporate bond issuer. These ratings reflect the likelihood of the issuer defaulting on payments and significantly influence the bond’s yield and price. They help investors gauge the risk associated with a particular bond.
Rating Scales
1. Investment-Grade Bonds:
-
- AAA to BBB: Bonds with a high probability of repayment and low risk of default.
Example: Bonds issued by blue-chip companies or stable corporations.
2. Speculative-Grade (High-Yield or Junk) Bonds:
-
- BB and Below: Bonds with a higher risk of default but offering higher yields to compensate investors.
Example: Bonds from smaller or financially weaker companies with uncertain credit stability.
How Ratings Influence Bonds
-
- Higher Ratings (AAA, AA): Lower yields due to lower risk.
- Lower Ratings (BB, B, CCC): Higher yields to attract investors willing to take on greater risk.
Example: Interpreting Bond Ratings
Imagine Company XYZ issues a bond rated BBB. While still investment-grade, it represents a higher risk than an AA-rated bond. As a result, the BBB bond yields 4.5%, compared to 3% for an AA-rated bond with similar terms. An investor must weigh whether the additional yield compensates for the greater risk of default.
Case Study: Impact of Rating Downgrades on Corporate Bonds
Scenario
In 2020, the economic downturn caused by the COVID-19 pandemic led to widespread rating downgrades in the corporate bond market. Companies previously rated BBB were downgraded to BB, pushing their bonds into the speculative-grade category.
Effects of the Downgrades
- Increased Borrowing Costs: Downgraded companies faced higher interest rates for issuing new debt.
- Market Price Declines: Bond prices fell as investors demanded higher yields to account for the increased risk.
- Forced Selling: Many institutional investors (e.g., pension funds) are restricted to holding investment-grade bonds. Downgrades forced these institutions to sell downgraded bonds, exacerbating price drops.
Example
Consider Company ABC, which issued a $1,000 bond at 5% interest. Pre-downgrade, the bond traded at par value ($1,000). After the downgrade from BBB to BB:
- The bond’s price dropped to $900 to offer a higher yield of 6% in line with market expectations.
- Institutional investors sold the bond, increasing market supply and reducing demand, further lowering the price.
Key Lessons from the Case Study
- Credit Ratings’ Influence: A downgrade dramatically affects bond prices and yields.
- Risk Awareness: Investors holding lower-rated bonds must prepare for potential volatility in uncertain economic conditions.
- Diversification: Mitigating exposure to speculative-grade bonds can protect portfolios during economic downturns.
6.5.4. Corporate Yield Curves
Concept Explanation
The corporate yield curve illustrates the relationship between bond yields and their maturities for corporate issuers. Unlike the Treasury yield curve, which reflects risk-free rates, the corporate yield curve incorporates credit risk and liquidity factors, making it a valuable tool for analyzing corporate bonds.
Factors Influencing the Corporate Yield Curve
-
- Credit Quality:
-
- Higher-rated bonds (e.g., AAA) have lower yield curves due to lower default risk.
- Lower-rated bonds (e.g., BB) exhibit higher yield curves to compensate for increased credit risk.
-
- Economic Conditions:
-
- During economic downturns, yield curves often steepen as long-term bonds carry higher yields to reflect elevated risk over time.
-
- Market Sentiment:
-
- Investor confidence or caution impacts demand for short- or long-term bonds, influencing the shape of the yield curve.
Example: Constructing a Corporate Yield Curve
Consider a company issuing bonds with the following maturities and yields:
-
- 2-year bond: 3.5%
- 5-year bond: 4.2%
- 10-year bond: 5.0%
Plotting these yields against their maturities results in an upward-sloping yield curve, indicating that investors demand higher returns for longer-term commitments due to the increased risks over time.
Key Observations
-
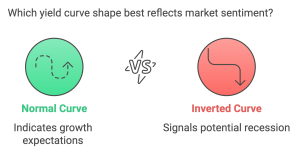
- Steep Yield Curve: Reflects higher perceived risk or expectations of rising interest rates.
- Flat Yield Curve: Suggests stability or economic uncertainty, with minimal differences in yields across maturities.
- Inverted Yield Curve: May indicate economic recession expectations, as short-term yields exceed long-term yields
Case Study: Corporate Yield Curve Dynamics During Economic Stress
Scenario
The 2008 financial crisis caused significant changes in corporate yield curves. Investors demanded higher yields for long-term bonds due to increased credit risk and uncertainty about economic recovery.
Observations During the Crisis
- Steepening Yield Curves:
Short-term bonds retained relatively low yields as investors sought safe, short-term commitments.
Long-term bonds experienced sharp yield increases due to heightened uncertainty and credit risk.
- Risk Perception:
Companies with lower credit ratings saw their yield curves steepen more dramatically, reflecting investor wariness about long-term obligations.
- Liquidity Challenges:
High-yield bonds became harder to sell, further increasing their yields and steepening their curves.
Example
Imagine Company DEF, which issues a 2-year bond at 4% and a 10-year bond at 8% during a downturn. The steep yield curve highlights the added risk perceived by investors over the longer time horizon.
Key Takeaways
- Bond Basics: Bonds are financial instruments that provide periodic interest payments (coupons) and repay the principal at maturity. Key features include face value, maturity, and coupon rates.
- Zero-Coupon Bonds: These bonds do not pay periodic interest but are sold at a discount and redeemed at face value upon maturity. Their value depends on the time to maturity and prevailing discount rates.
- Coupon Bonds: Coupon bonds offer regular interest payments and return the face value at maturity. Their prices are influenced by coupon rates, market interest rates, and time to maturity.
- Bond Pricing and Interest Rates: Bond prices move inversely to interest rates. When interest rates rise, bond prices fall, and vice versa, highlighting interest rate risk.
- Credit Risk: Credit risk reflects the issuer’s likelihood of default. Bonds with higher credit risk offer higher yields to compensate investors, and credit spreads measure this difference.
- Bond Ratings: Rating agencies like Moody’s and S&P assess the creditworthiness of issuers. Higher ratings indicate lower risk but come with lower yields.
- Corporate Yield Curves: Corporate yield curves show the relationship between yields and maturities, factoring in credit risk and market conditions. Steeper curves often indicate higher perceived long-term risk.
Exercises
Conceptual Questions
1. Bond Terminology
Explain the following terms: face value, coupon rate, yield to maturity, and maturity date. How do these terms impact an investor’s decision to purchase a bond?
2. Zero-Coupon Bond vs. Coupon Bond
Compare and contrast zero-coupon bonds with coupon bonds. What are the advantages and disadvantages of each from an investor’s perspective?
3. Credit Risk and Bond Ratings
How do credit ratings assigned by agencies like Moody’s or S&P affect the expected return on corporate bonds? Why might investors prefer higher-rated bonds even if they offer lower yields?
4. Interest Rate Changes and Bond Prices
Why do bond prices fall when interest rates rise? Explain this inverse relationship with a practical example.
Short Calculations
1. Pricing a Zero-Coupon Bond
A zero-coupon bond with a face value of $1,000 matures in 5 years. If the yield to maturity is 6%, calculate the price of the bond.
2. Yield to Maturity of a Zero-Coupon Bond
You purchase a zero-coupon bond for $750 with a face value of $1,000 and 10 years to maturity. Calculate the yield to maturity.
3. Pricing a Coupon Bond
A 10-year bond with a face value of $1,000 pays an annual coupon of 5%. If the market interest rate is 4%, calculate the price of the bond.
4. Current Yield of a Bond
A corporate bond has a face value of $1,000, a 6% annual coupon, and is currently priced at $950. What is its current yield?
Scenario-Based Problems
1. Bond Price Sensitivity to Interest Rate Changes
A 20-year bond with a face value of $1,000 has a coupon rate of 7%, paid annually.
- Calculate the bond’s price if the market interest rate is 6%.
- Recalculate the price if the market interest rate rises to 8%.
- Explain how duration affects the price changes.
2. Comparing Corporate Bonds with Different Ratings
Two corporate bonds are available for investment:
- Bond A: Rated AAA, 5-year maturity, 4% coupon, priced at par.
- Bond B: Rated BB, 5-year maturity, 6% coupon, priced at par.
- Calculate the annual income from each bond for a $10,000 investment.
- Discuss the risks and potential rewards of each investment.
3. Credit Spreads in a Crisis
During an economic downturn, the yield on 10-year Treasury bonds is 3%, while a corporate bond rated BBB has a yield of 5%.
- Calculate the credit spread.
- How might this spread change during a financial crisis? Discuss the implications for corporate bond investors.
Case Study: Corporate Bond Analysis During Economic Uncertainty
Scenario
A company issues a 10-year corporate bond with a face value of $1,000 and a 5% annual coupon. The bond is initially rated A by Moody’s. After two years, the company faces financial difficulties, leading to a downgrade to BBB.
Tasks:
- Calculate the price of the bond:
- At issuance, when the market rate for A-rated bonds is 4%.
- After the downgrade, assuming the market rate for BBB-rated bonds rises to 6%.
- Explain how the downgrade impacts the bondholder’s expected return and the price volatility of the bond.
- Discuss the bondholder’s options if they are concerned about further downgrades.
