7 Chapter 7 – Stock and Stock Valuation
Learning Objectives
- Understand the tradeoff between dividends and growth in stock valuation.
- Appreciate the limitations of valuing a stock based on expected dividends.
- Value a stock as the present value of the company’s total payout.
- Describe the basics of common stock, preferred stock, and stock quotes.
- Compare how trades are executed on the NYSE and Nasdaq.
- Value a stock as the present value of its expected future dividends.
7.1 Stock Basics
7.1.1 What is a Stock?
A stock is a financial security that represents ownership in a company. When you buy a stock, you become a shareholder, which gives you a claim on the company’s profits and assets. Companies issue stocks to raise money for operations, growth, or innovation. Stocks are also called equities or shares.
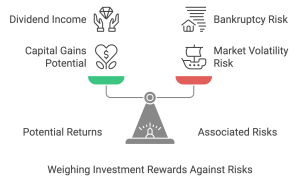
Owning stock provides two main benefits:
-
- Capital Appreciation: If the stock price rises over time, you can sell it for a profit.
- Dividends: Some companies share their profits with shareholders by paying regular dividends.
Example: Starbucks Ownership
Imagine you purchase 10 shares of Starbucks for $100 per share:
Initial Investment: $1,000 (10 × $100)
- If Starbucks’ stock price increases to $120 per share, your investment grows to $1,200 (10 × $120), giving you a $200 profit if sold.
- If Starbucks pays an annual dividend of $2 per share, you receive $20 in dividends (10 × $2), regardless of the stock price.
This combination of potential income and growth makes stocks appealing to investors.
7.1.2 Types of Stock
There are two primary types of stock: Common Stock and Preferred Stock.
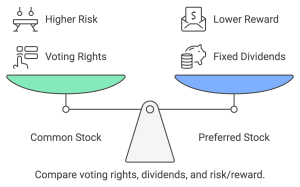
1. Common Stock
Represents ownership in a company.
-
- Voting Rights: Shareholders vote on critical issues, such as elec
ting directors. - Dividends: Paid at the company’s discretion and depe
nd on profitability. - Risks and Rewards: Common shareholders benefit from growth but are last in line for payouts during bankruptcy.
- Voting Rights: Shareholders vote on critical issues, such as elec
Example: Amazon Common Stock
Suppose you buy Amazon’s common stock. While Amazon doesn’t pay regular dividends, investors are drawn to its capital appreciation potential.
If you bought shares at $2,000 and the price rises to $3,500 over five years, your profit would be $1,500 per share—a 75% return.
2. Preferred Stock
A hybrid of debt and equity, offering features of both.
-
- No Voting Rights: Preferred shareholders usually don’t vote.
- Fixed Dividends: Provides consistent dividend payments before common stockholders.
- Priority in Bankruptcy: Paid before common stockholders but after bondholders.
Example: Bank of America Preferred Stock
Bank of America offers preferred stock with a 6% fixed dividend.
If the face value of the stock is $1,000, preferred shareholders earn $60 annually (6% × $1,000). This predictable income appeals to conservative investors.
7.1.3 Why Do Companies Issue Stock?
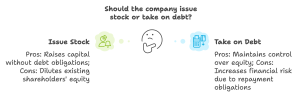
Companies issue stock to raise money without incurring debt. This funding helps them finance projects, expand operations, or make acquisitions. Issuing stock has two primary advantages:
-
- Avoiding Debt Payments: Unlike loans or bonds, stocks don’t require repayment or interest.
- Accessing More Capital: Companies can sell additional shares in the future if needed.
However, issuing stock also has drawbacks:
-
- Dilution of Ownership: Adding shares reduces the ownership percentage of existing shareholders.
- Profit Sharing: More shareholders mean the company shares profits with a larger group.
7.1.4 Why Do People Buy Stock?
Investors buy stocks for two main reasons: Dividends and Capital Gains.
1. Dividends
Some companies distribute profits as dividends, providing regular income. Dividend stocks are popular among retirees or income-focused investors.
Example: Coca-Cola Dividends
Coca-Cola pays an annual dividend of $1.80 per share. If you own 100 shares, you receive $180 annually (100 × $1.80).
2. Capital Gains
The primary goal for many investors is to profit from a stock’s price increase by buying low and selling high.
7.2 The Mechanics of Stock Trades
Buying and selling stocks involve specific processes and market structures that ensure trades are executed efficiently and securely. Stocks are typically traded on organized platforms known as stock exchanges or in less formal setups called over-the-counter (OTC) markets. Understanding these mechanisms helps investors navigate the complexities of the stock market.
7.2.1 Stock Exchanges
A stock exchange is a regulated marketplace where stocks are bought and sold. Exchanges ensure fair pricing, transparency, and liquidity for investors. Two of the most well-known stock exchanges are the New York Stock Exchange (NYSE) and the Nasdaq.
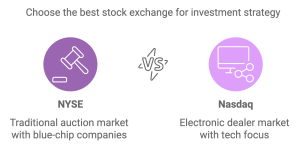
1. NYSE (New York Stock Exchange)
-
- The NYSE is one of the oldest and most prestigious stock exchanges.
- It operates as an auction market, where buyers and sellers meet directly or electronically to trade shares.
- Designated Market Makers (DMMs): Facilitate trades by matching buy and sell orders to ensure liquidity and fair pricing.
2. Nasdaq
-
- The Nasdaq is a fully electronic exchange.
- It operates as a dealer market, where market makers (dealers) provide liquidity by buying and selling stocks.
- Known for listing major technology companies like Apple and Microsoft, the Nasdaq is designed for high-speed and efficient trading.
7.2.2 How Trades Are Executed
Stock trades involve several steps, starting with an investor placing an order and ending with the trade being settled. Here’s how it works: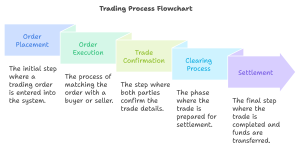
1. Placing the Order
-
- Investors use brokerage accounts to buy or sell stocks.
- Types of orders:
- Market Orders: Execute immediately at the current market price.
- Limit Orders: Specify the price at which you want to buy or sell.
- Stop Orders: Trigger a trade once the stock reaches a predetermined price.
2. Matching Buyers and Sellers
-
- Exchanges or market makers match buy orders with sell orders. For example, if one investor wants to buy 100 shares of Tesla, the system will match them with someone willing to sell 100 shares at the same price.
3. Executing the Trade
-
- Once matched, the trade is executed, and the stock ownership is transferred to the buyer.
4. Settlement
-
- Trades are typically settled within two business days (T+2). This means the buyer must pay, and the seller must deliver the shares within this time frame.
7.2.3 The Role of Brokers
Brokers act as intermediaries between investors and the stock market. They provide platforms and tools for trade execution and may charge fees or commissions for their services. Brokers are categorized as:
1. Full-Service Brokers
-
- Offer personalized investment advice and portfolio management.
- Higher fees, suitable for investors who prefer professional guidance.
2. Discount Brokers
-
- Focus on basic services like trade execution at a lower cost.
- Examples include Robinhood and E*TRADE, which often offer commission-free trading.
7.2.4 The Role of Technology
Advances in technology have transformed stock trading, making it faster and more accessible for everyone.
1. Online Trading Platforms
•Platforms like Robinhood, TD Ameritrade, and Fidelity allow investors to trade from their phones or computers.
2. Algorithmic Trading
•Computers use pre-programmed criteria to execute trades automatically, accounting for a large portion of daily trading volume.
3. Real-Time Data
•Investors now have access to real-time stock prices, market trends, and financial news, helping them make informed decisions.
7.3 The Dividend-Discount Model
The Dividend-Discount Model (DDM) is a fundamental approach to stock valuation that determines the value of a stock based on the present value of its expected future dividends. This model assumes that the value of a stock is derived entirely from the dividends it generates for its shareholders.
7.3.1 A One-Year Investor
Imagine an investor planning to hold a stock for only one year. During this time, the investor expects to earn:
-
- Dividend: Income from the company during the holding period.
- Sale Price: The price at which the investor sells the stock at the end of the year.
The stock’s price today (P₀) can be calculated using the formula:
$$P_0 = \frac{D_1 + P_1}{1 + r}$$
Where:
-
- P_0: Current stock price.
- D_1: Expected dividend at the end of the year.
- P_1: Expected price at the end of the year.
- r: Required rate of return (or discount rate).
Example: Calculating Stock Price for a One-Year Investor
Suppose a company is expected to pay a dividend of $2 per share at the end of the year, and the stock price is projected to be $55. If the required return is 10%, the current price is:
[latex]P_0 = \frac{2 + 55}{1.10} = \frac{57}{1.10} \approx 51.82[/latex]
Conclusion: The stock’s value today is approximately $51.82.
7.3.2 Dividend Yields, Capital Gains, and Total Returns
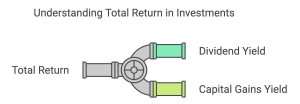
Stock returns are a combination of two components: dividend yield and capital gains yield. Together, these form the total return.
1. Dividend Yield
•The income generated from dividends as a percentage of the stock price.
$$\text{Dividend Yield} = \frac{D_1}{P_0}$$
2. Capital Gains Yield
•The percentage increase in the stock price over time.
$$\text{Capital Gains Yield} = \frac{P_1 - P_0}{P_0}$$
3. Total Return
•The sum of dividend yield and capital gains yield.
[latex]\text{Total Return} = \text{Dividend Yield} + \text{Capital Gains Yield}[/latex]
Example: Calculating Total Return
Using the earlier example:
• D_1 = 2, P_0 = 51.82, P_1 = 55.
1. Dividend Yield:
[latex]\text{Dividend Yield} = \frac{2}{51.82} \approx 3.86\%[/latex]
2. Capital Gains Yield:
[latex]\text{Capital Gains Yield} = \frac{55 - 51.82}{51.82} \approx 6.14\%[/latex]
3. Total Return:
[latex]\text{Total Return} = 3.86\% + 6.14\% = 10\%[/latex]
Conclusion: The total return matches the required return of 10%.
7.3.3 A Multiyear Investor
For an investor planning to hold the stock for several years, the stock’s value is the present value of all expected future dividends during the holding period, plus the present value of the sale price at the end.
The formula becomes:
$$P_0 = \frac{D_1}{(1 + r)^1} + \frac{D_2}{(1 + r)^2} + \dots + \frac{D_n + P_n}{(1 + r)^n}$$
Where:
-
- D_n: Dividend in year n.
- P_n: Stock price at the end of year n.
- r: Required rate of return.
Example: Two-Year Investor
Suppose a stock will pay dividends of $2 in Year 1 and $3 in Year 2, and the stock price at the end of Year 2 is expected to be $60. If the required return is 8%, the stock price today is:
$$P_0 = \frac{2}{1.08} + \frac{3 + 60}{(1.08)^2}$$
1. Present Value of Year 1 Dividend:
[latex]\frac{2}{1.08} \approx 1.85[/latex]
2. Present Value of Year 2 Cash Flow (Dividend + Sale Price):
$$\frac{3 + 60}{(1.08)^2} = \frac{63}{1.1664} \approx 54.04$$
3. Total Present Value:
[latex]P_0 = 1.85 + 54.04 = 55.89[/latex]
Conclusion: The stock is worth approximately $55.89 today.
7.3.4 Dividend-Discount Model Equation
The DDM simplifies multiyear valuation by assuming constant dividend growth. The formula is:
$$P_0 = \frac{D_1}{r - g}$$
Where:
-
- D_1: Dividend next year.
- r: Required rate of return.
- g: Constant dividend growth rate.
Example: Using the DDM Equation
Suppose a company expects to pay a dividend of $3 next year ([latex]D_1[/latex]), and dividends are expected to grow at a rate of 5% annually ([latex]g = 5\%[/latex]), with a required return of 10% ([latex]r = 10\%[/latex]).
[latex]P_0 = \frac{3}{0.10 - 0.05} = \frac{3}{0.05} = 60[/latex]
Conclusion: The stock is worth $60 based on the DDM.
7.4 Estimating Dividends in the Dividend-Discount Model
A key step in using the Dividend-Discount Model (DDM) is estimating future dividends. Dividends depend on a company’s profitability, growth strategy, and reinvestment decisions. This section explores scenarios for estimating dividends, from steady growth to varying growth rates, and their implications for stock valuation.
7.4.1 Constant Dividend Growth
The simplest assumption is constant dividend growth, where dividends increase at a fixed rate (g) indefinitely. This allows for straightforward calculations using the formula:
$$P_0 = \frac{D_1}{r - g}$$
Where:
-
- D_1: Dividend next year.
- r: Required rate of return.
- g: Constant growth rate.
Example: Calculating Stock Price with Constant Dividend Growth
Suppose a company pays a dividend of $4 this year ([latex]D_0[/latex]) and expects dividends to grow at 6% annually ([latex]g = 6\%[/latex]). The required return is 10% ([latex]r = 10\%[/latex]).
1.Step 1: Calculate next year’s dividend (D_1):
[latex]D_1 = D_0 \times (1 + g) = 4 \times (1.06) = 4.24[/latex]
2.Step 2: Use the DDM formula to calculate the stock price:
[latex]P_0 = \frac{4.24}{0.10 - 0.06} = \frac{4.24}{0.04} = 106[/latex]
Conclusion: The stock is valued at $106 based on the constant growth DDM.
7.4.2 Dividends Versus Investment and Growth
A company’s dividend policy depends on its investment opportunities and growth strategy. Firms with abundant profitable projects may reinvest earnings instead of paying dividends, leading to higher growth and stock value over time.
Example: Impact of Reinvestment on Dividends
Consider two companies, both earning $10 per share:
-
- Company A pays all its earnings as dividends.
- Company B retains 50% of its earnings and reinvests at a return on equity (ROE) of 12%.
For Company B, the growth rate (g) is given by:
[latex]g = \text{Retention Ratio} \times ROE = 0.50 \times 0.12 = 0.06 \, \text{(6\%)}[/latex]
Over time, Company B’s reinvestment fuels growth, increasing the stock’s value, even though its dividend payments may initially be smaller than Company A’s.
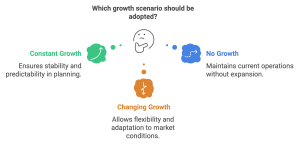
7.4.3 Changing Growth Rates
In reality, companies rarely grow at a constant rate forever. Growth often occurs in stages:
-
- High growth during expansion phases.
- Stable growth in mature phases.
To account for this, the DDM can be modified for changing growth rates, such as an initial high growth rate ([latex]g_1[/latex]) followed by a perpetual growth rate ([latex]g_2[/latex]).
Example: Two-Stage Dividend Growth Model
A company pays a dividend of $2 per share this year ([latex]D_0[/latex]). Dividends are expected to grow at 10% annually for 3 years ([latex]g_1 = 10\%[/latex]) and then at 4% indefinitely ([latex]g_2 = 4\%[/latex]). The required return is 8% ([latex]r = 8\%[/latex]).
Step 1: Calculate dividends for the first 3 years ([latex]D_1[/latex], [latex]D_2[/latex], [latex]D_3[/latex]):
[latex]D_1 = D_0 \times (1 + g_1) = 2 \times 1.10 = 2.20[/latex]
[latex]D_2 = D_1 \times (1 + g_1) = 2.20 \times 1.10 = 2.42[/latex]
[latex]D_3 = D_2 \times (1 + g_1) = 2.42 \times 1.10 = 2.66[/latex]
Step 2: Calculate the terminal value ([latex]P_3[/latex]):
$$P_3 = \frac{D_4}{r - g_2} = \frac{D_3 \times (1 + g_2)}{r - g_2} = \frac{2.66 \times 1.04}{0.08 - 0.04} = \frac{2.77}{0.04} = 69.25$$
Step 3: Discount dividends and [latex]P_3[/latex] to the present:
$$P_0 = \frac{2.20}{(1.08)^1} + \frac{2.42}{(1.08)^2} + \frac{2.66}{(1.08)^3} + \frac{69.25}{(1.08)^3}$$
Breaking it down:
[latex]\frac{2.20}{1.08} \approx 2.04[/latex]
[latex]\frac{2.42}{1.1664} \approx 2.08[/latex]
[latex]\frac{2.66}{1.2597} \approx 2.11[/latex]
[latex]\frac{69.25}{1.2597} \approx 54.96[/latex]
Adding these together:
[latex]P_0 = 2.04 + 2.08 + 2.11 + 54.96 = 61.19[/latex]
Conclusion: The stock’s value today is approximately $61.19.
7.4.4 Value Drivers and the Dividend-Discount Model
The DDM highlights two main drivers of stock value:
-
- Growth Rate (g): Higher growth rates increase stock value.
- Required Return (r): Higher required returns lower stock value, reflecting increased risk.
Example: Sensitivity Analysis of g and r
Consider a stock with [latex]D_1[/latex] = 3:
1. If [latex]r = 10\%[/latex]and [latex]g = 4\%[/latex]:
[latex]P_0 = \frac{3}{0.10 - 0.04} = 50[/latex]
2. If g increases to 5%:
[latex]P_0 = \frac{3}{0.10 - 0.05} = 60[/latex]
3. If r increases to 12% while g = [latex]4\%[/latex]:
[latex]P_0 = \frac{3}{0.12 - 0.04} = 37.50[/latex]
Conclusion: Stock prices are highly sensitive to changes in growth expectations and required returns.
7.4.5 Sustainable Growth Rate (g)
The sustainable growth rate (g) represents how fast a company can grow its earnings while maintaining its current return on equity (ROE) and payout ratio. It’s a crucial concept for stock valuation because it shows how much a company can grow without needing external financing. Investors use the sustainable growth rate to estimate future dividends and stock prices in models like the Dividend-Discount Model (DDM).
The formula for calculating the sustainable growth rate is:
g = ROE × Retention Ratio
Where:
-
- ROE is the Return on Equity.
- Retention Ratio is the percentage of earnings a company keeps (1 - Payout Ratio).
The payout ratio is the percentage of earnings paid out as dividends. The retention ratio is the remaining portion of earnings retained for reinvestment in the business.
Example: Calculating the Sustainable Growth Rate
Let’s say a company has an ROE of 12%, and it pays out 40% of its earnings as dividends. The retention ratio is 60%.
g = 12% × 60% = 7.2%
This means the company can grow its earnings at 7.2% per year without needing external funding.
Why is the Sustainable Growth Rate Important?
The sustainable growth rate is important for estimating future stock prices and determining if a company’s growth expectations are realistic. If a company’s actual growth rate is higher than the sustainable growth rate, it may need to issue more debt or equity to maintain that growth, which could impact its stock price.
Applying the Sustainable Growth Rate in Stock Valuation
In the Gordon Growth Model (Dividend-Discount Model), the sustainable growth rate is used to estimate the future growth of dividends. For example, if a company is expected to grow at a sustainable rate of 7%, and its required return is 10%, the stock price can be calculated as:
Price = Dividend Next Year / (Required Return - g)
If the company plans to pay a $4 dividend next year:
Price = 4 / (0.10 - 0.07) = $133.33
This shows how the sustainable growth rate directly influences stock valuation.
Key Takeaways:
-
- The sustainable growth rate shows how fast a company can grow earnings using internal resources.
- It depends on the company’s ROE and how much of its earnings are reinvested (retention ratio).
- The sustainable growth rate is essential for stock valuation models like the Gordon Growth Model.
7.5 Limitations of the Dividend-Discount Model
While the Dividend-Discount Model (DDM) is a foundational tool for stock valuation, it has limitations that make it challenging to apply in real-world scenarios. These limitations arise primarily from assumptions about future dividends and the applicability of the model to all types of stocks.
7.5.1 Uncertain Dividend Forecasts
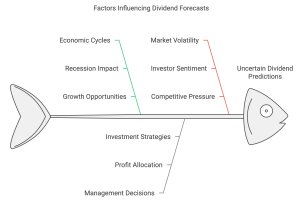
The DDM relies on accurate forecasts of future dividends and growth rates, which can be difficult to predict due to various factors:
1. Economic Cycles
Companies may reduce or eliminate dividends during economic downturns to preserve cash. For instance, many firms suspended dividends during the 2020 pandemic.
2. Management Decisions
Dividend policies are subject to change based on company strategies. A firm may prioritize reinvestment over payouts, even if it remains profitable.
3. Volatility in Growth Rates
Predicting a constant growth rate is often unrealistic due to market conditions, competition, and internal challenges.
Example: Impact of Uncertain Forecasts
Consider a company currently paying a dividend of $3 with a historical growth rate of 6%. If economic conditions reduce the growth rate to 2%, the valuation changes significantly:
1. Original Assumptions:
[latex]P_0 = \frac{3 \times (1 + 0.06)}{0.10 - 0.06} = \frac{3.18}{0.04} = 79.50[/latex]
2. Revised Growth Rate:
[latex]P_0 = \frac{3 \times (1 + 0.02)}{0.10 - 0.02} = \frac{3.06}{0.08} = 38.25[/latex]
Conclusion: A small change in the growth rate leads to a dramatic drop in valuation, highlighting the DDM’s sensitivity to assumptions.
7.5.2 Non-Dividend-Paying Stocks
The DDM cannot be applied directly to companies that do not pay dividends, such as many in the technology and growth sectors, which reinvest earnings for expansion.
1. Growth Companies
Companies like Tesla and Amazon focus on reinvestment over dividends, relying on cash flow and profitability for valuation.
2. Alternative Valuation Methods
For non-dividend-paying stocks, models like the Discounted Cash Flow (DCF) method or Price-to-Earnings (P/E) ratios are more suitable.
Example: Non-Dividend-Paying Stock
Consider Amazon, which does not pay dividends. Instead, its valuation is driven by expected cash flows and market expectations of growth. If investors relied solely on the DDM, Amazon’s value would appear to be $0, which does not reflect its true worth.
Summary
The DDM provides a simple framework for valuing dividend-paying stocks, but it is not universally applicable. Investors should recognize its limitations and use complementary valuation methods for non-dividend-paying companies or those with unpredictable dividend policies.
7.6 Share Repurchases and the Total Payout Model
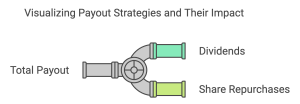
The Total Payout Model determines the stock price based on the total cash distributed to shareholders through dividends and repurchases. The formula is:
[latex]P_0 = \frac{\text{Total Payout}}{r - g}[/latex]
Where:
-
- [latex]P_0[/latex] = Current stock price
- Total Payout = Total cash returned to shareholders (dividends + share repurchases)
- r = Required rate of return
- g = Growth rate of total payout
By dividing the total equity value by the number of outstanding shares, the model provides the stock price.
Example: Valuing a Company Using the Total Payout Model
A company expects to pay $2 million in dividends next year and plans to repurchase $1 million worth of shares. The total payout is expected to grow at 4% annually ([latex]g = 4\%[/latex]), and the required return is 10% ([latex]r = 10\%[/latex]). The company has 500,000 shares outstanding.
1. Calculate the Total Payout
[latex]\text{Total Payout} = \text{Dividends Paid} + \text{Share Repurchases} = 2,000,000 + 1,000,000 = 3,000,000[/latex]
2. Calculate the Equity Value Using the Total Payout Model
\text{Equity Value} = \frac{\text{Total Payout}}{r - g} = \frac{3,000,000}{0.10 - 0.04} = \frac{3,000,000}{0.06} = 50,000,000
3. Determine the Price Per Share
Divide the equity value by the number of shares outstanding:
[latex]P_0 = \frac{50,000,000}{500,000} = 100[/latex]
Conclusion: The stock is valued at $100 per share based on the Total Payout Model.
Summary
The Total Payout Model extends the Dividend-Discount Model by including share repurchases, offering a more comprehensive approach to valuing companies that distribute cash in multiple ways. This method highlights how both dividends and repurchases contribute to shareholder value.
7.7 Putting It All Together
Stock valuation is a fundamental skill for investors, enabling them to assess the intrinsic value of a company’s shares and make informed decisions. This section synthesizes the concepts and models covered in the chapter, using a comprehensive example to illustrate their application.
Case Study: Valuing BrightFuture Tech, Inc.
BrightFuture Tech, Inc. is a fast-growing technology company known for consistent dividend payments and occasional share repurchases. Analysts want to determine whether its stock is a good investment based on its current price of $120 per share.
Step 1: Basic Company Information
BrightFuture currently pays an annual dividend of $3 per share, expects dividend growth of 6% per year, and plans to repurchase $30 million worth of shares next year. The company has 20 million shares outstanding. Analysts estimate a required return (r) of 9%.
Step 2: Using the Dividend-Discount Model (DDM)
The constant growth DDM provides a starting point for valuation. Using the formula:
$$P_0 = \frac{D_1}{r - g}$$
1. Calculate Next Year’s Dividend (D_1)
$$D_1 = D_0 \times (1 + g) = 3 \times (1 + 0.06) = 3.18$$
2. Calculate the Stock Price
[latex]P_0 = \frac{3.18}{0.09 - 0.06} = \frac{3.18}{0.03} = 106[/latex]
Conclusion: Based solely on the DDM, BrightFuture’s stock appears overvalued at $120.
Step 3: Incorporating Share Repurchases with the Total Payout Model
BrightFuture also returns value to shareholders through share repurchases, which the DDM does not account for. The Total Payout Model adjusts for this additional payout.
1. Calculate the Total Payout
[latex]\text{Total Payout} = \text{Dividends Paid} + \text{Share Repurchases}[/latex]
Dividends Paid:
[latex]3 \times 20,000,000 = 60,000,000[/latex]
Total Payout:
60,000,000 + 30,000,000 = 90,000,000
2. Calculate the Equity Value
[latex]\text{Equity Value} = \frac{\text{Total Payout}}{r - g} = \frac{90,000,000}{0.09 - 0.06} = \frac{90,000,000}{0.03} = 3,000,000,000[/latex]
3. Determine the Price Per Share
Divide the equity value by the number of shares outstanding:
[latex]P_0 = \frac{3,000,000,000}{20,000,000} = 150[/latex]
Conclusion: Incorporating share repurchases, the Total Payout Model suggests BrightFuture’s stock is undervalued at $120, with an intrinsic value of $150.
Step 4: Evaluating the Limitations
While the DDM and Total Payout Model provide valuable insights, they rely on assumptions about growth rates and required returns. Additionally, BrightFuture’s valuation may be influenced by external factors such as market sentiment and industry trends, which these models do not capture.
Final Decision
BrightFuture’s stock appears undervalued when considering both dividends and share repurchases. Investors may see this as an opportunity to invest, provided they remain mindful of the assumptions and limitations in these models.
Key Takeaways
- Stock Valuation Models: The Dividend-Discount Model (DDM) and Total Payout Model are essential tools for estimating a stock’s intrinsic value, each offering unique insights depending on the company’s payout structure.
- Growth and Dividends: A stock’s value is highly sensitive to dividend forecasts and growth assumptions, emphasizing the need for accurate projections.
- Share Repurchases: Incorporating share buybacks through the Total Payout Model provides a more comprehensive understanding of shareholder returns, particularly for companies that use both dividends and repurchases.
- Model Limitations: Valuation models like the DDM are less effective for non-dividend-paying stocks or companies with unpredictable dividend policies, requiring alternative approaches.
- Market Dynamics: Stock prices may deviate from intrinsic values due to external factors like market sentiment, economic trends, or industry-specific developments.
- Informed Decisions: Combining multiple valuation methods allows investors to cross-validate results, enhancing decision-making while recognizing the limitations inherent in each model.
Exercises
Conceptual Questions
-
- What is the difference between common stock and preferred stock? Provide an example of when an investor might prefer each type.
- Why is the dividend-discount model (DDM) less effective for valuing companies that do not pay dividends?
- How do share repurchases impact the value of remaining shares?
- Explain why higher growth rates (g) in dividends lead to higher stock prices, assuming all other factors remain constant.
- Describe the difference between the NYSE and Nasdaq in terms of how trades are executed.
Short Calculations
-
- A company’s stock is priced at $40 per share. It pays an annual dividend of $2 per share, and the stock price is expected to increase to $44 in one year.
- What is the dividend yield?
- What is the capital gains yield?
- What is the total return?
- A company expects to pay a dividend of $5 next year, with dividends growing at 4% annually. The required rate of return is 10%. What is the stock’s current price based on the Dividend-Discount Model?
- A company has 1,000,000 shares outstanding, expects to pay $2 million in dividends next year, and plans to repurchase $500,000 worth of shares. The required return is 8%, and the growth rate of the total payout is 4%. What is the price per share using the Total Payout Model?
- A company’s stock is priced at $40 per share. It pays an annual dividend of $2 per share, and the stock price is expected to increase to $44 in one year.
Scenario-Based Problems
-
- An investor is deciding between two stocks: Stock A pays a consistent dividend of $3 per share annually, while Stock B reinvests all earnings into growth opportunities. Over five years, Stock A’s dividend yield is expected to remain at 6%, while Stock B’s price is projected to grow at an annualized rate of 9%. Based on total return, which stock should the investor choose, assuming equal risk?
- A company currently pays an annual dividend of $4 per share, growing at a rate of 10% annually for the next three years, after which it will grow at a perpetual rate of 4%. The required return is 9%. Calculate the stock price today using a two-stage Dividend-Discount Model.
Interactive Challenge
You are evaluating two companies:
-
- Company X pays a current dividend of $2.50 per share and is expected to grow dividends at 5% annually. The required rate of return is 8%.
- Company Y does not pay dividends but plans to repurchase $1 million in shares next year. Its total payout is expected to grow at 6%, and it has 500,000 shares outstanding. The required return is 10%.
Tasks
-
- Calculate the price of Company X’s stock using the Dividend-Discount Model.
- Calculate the price of Company Y’s stock using the Total Payout Model.
- Which stock is a better investment based on the valuation?
