18
Tobias Luthe, University of Applied Sciences HTW Chur, and Jan Silberberger, ETH Zurich, Switzerland
Towards an integrative sustainability assessment approach
Sustainability assessment (SA) in urban areas requires the measurement of economic, ecological and social parameters in order to engage stakeholders and to develop policy implementations. A number of approaches have been developed and implemented to assess sustainability. These are measuring either a larger number of independent multi-criteria indicators, attempting to assess detailed economic, social and ecological data; or they calculate composite indicators, attempting to measure the systemic effects in the interplay of economic, social and ecological data aggregated into one figure. However, any urban sustainability assessment tool needs to provide both detailed and relevant information for policy makers, and understandable and motivating information for inhabitants, businesses, visitors and other stakeholders, who are needed to support sustainable development with their taxes, votes and actions. A joint ‚currency’ is missing that is capable of reducing the complexity of SA and that allows for better stakeholder communication, though still provides sufficiently detailed information for policy makers.
How to measure something that is complex, dynamic, uncertain, and highly subjective?
The integration of an individual ‘understanding’ or ‘mental model’ of sustainability (Luthe and Wyss, 2015) is of high importance for an integrative assessment approach, because the transition towards a sustainable society is based on behavioural change of the relevant stakeholders. Although authors in sustainability assessment increasingly recognize the importance of stakeholder values and perspectives for the success of integrated sustainability assessment processes, the unravelling of how an individual understanding or mental model can inform the selection and development of appropriate sustainability assessment tools remains a research challenge (Gasparatos and Scolobig, 2012).
At the end, it is a human decision what balance between ecological, social and economic aspects is supported. We thus need to engage stakeholders and provide them with the necessary baseline of quantification for their opinion building process.
The CERCLE multicriteria assessment tool
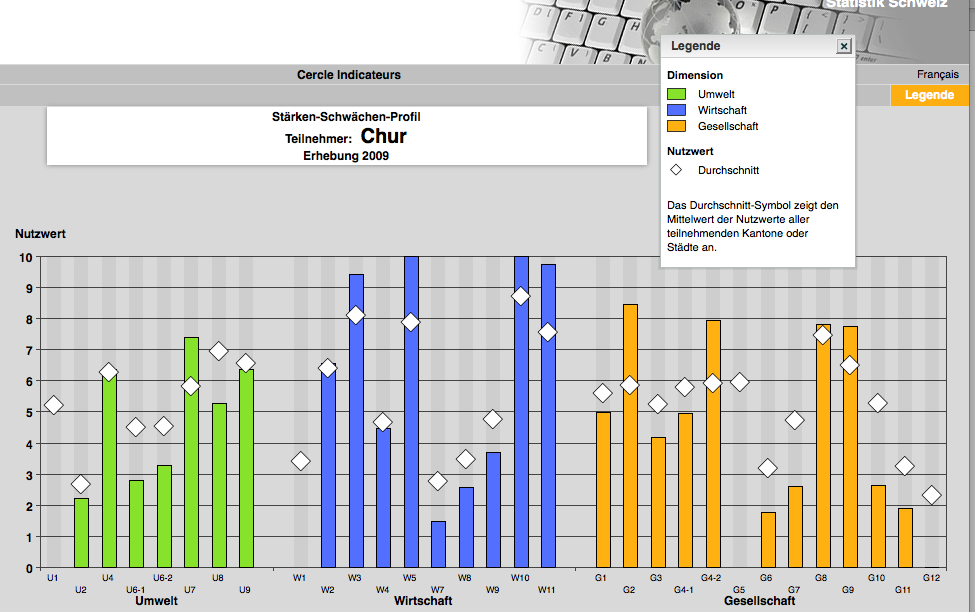
The CERCLE sustainability indicators have been developed for Swiss cantons and communities in the years 2003-2005. Currently there are twenty cantons and eighteen municipalities participating in their assessment. The CERCLE consist of 30 indicators measuring economic, social and ecological aspects. The results are visualized and communicated online, but not targeting the public (figure 1); it rather is a tool to inform policy. Single (multi-criteria) indicator approaches have been most commonly applied in assessing sustainability in urban areas, and a major lack of such tools is that the resulting list of rather independent parameters cannot reflect their interaction in a systems understanding (figure 1).

The Ecological Footprint for cities
The Ecological Footprint (EF) as another quantitative approach is a composite indicator that sets the needed and locally available, biocapacity-based resources into relation to the ecosystem capacity to assimilate the residuals of human consumption and re-introduce them into the biosphere. The EF calculation is partly based on economic consumption data and results in one single parameter of global hectares (Gha), an internationally used and comparable single unit in SA. The footprint may have advantages in accessibility and applicability, as well as in reducing complexity of SA, but may loose on accuracy because of many implied simplifications – social aspects are e.g. completely ignored. Data needed for calculation of the EF is based on country and regional data in the areas of household expenditure, price differentials, energy mix and its production, CO2 emission of industry and household, land use, and yields out of land use.
The experiment – applying both measurement approaches to the City of Chur
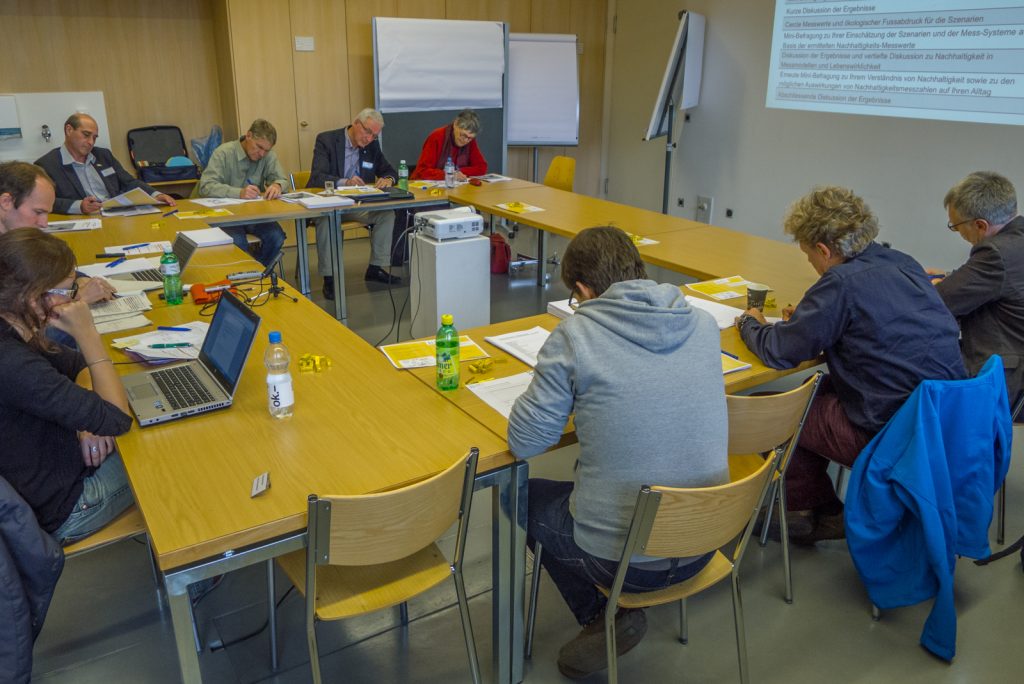
Chur is an Alpine town in Switzerland of about 40’000 inhabitants. We calculated the EF for its status quo (2012) as well as for two development scenarios (this is the first time that the EF has been measured for such a small city) and present the results together with the CERCLE multi-criteria indicator set for 2009 as well as for the calculated scenarios in participative stakeholder workshops. Both approaches are compared given their technical applicability and feasibility, their accuracy, and their capability to communicate and translate results into policy strategies in an underlying reflexive process. As part of this comparison, both quantitative results were visualized and presented via flipchart and video beamer in order to test individual and collective understandings of the different approaches.

Results
Technical feasibility and applicability
In calculating the indicators we experienced some barriers for measuring sustainability in communities. It was difficult to find a city as a partner in developing sustainability assessment tools. Officials found it delicate to engage in public discussions on sustainability. Municipalities were internally not willing to dedicate resources to assessing such data, and often were neither ready to integrate sustainability assessment tools in the administration, nor to involve the public and communicate sustainability at all. Most municipalities we spoke to were not satisfied with internal (costs/efforts) and external applicability (complexity), which is the main reason why Chur did not participate anymore in the CERCLE indicators after their last assessment in 2009. Astonishing enough, there was no evaluation process from the Swiss authorities nor the cities in place to monitor the success and the application of the CERCLE in practice.
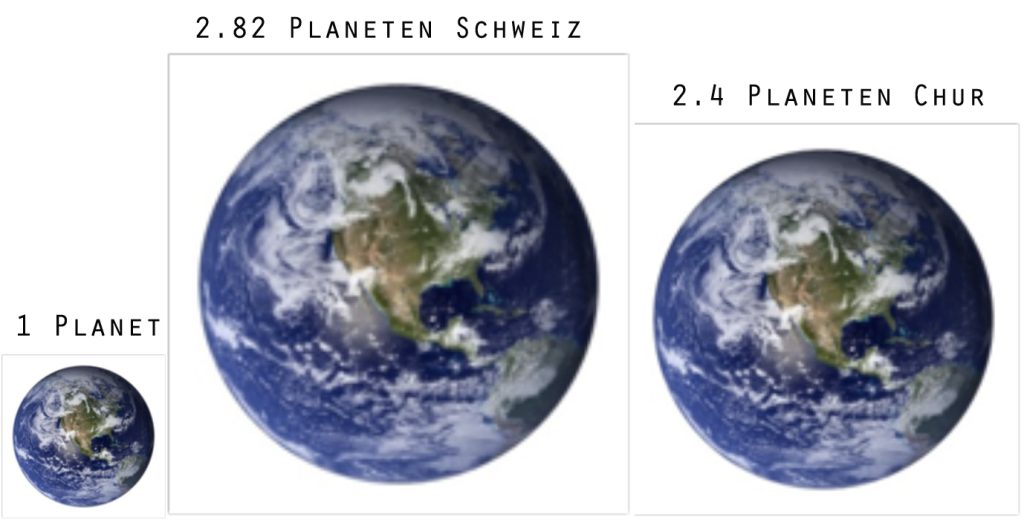
The EF of Chur is with 4.31 gha/person lower than the one for Switzerland with 5.01 gha/person (figures 3 and 4). The main differences origin from the carbon intensity of the energy production (about 50% nuclear, 50% hydro in Chur in comparison to roughly 25% petroleum based, 25% nuclear, 10% gas, 10% hydro, and 30% other in Switzerland). The energy consumption data is mostly expressed in the household sector. The results translate in the number of 2.82 planets needed if everyone on earth lived like the Swiss average, while 2.4 planets were needed if everyone lived like Chur’s inhabitants.
Overall, the EF proved to be tricky to calculate. For Switzerland, the Swiss Federal Statistical Office (FSO) is a source where most of the required data for the whole country is available. Required EF data for a smaller entity (such as a small town) needs significant detail and is therefore not available at FSO (so that the amount of working hours needed by one person were about 100 h, including internet research, telephone calls and mail shots). Many assumptions needed to be done due to a lack of regional or local data. However, the difference to the national EF of Switzerland is relevant and explainable (figure 3).

Findings from the workshops
Statements like “if you want to look at economic or social aspects”, “we have to consider a variety of aspects” and “sustainability is a rather multifaceted concept, which we should not reduce to consumption of resources” indicate that the focus group debaters see the EF as a SA system, which equals sustainability with consumption of resources and therefore as not sufficient to address the concept of sustainability as a whole. In this respect debaters often use CERCLE indicators to contrast and to clarify the one-dimensional character of ecological footprint.
Furthermore, comments such as “compares apples and oranges”, “weighting these indicators, that’s highly subjective”, “displaying all those indicators in the same way is simply wrong” and “CERCLE doesn’t show any interconnections” point to the fact that focus group debaters view CERCLE indicators as suitable to stimulate discussion about sustainability but as insufficient when it comes to mapping sustainability. This insufficiency, according to focus group debaters, arises from the fact that CERCLE treats all its indicators as isolated, independent components not considering whether a certain component has no relations to other components or whether it is closely related to others.

As for communicability of results, focus group debaters point out that the EF visualisations using the globe (see figure 5) are rather “appealing”, “work perfectly from an advertising point of view” or can be considered “an ideal way of communicating to people of all educational classes”. This does not surprise as the founders of the EF highlight that their system captivates with its “intuitive comprehensibility”. However, other comments “black box” and “conceal things” and in particular “potential danger in using these globe-visualizations” and “they might make us share a very incomplete perspective on sustainability” indicate that this “advertising appeal” is deemed critical among certain focus group participants. Some statements point to the perception that while CERCLE indicators may raise awareness that sustainability “should not be reduced to consumption of resources”, the ecological footprint visualisation may do the opposite. Similar to advertisements that usually provide a rather narrow perspective on the respective product, the ecological footprint visualisations are said to be creating a perspective on sustainability, which neglects all aspects we usually address as “social” (e.g., “health”, “equal opportunities”, “working conditions”).

Interestingly, one workshop participant argued that the visualisations we used as stimulus material are to be considered mere illustrations, that is, visual representations of terminated considerations and not findings of a query run by means of the SA systems and – consequently – asked for an instrument, which may show and assess consequences regarding different urban design scenarios. Another comment addressed one of the main problems of urban planning tools: where to set the system boundaries? Some debaters argued that using the EF (as well as CERCLE indicators) in urban planning may lead to inadequate solutions. Several participants underlined the importance of being aware of the specifics of certain places and taking these into consideration. As an example one participant put forward that the factors used by the ecological footprint, i.e. the consumption of drinking water, should be adapted to the location, which is assessed – as for instance Chur ‘drowns in drinking water’.
Summary
Results indicate that the composite indicator EF is better equipped to interest, motivate and engage stakeholders, while the multi-criteria set CERCLE is needed for planning detailed action. Results suggest the combination of both tools for sustainability assessment and for participative scenario planning in urban areas.
Both types of quantitative approaches do not integrate the individual and collective ‘understandings’ of (urban) sustainability, however. This needs to be seen as mandatory for an integrative assessment tool, because the population of a town or a region needs to participate and support innovation and policy changes for more sustainable development, and be willing to change its (consumption) behaviour. The combination of a quantitative measure with a qualitative participatory feedback loop maybe needed in order to enable integrative SA. Also, a quantifiable benchmark of what is sustainable, at least in an ecosystem services context, is lacking in most tools. The EF may provide a good basis here but it possibly needs to be combined with a social composite indicator, like the Happy Planet Index (HPI).
References
Gasparatosa,A. and A. Scolobig (2012). Choosing the most appropriate sustainability assessment tool. Ecological Economics 80:1-7.
Luthe, T. and R. Wyss (2015). The Capacity of Social-Ecological Systems for Planning Resilience: Introducing Adaptive Waves. Sustainability Science. Online first DOI: 10.1007/s11625-015-0316-6.
Author biographies
 Tobias Luthe is Professor for Sustainability Science at the University of Applied Sciences Chur, Switzerland, and a Visiting Professor in Sustainability Leadership and Management, University of Freiburg, Centre for Key Qualifications, Germany. Tobias holds a PhD in Environmental Sciences, a M.A. in Education on Sustainability, and a M.Sc.and a B.Sc. in Forest Sciences and Environmental Economics. With a background both in the natural and the social sciences, his major research interests as a sustainability scientist are related to the interaction of humans and the environment in a systems understanding – everything is connected to everything. More specific, he is interested in sustainable development from a theoretical and an applied perspective in a trandisciplinary understanding, creatively combining established quantitative and qualitative methods. His research focuses on not focusing on one discipline, instead following a trans- and mulitdisciplinary approach on developing a deeper understanding for interrelations within socio-economic-ecological systems. Methods are drawn from complexity research to ecological economics to social ecology and industrial ecology. He has a strong interest in the spatial aspects of human-environment relations, including fieldwork and embedded case studies; geographical foci are the Arctic and mountain environments; applied areas are tourism and natural resources management. Contact website: www.tobiasluthe.de.
 Jan Silberberger is a Post-Doc researcher at ETH Wohnforum – ETH CASE (Centre for Research on Architecture, Society & the Built Environment), Department of Architecture, ETH Zurich, Switzerland. He has studied Architecture and Urban Planning at the University of Stuttgart/Germany and Visual Communication and Fine Arts at the Hochschule fuer bildende Kuenste in Hamburg, Germany. Between 2008 and 2011 he did a PhD at the University of Fribourg’s Geography Unit investigating decision-making within jury boards of architectural competitions. His current research focuses on the circulation of quality within planning processes.
Contact email: silberberger@arch.ethz.ch
