15 Community Data Sources
“How can you tell our story if you don’t know it? Who do you really think that we are, when you can only tell the story of our deficits and not our assets? When you can only seek to fix us rather than build with us?”
The second stage of the systems thinking community change process includes clarifying the current reality at all levels of the ‘iceberg.’ Before you begin this process, however, it is critical to remember that the current reality needs to be viewed through multiple lenses. This means identifying various experiences of the current reality—including seeing strengths.
This can be accomplished in a few different steps using various types of data while applying systemic thinking as shown in the iceberg graphic. Applying systemic thinking is accomplished in several steps and uses multiple types of data. See the iceberg graphic as an analogy. Remember, our goal is to examine the current reality by examining four levels of information: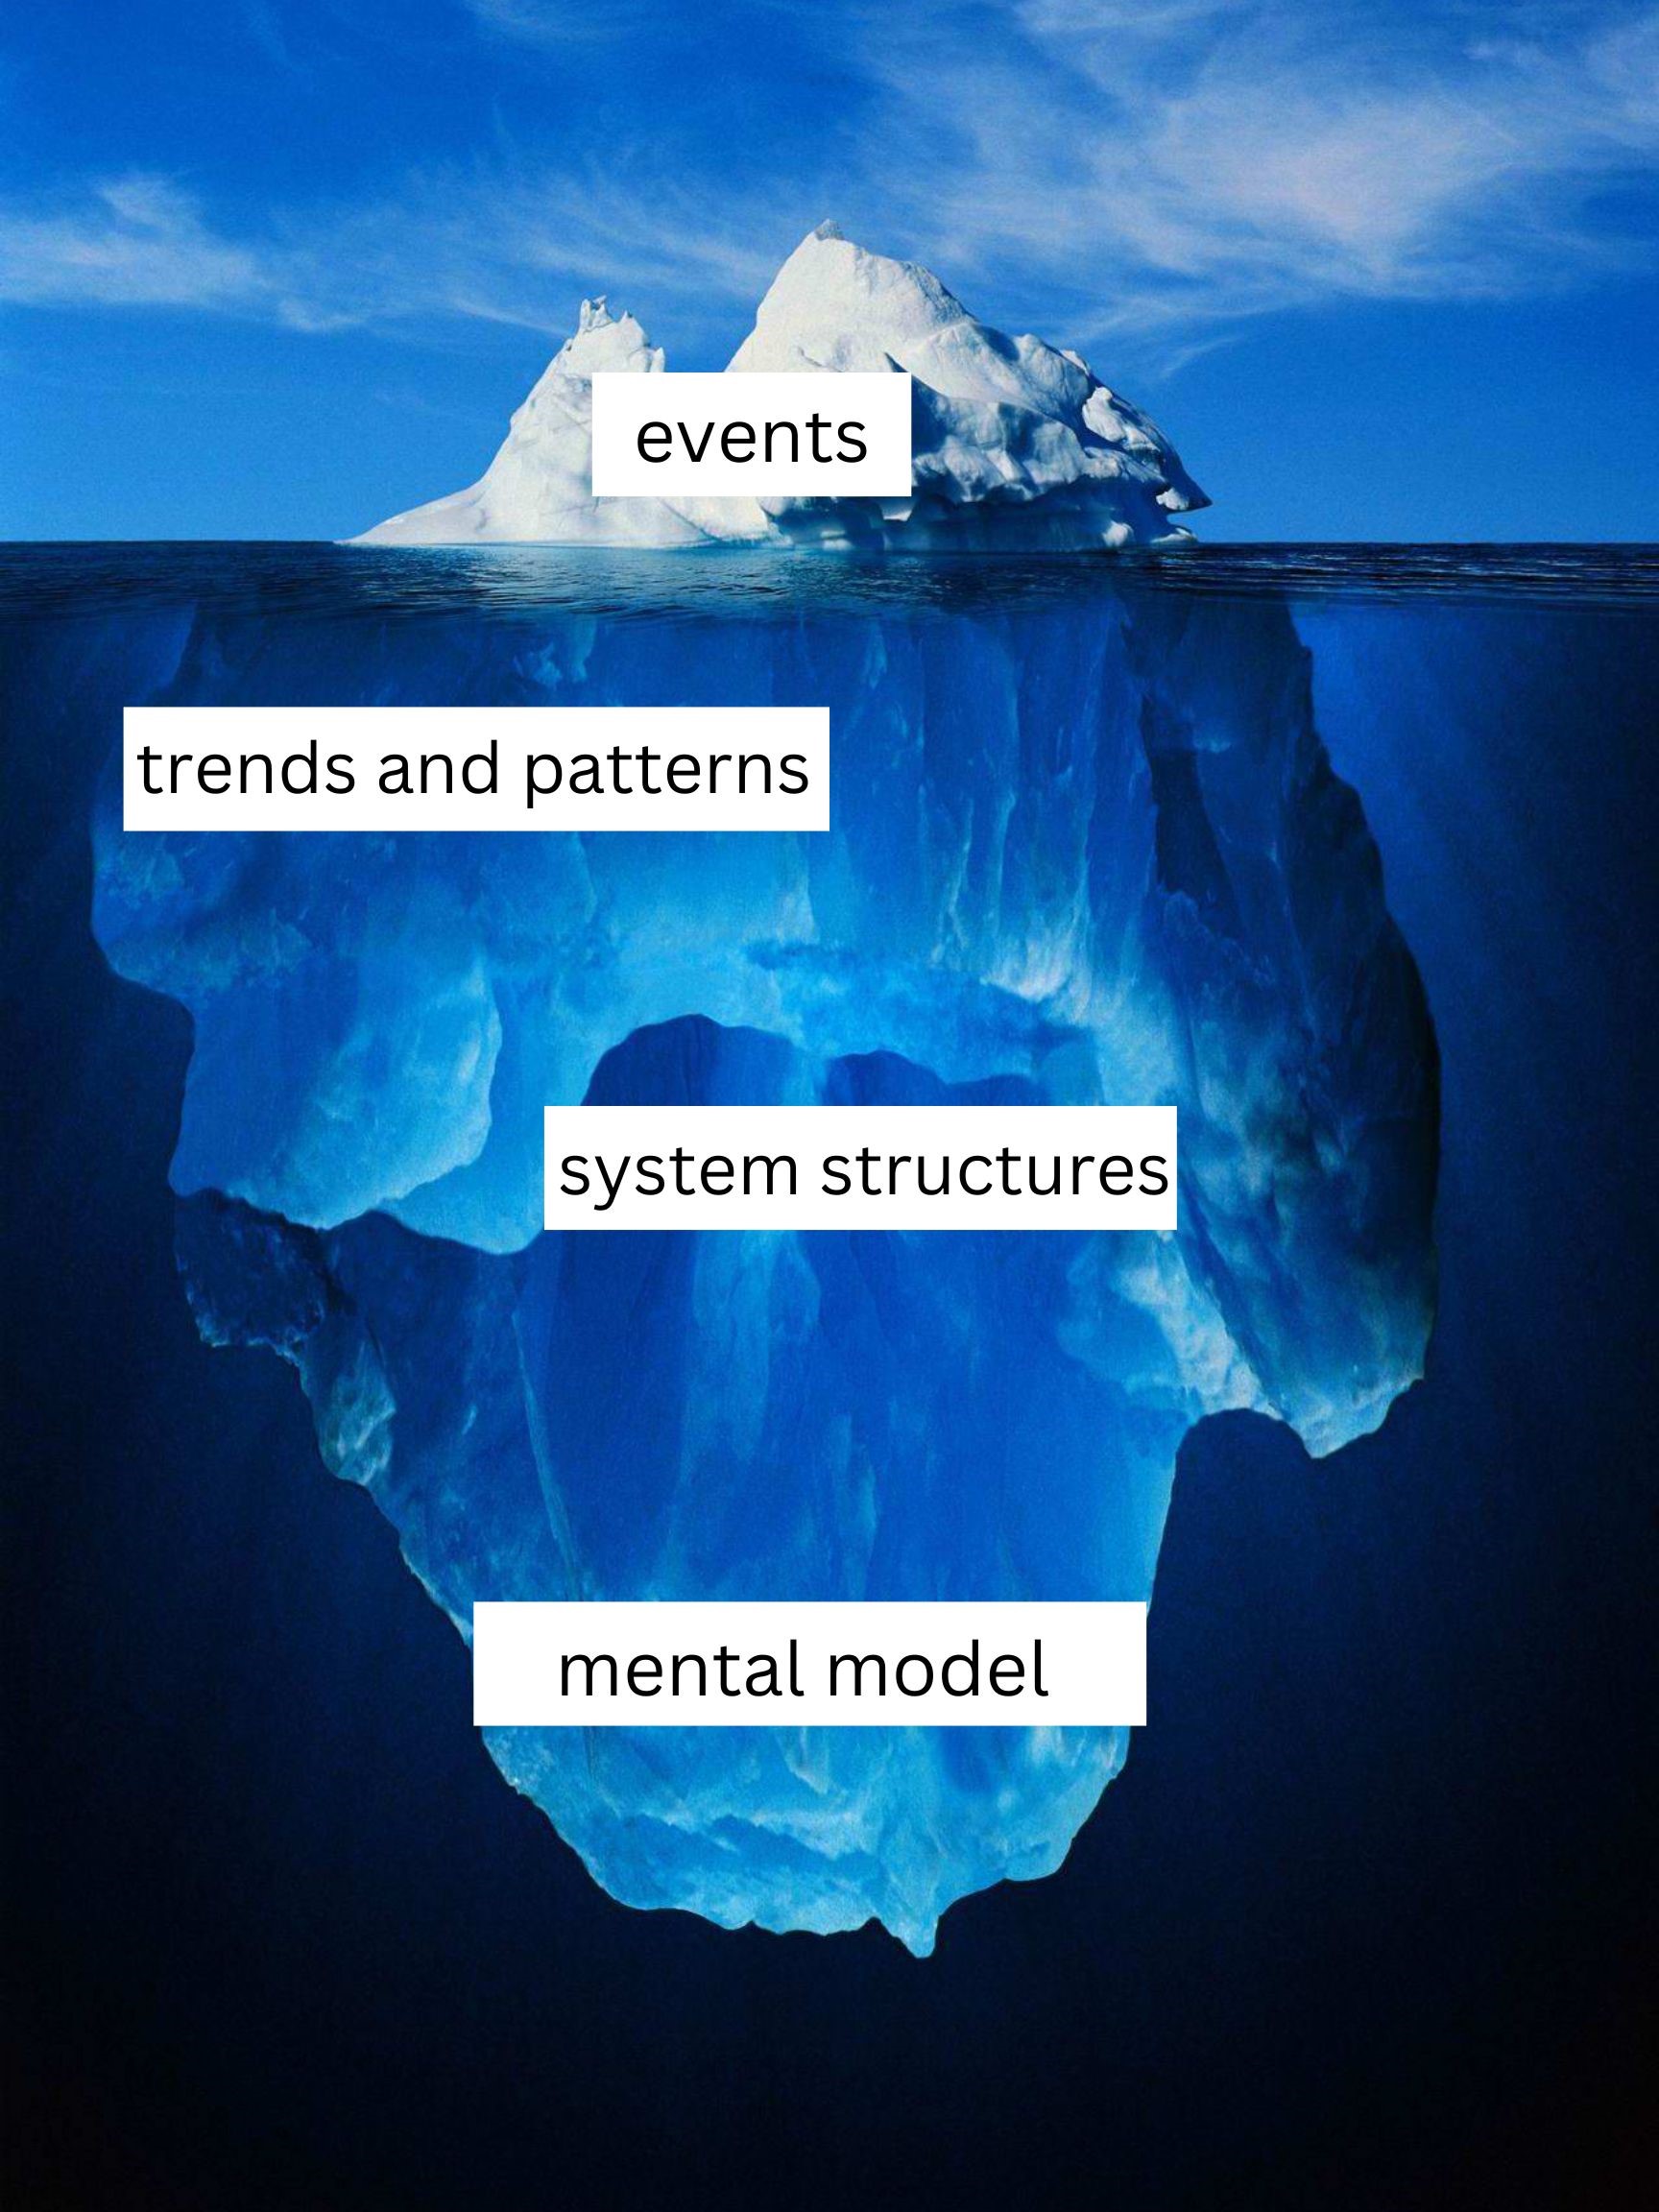
- Events. Evidence of the community situation is often identified in visceral experiences, events or things we witness in our lives and jobs:
- children in crisis who cannot get help
- rise in mutual aid to address basic needs
- seeing people without a home
- experiencing or witnessing violence
- Trends and Patterns. Evidence that demonstrates a problem that has existed for a period of time is shown through trends and patterns. This is often identified through secondary data:
- public health data
- agency program and service data
- case notes
- System Structures. A problem is usually perpetuated by policies and power dynamics of the structural systems. These are typically identified through:
- data analysis
- interviews with key stakeholders
- focus groups
- Mental Model Maps. At the very root of a problem are underlying assumptions, mental models or mindsets that contribute to the perpetuation of a problem or issue. These are typically identified through:
- interviews with key stakeholders
- focus groups
It works well to begin the assessment stage by considering what type of evidence from the above list you currently have access to in order to answer the more complex systemic questions about the causes of the current reality. Then, identify which data you need to collect to continue your analysis and get to deeper levels of understanding. To do this, changemakers need to access different types of data—which I describe as secondary data and primary data.
Changemakers often begin with reviewing secondary data, getting as close to the level of community being focused on, analyzing this data, and then supplementing with primary data—which is most often collected next in the process. Together, these sets of data should paint a clearer picture of the strengths and assets of the community, the need for change, the causes of the change, and the mindsets that contribute to the perpetuation or resolution of the problem being examined.
- De Sio, H.F. (2021). Changemaker playbook: The new physics of leadership in a world of explosive change. Boston: Nicholas Brealey Publishing. (pg. 91) ↵