Learning Objectives
At the end of this section, students should be able to meet the following objectives:
- Use FIFO to report ending inventory and cost of goods sold.
- Monitor inventory on an ongoing basis through a perpetual LIFO system.
- Use a weighted average system to report ending inventory and cost of goods sold.
- Calculate inventory balances by applying a moving average inventory system.
Question: Certainly companies purchase more than one or two shirts or other inventory items. How does the FIFO cost flow assumption apply to a perpetual system with several purchases and sales by the company?
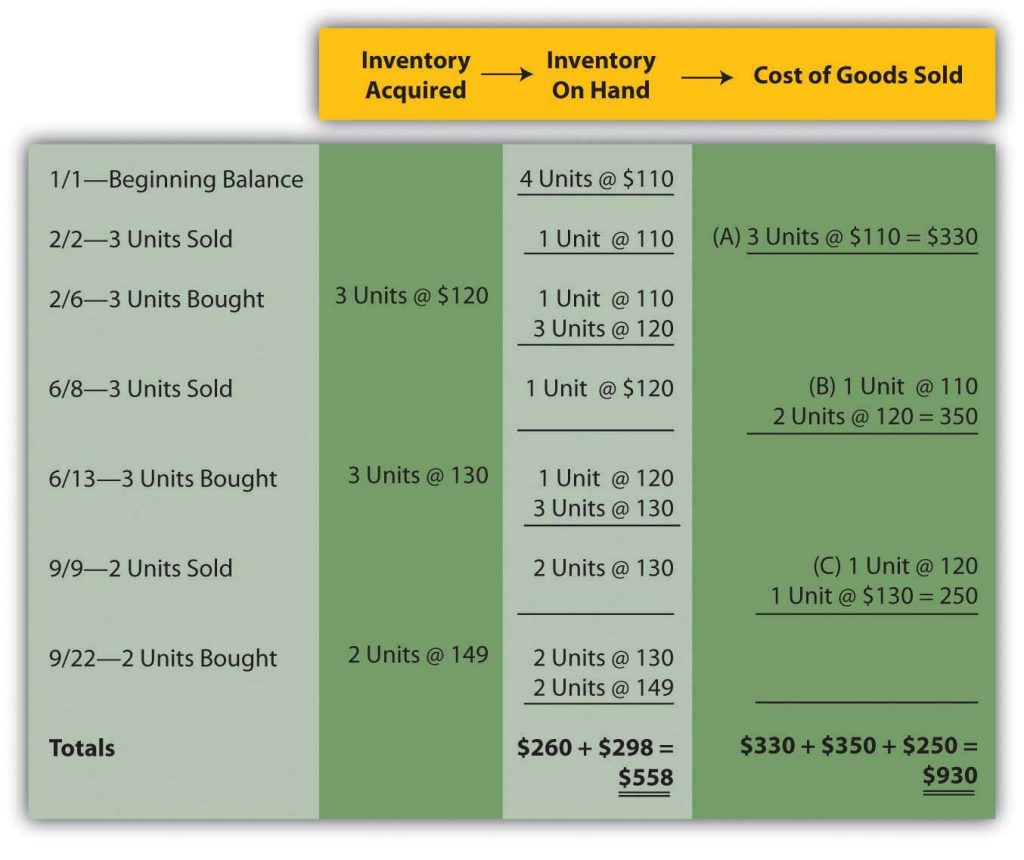
The following illustrates the application of FIFO to our perpetual inventory. Starting with 4 units at $110 each, the company sold 3 of those units on February 2 and all of them came from the oldest (beginning inventory is always the oldest units). They purchased an additional 3 units at $120 on February 6. On June 8, they sold 3 more units – now the oldest units are the one left over from beginning inventory and 2 out of those purchased on February 6. Another 3 were purchased on June 13 at $130 each. The final sale on September 9 was one unit left over from those purchased on February 6 and one unit from those purchased on June 13.
Notice that the dates of purchases and sales become important to determine the order and how to apply the cost flow assumption.

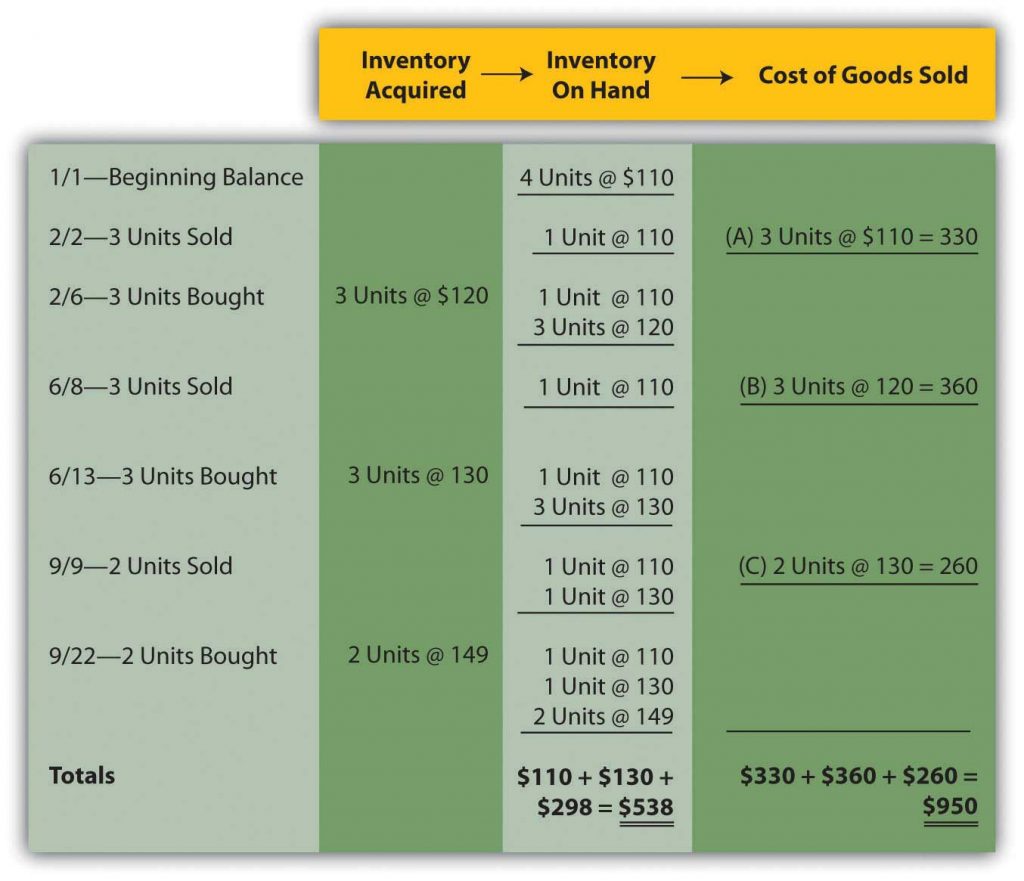
Question: LIFO reverses the FIFO cost flow assumption so that the last costs incurred are the first reclassified to cost of goods sold. How is LIFO applied to the inventory of an actual business? If the Mayberry Home Improvement Store adopted LIFO, how would the reported figures have been affected by this decision? The mechanical structure for a perpetual LIFO system is the same as that demonstrated for perpetual FIFO except that the most recent costs are moved into cost of goods sold at the time of each sale (points A, B, and C).
Figure 3.9 Perpetual LIFO—Bathtub Model WET-5

Once again, the last cell in the “inventory on hand” column contains the asset figure to be reported on the balance sheet (a total of $538) while the summation of the “cost of goods sold” column provides the amount to be shown on the income statement ($950).
Note that with perpetual LIFO example above dates are even more important because with LIFO a new purchase of inventory will become the items sold so whether that purchase happened before or after the sale will change our calculations. The calculation of which items were sold and what the cost of goods sold is for the sale on September 9 would be different if it was made on September 23 (when the purchase on the 9/22 becomes the newest units rather than those purchased on 6/13).
Question: Not surprisingly, averaging follows a path similar to that of the previous examples. Costs are either moved to cost of goods sold at the end of the year (periodic or weighted average) or at the time of each new sale (perpetual or moving average). The only added variable to this process is the calculation of average cost. In the operation of an averaging system, when and how is the average cost of inventory determined?
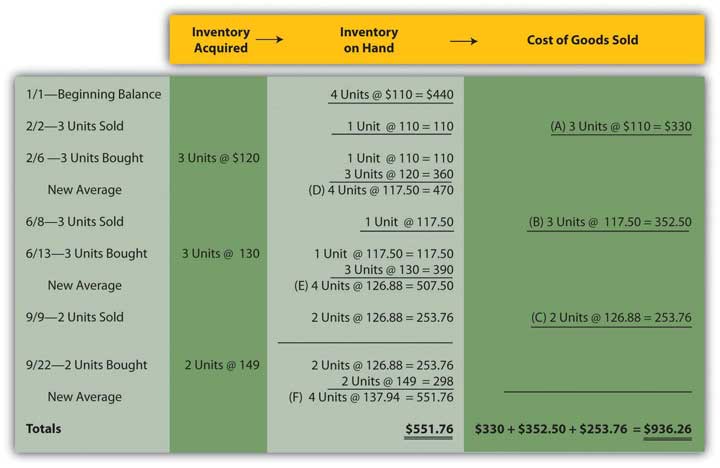
Perpetual (moving) average. In this final approach to maintaining and reporting inventory, each time that a company buys inventory at a new price, the average cost is recalculated. Therefore, a moving average system must be programmed to update the average whenever additional merchandise is acquired.
Below, a new average is computed at points D, E, and F. Each time this figure is found by dividing the number of units on hand after the purchase into the total cost of those items. For example, at point D, the company now has four bathtubs. One cost $110 while the other three were acquired for $120 each or $360 in total. Total cost was $470 ($110 + $360) for these four units for a new average of $117.50 ($470/4 units). That average is then used until the next purchase is made. The applicable average at the time of sale is transferred from inventory to cost of goods sold at points A ($110.00), B ($117.50), and C ($126.88) below.
Figure 3.10 Perpetual (Moving) Average—Bathtub Model WET-5
Summary. The three inventory systems shown here for Mayberry Home Improvement Store provide a number of distinct pictures of ending inventory and cost of goods sold. As stated earlier, these numbers are all fairly presented but only in conformity with the specified principles being applied.
Key Takeaways
Perpetual LIFO transfers the most recent cost to cost of goods sold but makes that reclassification at the time of each sale. A moving average system computes a new average cost whenever merchandise is acquired. That figure is then reclassified to cost of goods sold at the time of each sale until the next purchase is made.
