One of the most obvious ways to categorize information is by whether it is quantitative or qualitative. Some sources contain either quantitative information or qualitative information, but sources often contain both.
Many people first think of information as something like what’s in a table or spreadsheet of numbers and words. But information can be conveyed in more ways than textually or numerically.
Quantitative Information – Involves a measurable quantity—numbers are used. Some examples are length, mass, temperature, and time. Quantitative information is often called data, but can also be things other than numbers.
Qualitative Information – Involves a descriptive judgment using concept words instead of numbers. Gender, country name, animal species, and emotional state are examples of qualitative information.
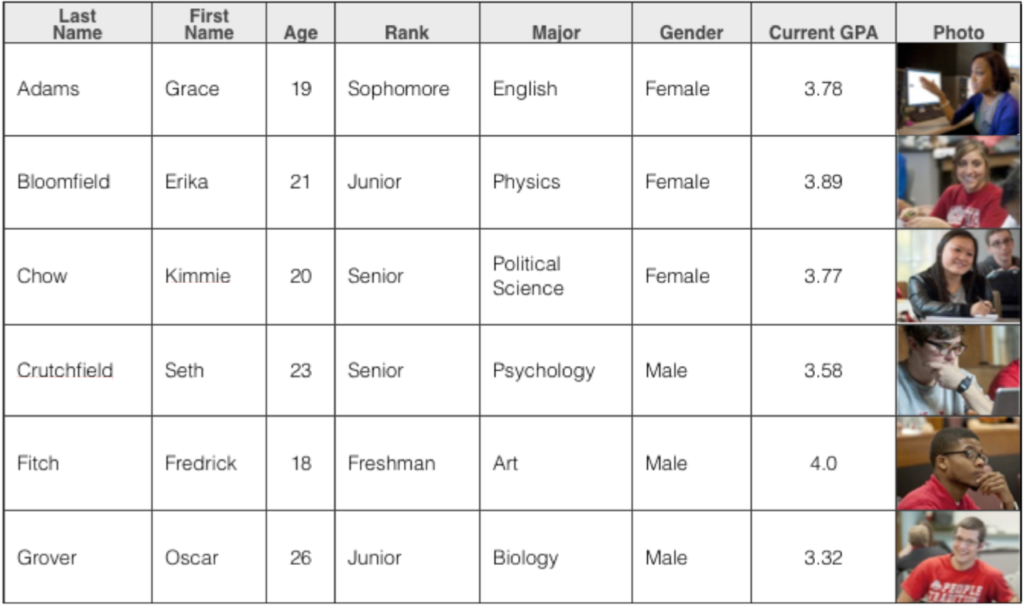
Take a quick look at the Example table below. Another way we could display the table’s numerical information is in a graphic format —listing the students’ ages or GPAs on a bar chart, for example, rather than in a list of numbers. Or, all the information in the table could be displayed instead as a video of each student giving those details about themselves.
Example: Data Table with Quantitative and Qualitative Data

of formats, including pictures.
Increasingly, other formats (such as images, sound, and video) may be used as information or used to convey information. Some examples:
- A video of someone watching scenes from horror movies, with information about their heart rate and blood pressure embedded in the video. Instead of getting a description of the person’s reactions to the scenes, you can see their reactions.
- A database of information about birds, which includes a sound file for each bird singing. Would you prefer a verbal description of a bird’s song or an audio clip?
- A list of colors, which include an image of the actual color. Such a list is extremely helpful, especially when there are A LOT of color names.
- A friend orally tells you that a new pizza place is 3 blocks away, charges $2 a slice, and that the pizza is delicious. This may never be recorded, but it may be very valuable information if you’re hungry!
- A map of Ohio with counties shaded different intensities of red according to the median household income of inhabitants.
Activity: Quantitative vs. Qualitative
What quantitative and qualitative data components might you use to describe yourself? See the bottom of the page for some possible answers.
Activity: Multiple Data Displays
Take a look at the Wikipedia article about UN Secretaries-General. Scroll down and view the table of people who served as Secretary-General. In what ways is information conveyed in ways other than text or numbers? See the bottom of the page for answers.
Answer to Activity: Quantitative vs. Qualitative
The answer to the “Quantitative vs. Qualitative” Activity above is:
Quantitative: age, weight, GPA, income
Qualitative: race, gender, class (freshman, sophomore, etc.), major
Are there others?
Answer to Activity: Multiple Data Displays
The answer to the “Multiple Data Displays” Activity above is:
- A photo of each secretary general
- The flag of their country of origin
- A world map with their country of origin shaded
Are there others?
