3
“We are, most of us, profoundly uninterested in municipal affairs.” — Maud (1938, p.1)
3.1 Introduction
Building on the previous chapter, which outlined the political development of local government within a broader governmental context – hierarchical and centralised from inception – this chapter commences by tracing the evolution of South African municipal finances since democracy.
Historically, as we have already seen, municipalities were required to comply with, and implement, ordinances issued by the Provincial Administrator (directed by national government), without dissent or question and regardless of the beliefs and views of their constituencies. This low political standing was then compounded by national government’s requirement that municipalities be almost entirely self-funding; even with only one primary source of local taxation – property tax. Financial assistance from NT was negligible. In 1979, for example, subsidies from central government constituted just 4.7% of the City of Cape Town’s income (Solomon, 1983, p.58). And although the 1996 Constitution elevates local government and protects municipal revenue sources, the principle of self-sufficiency, or self-funding, remains. Simultaneously, for reasons to be explained in more detail, the financial needs of municipalities have grown since the inception of democracy, such that municipalities are unable to balance their budgets without national grants. By 2014, the City of Cape Town required that 14.7% (operating and capital budget) of their budget be subsidised by national government (City of Cape Town, 2015, p.128). This figure had climbed drastically from the above-quoted 4.7% in 1979; while the national average had increased to 8% in 2003 (Bahl, 2003), and NT reported it climbing to 30% in 2015 (NT, 2016a, p.81).
The examination of municipal finances in this book now thus begins by trying to determine:
- The extent to which decentralised local government and financial self-sufficiency (detailed in the previous chapter) were adopted by post-apartheid municipal government;
- How the municipalities have fared;
- The contribution of user fees to municipal budgets; and
- The inconsistencies between the theory and application.
Three international case studies are provided. These explore the role that local government plays in different international environments, how various municipal operations are financed, how these countries’ municipal ESI developed, and the financial contribution (if any) that electricity has made, or continues to make, to municipal revenue in these countries.
3.2 South African Local Government Finance under Democracy
3.2.1 Period 1: 1994–2003
Beyond the euphoria of peaceful transition, South Africa’s conversion to democracy caught the attention of the world. This was particularly so because it came at a moment in history when the new government could be encouraged, as all developing countries were at the time, to adopt fiscal decentralisation. In truth, major South African cities had never relied on centralised support through national transfers and had always been required to generate their own revenue, albeit that their functions and services only benefitted the white population. Now, Chapter 7 of the Constitution, with 14 sections, mandated developmental local government, which meant undertaking and financing a much wider and inclusive set of responsibilities (Freire & Stren, 2001). Independent-revenue mechanisms were provided to support this mandate, while provincial and national government were required to give tacit support (in theory anyway). Reform for local government had arrived, and decentralisation enthusiasts around the globe had a best-practice example unfolding, to which they could lend support, refer to at conferences and publicly commend; which they certainly did. See Cameron (1996, 1997 & 1999), and Bahl & Smoke (2003a).
In 2000, the first democratic local government elections were finally held, six years after the 1994 national elections. By then, South Africa’s initial successes towards fiscal decentralisation[1] were already being lauded:
- A constitutional and legal framework had been created;
- Inter-governmental relations reducing hierarchical arrangements were in place;
- The number of municipalities had been reduced by two-thirds; and
- Key elements of a local government revenue system were operational.
These four achievements were major milestones which most countries were still grappling with. As a result, many governments and economists monitored South Africa’s progress closely. However, the process began experiencing challenges and to take longer than expected. Two internationally renowned academics undertook and led a detailed case study that was published in 2003 – Restructuring Local Government Finance in Developing Countries: Lessons from South Africa (Bahl & Smoke, 2003a) – to assist both the country and analysts working on fiscal decentralisation in other states. The study concluded that difficult choices lay ahead if South Africa was to meet the substantial role it had assigned to local government. The researchers, in undertaking a statistical analysis of 21 developing countries, found local government finance in South Africa to be “considerably more decentralised than might be expected”, with only Nigeria (a federal state) having a higher level of fiscal decentralisation. Additionally, Bahl and Smoke found local government tax revenues to be unexpectedly low when considering municipal expenditure, stating that the “level of sub-national government taxation in South Africa is considerably lower than would be predicted given the income level and size of the country”; by their estimation, these revenues were only 42% of expected levels. This suggests that central government requires services to be delivered at the sub-national level, but it is less willing to devolve revenue-raising powers. It was also found that, compared to their counterparts, South African municipalities enjoyed a high level of fiscal autonomy and could determine the size of their budgets; with property taxes to raise revenue being high, even by Organisation for Economic Co-operation and Development (OECD) standards. The research recommended that:
- While laws and the Constitution already broadly outlined responsibilities, greater detail was needed, especially when capacity levels among local governments, which varied significantly, were considered;
- Local revenues should be raised and new revenue sources identified; and
- Inter-governmental transfers should be stable and transparent, while municipal fiscal gaps should be closed.
Having covered property tax and national transfers, we now focus on utility/user charges for electricity, as well as two new potential municipal funding options during the period in question: utility excise tax and motor vehicle taxes.
Utility/User Charges
The revenue that municipalities get from user charges, especially for electricity, is paramount to them for three reasons:
- The surpluses they generate are sizable; municipalities use these to fund other activities;
- These sales provide a large cashflow; most municipalities’ debt ratings would be affected without them. For example, gross utility receipts make up more than one-third of total local government receipts, which is greater than property-tax collection. (It must be noted, however, that this is the case for 25% of municipalities – metropolitan and larger cities – with another 50% operating at the break-even mark, and the remaining quarter, at a loss.); and
- Municipalities use electricity supply as a credit-control tool, because all municipal charges (property tax, water, electricity, garbage collection) are bundled into one bill, and electricity supply is only reconnected if the entire outstanding debt is paid.
Although a reliable revenue source, user charges do however violate three primary characteristics of a good local tax (see Table 1.3 on page 27 in Chapter 1):
- User charges are a hidden tax, and are thus non-transparent. This consequently compromises accountability, as local voters cannot hold officials responsible if they do not know how and where taxes are used;
- User charges are transportable. Many users don’t reside where the electricity is consumed, and those who contribute most to the surplus, more especially businesses, may move to a municipality with better-priced services; and
- The electricity tariff is overstated by the amount of the implicit tax. This not only affects efficiency, but it also has an impact on national and domestic commerce.
In 2003, when it was expected that municipal EDI would be regionalised and privatised under the REDs initiative, municipalities feared losing this primary revenue source; this would have threatened their economic viability. Finding a replacement was a priority, and perhaps keeping the status quo even more so, which we will cover in later chapters.
Utility Excise Tax
A utility excise tax was seen as a viable replacement for the surpluses that would be lost from the privatisation/regionalisation of municipal distribution systems. The major advantage of an ad valorem on electricity sales would be the large customer base, making the revenue buoyant, as it would grow with consumption. Through offering rebates and incentives, rates could also be scheduled to suit the requirements of local government. Additional advantages, such as migrating from an implicit tax (one that is not collected directly by government but that results from policies) to an explicit tax (one that is levied and collected directly by government), meant that the tax could be levied regardless of whether a surplus was generated or which municipal entity distributed the service. Likewise, once accepted, it could be introduced to water distribution and garbage collection. In addition, an excise tax would greatly reduce the incidence of tax exporting, as it would accrue to the local authority which presides over the area, regardless of service provider. It would also be straightforward to administer and collect, by being included in the existing bill, requiring minimal additional effort. Finally, it would resolve concerns over the loss of revenue from restructuring, while complying legally, as the Constitution allows for the use of an excise tax.
A major concern of adopting an excise tax, however, is it being seen as regressive and affecting low-income households disproportionately. And even if matched at a rate to achieve existing surpluses, thus leaving tariff levels unaffected, its visibility to consumers could make it politically unpopular. Under such conditions, the call for the provision of relief to low-income households would be strong.
Motor Vehicle Taxes
Even though revenue from the annual renewal of motor vehicle licences continues to accrue to provincial government, there is ample justification for municipalities to access this revenue source; and if not outright, to then receive a share of the proceeds. Vehicle taxes possess most of the characteristics of a good tax, such as fairness and administrative ease, while being both revenue-productive and buoyant. Local roads must be maintained; taxes should help offset such costs. Additional options for revenue include congestion charges (this involves levying charges for driving in city centres, in an attempt to reduce traffic), parking charges, fuel taxes and tolls. Such measures could also help reduce pollution and congestion. Eventually, in 2009, metropolitan municipalities started receiving a portion of the national fuel levy to assist with road maintenance, as recommended by Bahl and Smoke in 2003.
3.2.2 Period 2: 2004–2016
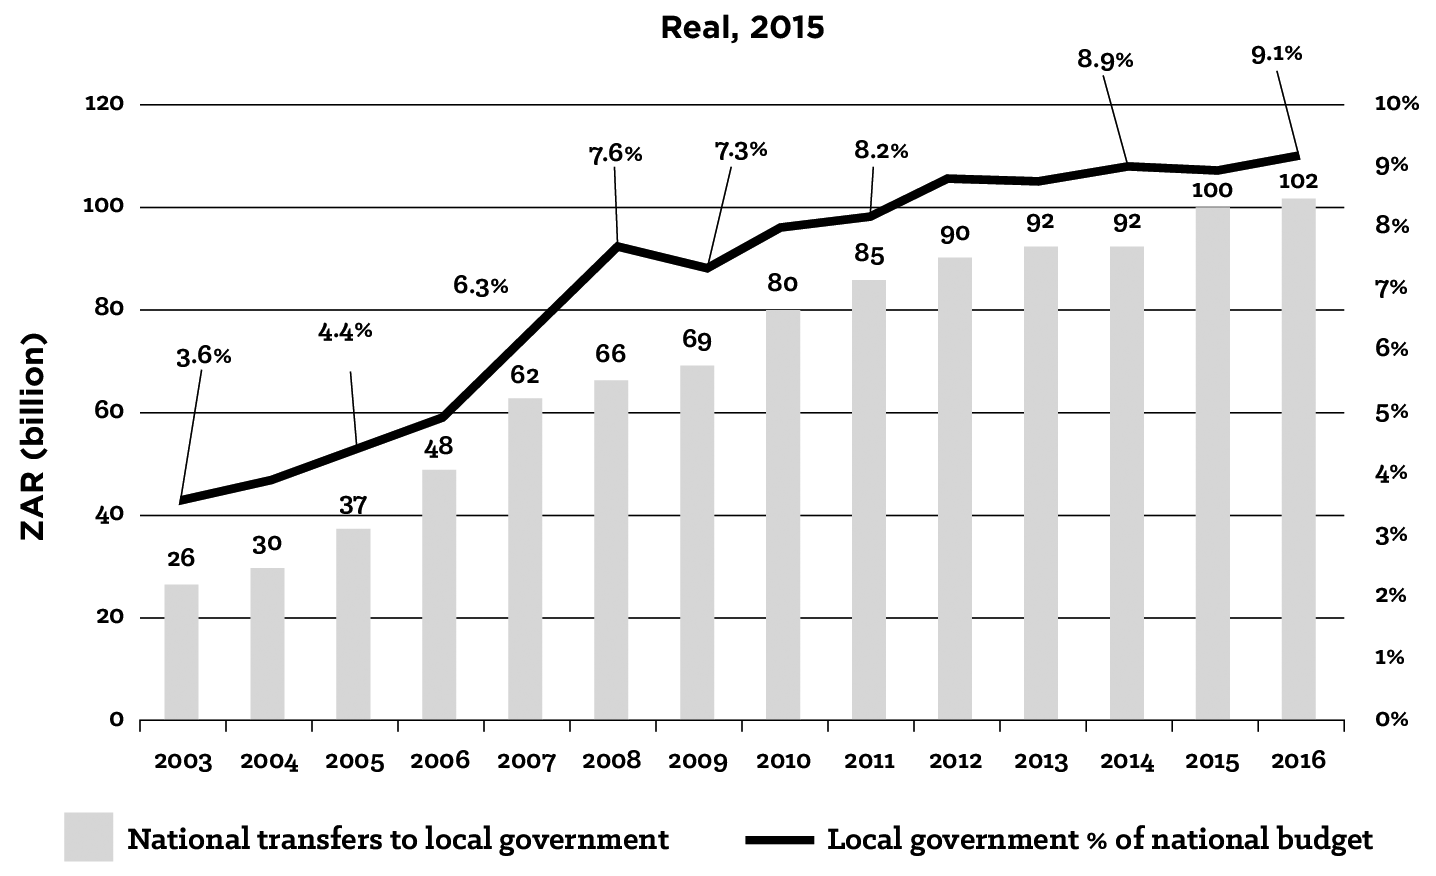
Analysis of NT’s Annual Budget Review[2] publications shows key underlying trends. Primary among these is a steady reduction in the percentage of own revenue generated by local government. For example, Solomon (1983) calculated that national transfers made up 4% of Cape Town’s revenue in 1983. This was relatively representative of the national average at the time, but Bahl found that this number had doubled to 8% by 2000. By 2016, national transfers made up 80% (district municipalities), 37% (local municipalities), and 19% (metropolitan municipalities) of revenue. Figure 3.1 clearly illustrates this trend, where for the period 2003 to 2016, national transfers quadrupled and the local government percentage of national budget increased more than 2.5 times. Some, but not all, increases were planned, such as the decision to terminate the RSC levy on 1 July 2005. The loss of revenue to municipalities was compensated by increasing national transfers, which in 2006 resulted in the percentage of total national budget transferred to local government increasing from 4.9% to 6.3%, with national government making greater use of non-discretional funding.
Source: Author, derived from NT
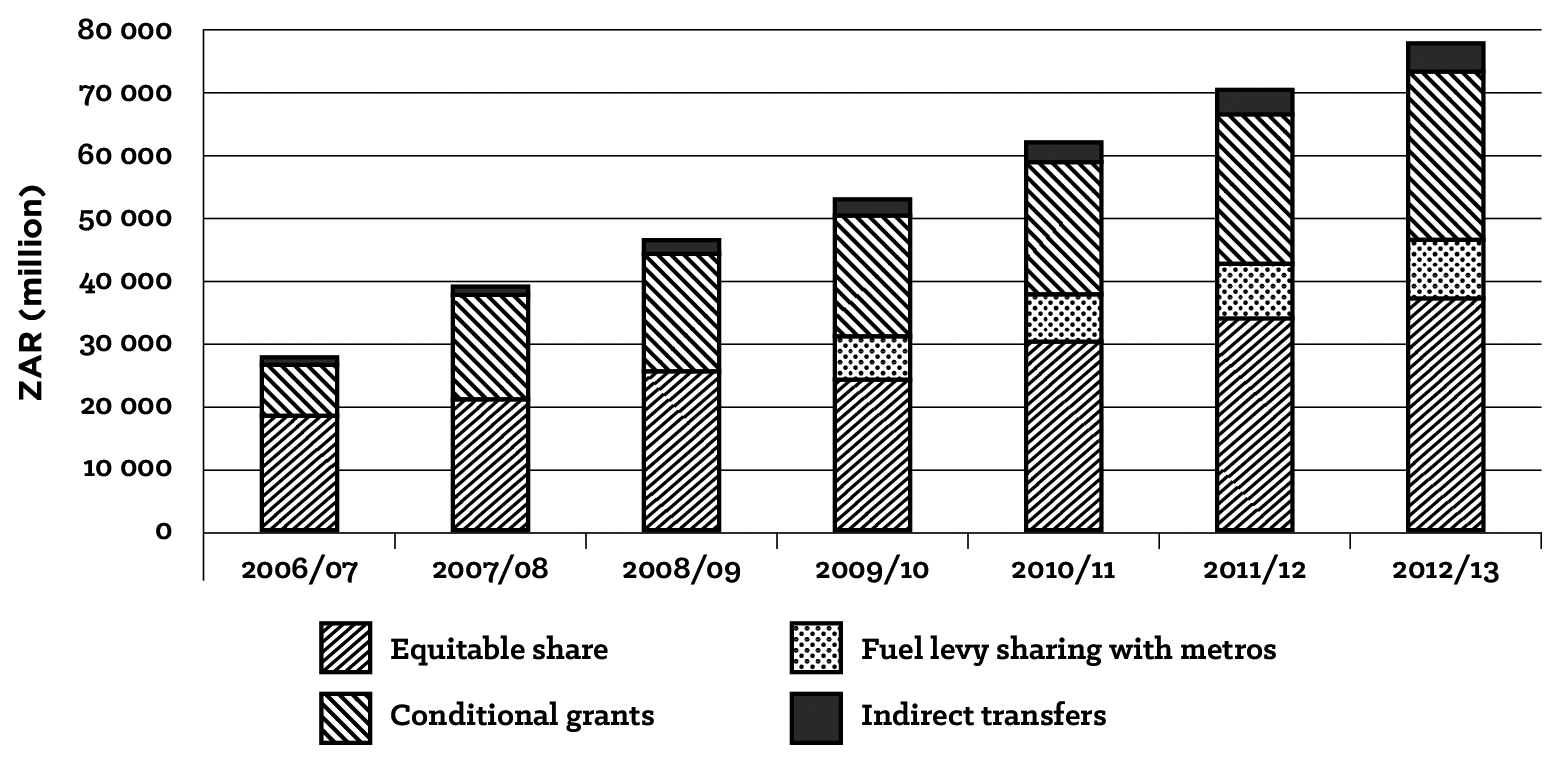
Source: Moore (2012)
The other equally important trend was the obvious realisation and tacit acceptance of sub-optimal performance at local government level. This is evidenced in the tone of the NT commentary, which in the early 2000s – although recognising the challenges of amalgamating municipalities (843 to 278) and being pragmatic about the task of transforming them to meet their service-delivery mandate – was positive and ambitious. This gradually transformed to one of concern, and even alarm, about continued poor performance, mismanagement and growing backlogs. In 2004, NT made an additional R750 million per annum available to municipalities, to prioritise in-house capacity building (NT, 2004, p.162). In 2006, continued capacity constraints in municipalities saw NT launch the Siyenza Manje project to strengthen engineering and project-management expertise. The initial budget allocation was R742 million (NT, 2007, p.147), which was expanded to include financial management and which cost R1.45 billion by 2011 (FFC, 2011, p.5).
In 2014, NT summed up the situation as follows:
While much has been achieved in the rollout of municipal infrastructure … Significant work needs to be done, both to eradicate backlogs in access to services, and to ensure that services are properly operated and maintained over the long term … there has been widespread waste and inefficiency. (NT, 2014, p.101)
In 2016, NT then announced another review to determine what could be done to improve performance, but this performance continues to be very poor.[3]
These two interrelated trends coalesce into a growing exasperation that despite over a decade of annual double-digit percentage increases in funding to municipalities, the financial status of local government remained precarious or had worsened; with the 2011 Budget Review (p.59) containing a section titled “Vulnerable cash position of municipalities”. Of course, while being a concern, municipal finances were perhaps less of an issue as the national economy grew up until 2010, albeit by far less than required. However, the sustained pressure of low (<1%) and negative GDP growth since 2010 has meant national resources having to be carefully managed. Once again, reforms were put in place, but with a greater focus on financial efficiency: “Municipalities can improve billing and revenue, reduce water and electricity losses and enhance maintenance”; and, “Municipal standard chart of accounts, in pilot phase, will promote transparency and accountability” (NT, 2016a, p.83).
The final trend identified is the growing impact of higher electricity tariff increases on sales from 2007 onwards. Initially, this resulted in a windfall for municipalities, as the increases, which came off a low base, took some time for users to respond to. By 2016, however, significantly lower surpluses were generated amidst a depressed economy and consumers having taken measures to reduce consumption: “Recent increases in the costs of bulk electricity and water have reduced the surpluses municipalities generate from these services” (NT, 2016a, p.92). Significant reasons for smaller surpluses include reduced consumption due to the magnitude and frequency of tariff increases, together with higher bulk tariffs charged to municipalities, which impact expenditure and revenue ratios. (This issue is dealt with in greater detail in the case study of Johannesburg Electricity Undertaking [JEU] in Chapter 5).
In recognising the financial and skill deficiencies of municipalities, central government has taken various measures, including:
- Revising the equitable-share formula to favour smaller and district municipalities in order to compensate for the limited revenue-raising opportunities now available to them;
- Allocating a portion of the national fuel levy to metropolitan municipalities to fund road maintenance; and
- Expanding conditional grants for infrastructure projects (electrification, water, transport, urban settlements, and rural roads) to ensure service-delivery projects are prioritised. Indeed, conditional grants in 2016, as a percentage of total transfers from national to local government, had increased to over 80%.
NT then went one step further and introduced indirect transfers,[4] while after a long battle, municipalities succeeded in preserving one of their two primary revenue sources (electricity surpluses) when the REDs initiative was withdrawn. Metropolitan electricity networks were also strengthened by national government as part of the 2010 FIFA World Cup project, which in the view of Dr Willem de Beer, ex-COO of EDI Holdings, postponed the crisis facing the municipal EDI.
Despite these developments, by 2016, local government had not achieved the fiscal decentralisation objectives identified earlier in this book, and if anything, the reverse is occurring. Indeed, additional and new own-revenue sources have as yet to be identified and introduced, while annual shortfalls are “plugged” by electricity surpluses and ever-increasing national transfers. And national government’s efforts to improve municipal performance have been limited at best. For example, in the auditor general’s June 2016 media release on local government audits, it was reported that municipalities had improved over the last five years, with 54 receiving clean audits, compared to just 13 for the previous period. If one considers that there are 278 municipalities, however, then a mere 54 demonstrates just how poor the overall performance is. Of greater concern was the finding that: “In 2014–15 the [Auditor General of South Africa] AGSA rated the financial health of 92% of the municipalities as either concerning or requiring intervention [82% in 2012–13].” This was made apparent by net deficits, with current liabilities exceeding current deficits; an inability (or taking too long) to collect revenue; and not paying creditors on time (AGSA, 2016). On this evidence, it would thus appear that the issues of inadequate skills and financial resources faced by local government since formation of the Union continue in the 21st century. This is a long-term trend that is reinforced by management instability, the intense turnover that took place during the amalgamation process and “transformation fatigue” as experienced in Cape Town, and the loss of skilled and semi-skilled senior employees). And despite constitutional mandates attempting to elevate and reform local government, with sincere, concerted efforts to feasibly manifest this, it has not occurred.
Again in 2016, the tenuous nature of revenue from municipal services was publicly raised by the then Johannesburg mayor, Parks Tau, when he called for an official review of local funding sources. The issue has gained momentum, with the South African Local Government Association (SALGA) and other local government leaders adding to such calls; with local government’s developmental mandate at the heart of the municipal finance review argument. This essentially states that in overcoming the spatial segregation legacy of apartheid and the high urbanisation rate of indigent people, in the form of “land invasions, mushrooming of informal settlements and proliferation of backyard dwellings” (Tau, 2017, addressing the Gauteng Infrastructure Funding Summit), the unavoidable consequence is revenue earmarked for infrastructure development now being redirected. Additionally, the expectation of extracting meaningful revenue for services provided to the unemployed as well as low-income earners, is unrealistic. Indeed, even those who do pay, consume less than the costs incurred to service them. Thus, the 9% of overall national revenue which is transferred to local government (Figure 3.1) is insufficient, and SALGA has called for legislative changes – particularly singling out “changing NERSA’s and ESKOM’s unfettered rights to impact on municipal infrastructure and finance management” (SALGA, 2017; Tau, 2017; Naki, 2016).
Municipal finances also featured prominently at the 2017 Chartered Institute of Government Finance, Audit and Risk Officers (CIGFARO) conference. Here, in a top-down explanation, the Financial and Fiscal Commission (Mabugu, 2017) noted the impact of the protracted economic slowdown on public finances (income down by R352 billion for the period 2009 to 2016, of which R24 billion would have accrued to local government), thus putting pressure on all government expenditure. Regardless, five structural changes deemed necessary to maximise revenue generation were listed:
- Reforming existing tax instruments: Increasing or broadening the VAT rate,[5] for example;
- Introducing new taxes: Carbon tax,[6] local business tax, and land-value capture (which allows communities to recover or “capture” land-value increases resulting from government investment and actions);
- Enhancing tax administration and closing loopholes: Addressing base erosion and profit shifting (when companies “shift” their profits from high-tax jurisdictions to low-tax ones, thereby eroding the tax base of the high-tax areas);
- Increasing efficiency: Reducing the public-sector wage bill, improving municipal efficiencies (reducing electricity and water losses, and resolving debt issues) and improving inter-governmental co-ordination; and
- Combinations of the above.
NT’s speaker (Fanoe, 2017) noted that popularly-quoted factors contributing to municipal failures were in her view anecdotal. These include:
- Underfunding;
- Unviable municipalities;
- Governance failures; and
- The design of the inter-governmental system or national government itself.
The facts, however, it seems mirror the sentiments expressed by Dr Andrew Siddle and Dr Thornhill in their interviews with the author, as well as the auditor general’s findings: Municipalities collectively underspend each year, with their share of total national revenue actually being substantial at 24% (9% transfers plus own-revenue sources); and that ultimately it is mismanagement, lack of internal controls, leadership challenges, and massive water and electricity losses which need immediate remedial action.
3.3 Municipal Finance Practice Compared to Municipal Finance Theory
Municipalities with limited revenue sources are left with little choice but to rely heavily on user charges – making these particularly attractive, because they are not accessible to the other spheres of government. This practice, theorists note, allows for accountability, as residents can vote new political parties into power if they are dissatisfied with service levels. There are however two disadvantages.
The first, especially when revenue is constrained, is the strong tendency to maximise surpluses for general-purpose use – at the expense of the service itself; with maintenance and new capital investments as typical first casualties. In effect, the user-charge practice provides a subsidy from those who use the service to those who do not; a crude redistributive technique often missing the target group entirely.
The second disadvantage is that tariff structures that are not carefully considered can have material consequences. For example, quantity/volume discounts place the burden on low users and are thus regressive. Marginal pricing is also problematic, because it is difficult to define costs properly and it may still be difficult to determine the appropriate charge even if costs are defined correctly. For example, if users deem electricity tariffs too high, they will reduce their consumption or, for those who can afford it, switch to distributed generation (electricity generated and supplied by a variety of smaller and alternative sources) or energy-efficient technology. This puts the entire municipal funding model under pressure; all of which now occurs in a strained economic environment that only serves to further compound the effects (Solomon, 1983; Mawhood, 1993; Reynolds, 2004; Van Ryneveld, 1990; Sioshansi, 2014). Here, thus, it seems evident that the theoretical projections were accurate, as all these stated outcomes have materialised.
A more important issue, however, is that there are two conflicting objectives. Theory states that the municipal priority should be efficiency, with broader developmental goals left to national government. And therein lies the rub for local government in South Africa. The Constitution and White Paper on Local Government call for developmental local government to address past inequities and apply a holistic approach to achieve other policy objectives, such as job creation.[7] Yet, sustainable financial practice, efficient usage of resources, transparent tariffs etc. are equally promoted. This contradiction places local government in an untenable financial situation, as the political imperative of development is always likely to take precedence over sound financial management – thus confirming the concerns and scepticism that met the White Paper when it was issued.
In many ways, the long-standing municipal practice of cross-subsidisation funded from user fees, which served WLA authorities ably for decades, was seized upon after 1994 to fund the extension of municipal services to previously excluded and marginalised residents. Simultaneously, ineffective and inefficient local government has increased overall municipal funding requirements. This means that proceeds from what is seemingly an inexhaustible source of revenue (which it is not) increase disproportionately annually.
3.4 International Case Studies
In viewing the South African scenario from a more dispassionate perspective, it would perhaps add further insight to consider municipal practices from other countries. In this chapter, we look at three international case studies:
- Norway: Municipalities continue to be financially involved in the ESI;
- Italy: Once an agrarian economy, Italy industrialised at the same time, and with similar power requirements, as South Africa. The government framework, however, is based on Napoleonic principles vastly different to those of England and South Africa, providing a different perspective; and
- England: South Africa’s government framework was based on the British system; and thus, having had the same starting point, it is worth reflecting upon.
3.4.1 Case Study 1: Norway
The legal foundation for local government was established in 1837. From 1900, infrastructure projects were undertaken (power plants, gas and water reticulation, roads and garbage collection), funded from two local taxes: property and income. Total revenues from local government amounted to about 4% of GDP. The high municipal taxes led to a debt crisis in the 1920s, and many municipalities went bankrupt. National government intervened, which ultimately resulted in a highly centralised welfare system by the end of WWII (Blom-Hansen et al., 2010, p.96).
Local government was reformed in the 1960s; national transfers to local government were increased, and caps were placed on local taxes. The 1980s then saw municipalities taking on additional functions through the provision of grants and incentives, while giving these legal status. In this, Norway, like the other Scandinavian states, is a welfare state, with local government being tasked with service delivery, including, among other things, schooling, primary healthcare, care for the aged, local roads, electricity, water and sanitation.
By 2013, local government funding was broken down as follows:
- Local taxes (40%);
- General grants (36%);
- Fees and charges (15%);
- Interest and dividends (5%); and
- Non-discretionary grants (4%).
Fees include revenue from the generation and distribution of electricity. An interesting feature is the 5% contribution from interest and dividends which stems from the historical role of municipalities owning power companies. These had generated 75% of the country’s electricity (Bye & Hope, 2005, p.25), but many municipalities and counties sold their power plants in the early 1990s when the electricity market was deregulated, reducing their generation capacity to 52% (Government of Norway, 2008, p.78) and investing the proceeds in financial markets (Blom-Hansen et al., 2010, pp.101–102). According to Bye and Hope (2005), Norway decided to deregulate the electricity sector because it operated inefficiently. Investments were reimbursed through price increases and cross-subsidisation between utilities. There was no evidence of monopoly profits, but “the distribution networks used their monopoly power to be cost inefficient rather than profitable” (p.7). Under deregulation, three licence types were created: production (generation), grid (regional, central and local), and trading; with most of the 159 distribution companies owned by municipalities in 2008.
A major objective of deregulation was to improve efficiencies. This took place, resulting in electricity tariff decreases, which ironically, undermined well-established energy-efficiency programmes. Tariffs are not regulated, but there are rules that decide their structure and upper limits on cost recovery from customers. Distribution tariffs vary amongst companies, and government provides an annual grant to distribution companies to reduce tariffs in areas with the highest cost per kilowatt hour (kWh) and to level tariffs between companies (Nordic Energy Regulators, 2011, pp.89–95).
3.4.2 Case Study 2: Italy
Italy has four levels of government:
- Central;
- Regional (20 regions);
- Provincial (110 provinces); and
- Municipal (nearly 8 100 municipalities).
Provinces and municipalities came with the establishment of the Kingdom of Italy (1861) and regions with the 1948 Constitution. Regions, although allocated administrative and legislative powers by the Constitution, enjoy little power. Their authority is resisted both by municipalities and a central government ruled through centralised institutions; with any challenges made against national government by the regions in the Constitutional Court of Italy consistently failing, as all the Constitutional Court judges are appointed by national government (Piperno, 2000, pp.4–5). Simultaneously, provinces do little more than co-ordinate activities between the thousands of municipalities; and as Piperno notes, “Italy offers interesting insights into the risks and pitfalls that may be encountered when a decentralization process is not well managed” (Piperno, 2000, p.1). Indeed, the complicated nature of Italian government, in terms of absolute numbers and structures, has resulted in multiple levels of government responsible for the various components of a function. For example, local municipalities are responsible for hygiene and health, but not hospitals (Goldsmith & Page, 1987, p.113), while energy production, transportation and distribution are provided by regional government.
Until 1972, local government finance had a high degree of autonomy. National government then centralised the national revenue system, resulting in increased central transfers and decreases in own-source revenues (Table 3.1). Local taxes were abolished, whilst municipal functions were increased, and central government funding went from 10.3% to 58.7% in just eight years (1972 to 1980). Inevitably, the regions and the municipalities yielded much of their autonomy in exchange for additional revenue (Goldsmith & Page, 1987, pp.119–122).
Source: Goldsmith & Page (1987)
Then, in 1990, Italy reverted to financial decentralisation for local government. The first change, in 1988, was the introduction of the “addizionale”, a surcharge on electricity consumption (for any purpose), levied by the energy suppliers and paid to the local authority (Iannello, 2008). The levy was EUR18.59 per thousand kWh in 2011 (EU, 2016). In 1993, municipal property and garbage-removal taxes were introduced; and by 2005, revenue collected directly by municipalities accounted for 41% of total revenue – rising to 61% if the personal income tax surcharge is included (Iannello, 2008). Here, a study by Di Liddo et al. (2014) on 5 662 municipalities identified six categories of own-source revenue:
- Property tax (35%);
- Usage and other fees (27%);
- Waste management (20%);
- Addizionale surcharges on electricity and personal income tax (10%);
- Other taxes (3%); and
- Other fees (5%).
Italy’s levels of electricity consumption track the country’s economic development. This was exceptionally low until the end of WWII, and almost exclusively agrarian, with generation undertaken by vertically integrated private firms with private networks that served the major cities (Busnello, 2014, pp.23–26). Economic growth started in earnest in the 1950s and then took off during the miracolo economico (economic miracle) of the 1960s, with the requisite demand for electricity increasing 8% year-on-year during this period. The Italian network, a fragmented and effectively oligopolistic cartel, protected its high-profit business and was not prepared to make the large investments needed to support industry and electrify the country. Government intervened and in 1962 nationalised the electricity industry, creating Ente Nazionale per l’Energia Elettrica (ENEL). All private electricity producers (more than 1 200 companies) were obliged to sell their activities to ENEL. This excluded a few industrial producers such as FIAT, as well as municipal producers who supplied their city, most notably ACEA in Rome and AEM in Milan, and small producers of less than 15 gigawatt hours (GWh)/year (Busnello, 2014; Pagliano, 2004).
The Italian ESI was dominated by state-owned enterprises until 1999, when the market was liberalised in accordance with European Union (EU) requirements; with generation still controlled by ENEL (80%); auto-producers (who produce electricity solely to support their primary activity) and IPPs (15%); municipalities (4%); and private companies (less than 1%). The picture has changed significantly with full market liberalisation, and by 2012, ENEL’s market share had dropped to 25.4%.
Electricity distribution – now a fully regulated business – is licensed by local municipalities, meaning that there are more than 8 000 licence areas serviced by 151 distributors. ENEL dominates distribution, with an 86% market share, but this figure is down from close to 95% during the 1990s. Next are the large municipal distributors, many of which are listed private companies (A2A with 4%; ACEA with 3.4%; and AEM with 1.3%) (Benedettini et al., 2013; Pagliano, 2004; Mercados, 2015; Montella et al., 2014). And even though distribution companies are publicly listed, the municipalities hold majority stakes, with the municipality of Rome for example holding 51% of ACEA in May 2016 (ACEA, 2016).
A notable characteristic of the Italian electricity sector is the fact that tariffs are geographically uniform. It is a legal requirement that the same network tariff for final customers is applied throughout the country. To ensure a level playing field, national government compensates distributors who have a higher cost structure; while the tariff structure is being reviewed (2015 and ongoing) to ensure it provides the right signals to improve energy efficiency (Mercados, 2015, p.421). As already stated, Italian municipalities have always generated revenue from electricity, especially from distribution, as they are the legal owners of the licence; and while electricity-distribution revenues are not publicly available (Mercados, 2015, p.415), analysis shows electricity contributing a small, but not insignificant amount to municipal revenues.
Finally, in reducing electricity consumption, several countries introduced progressive tariffs following the 1973 oil crisis; with Italy, in 1974, being the only country in Europe to introduce such a scheme for households. This was followed shortly by a 3-kilowatt peak (kWp) capacity limit. The measures were so effective that 90% of households responded by adopting the cheaper tariff option. These two steps are credited with reducing Italy’s overall electricity demand; while time-of-use tariffs were also introduced for industrial users (Pagliano, 2004; Dehmel, 2011).
3.4.3 Case Study 3: England
A hallmark of the evolution of local government in England was its independence from central government. This was largely because the service of local justices, who were appointed by central government, was compulsory and not compensated. This separation of local and central government, or dual polity, thus allowed each sphere to operate independently. This system was different to that found in many European countries, where local administration rather than local government exists – such as in France (Goldsmith & Page, 1987, p.68). And while property taxation has existed in England for many centuries, its modern form was derived from the Poor Law of 1601, through which local authorities were given the power to levy a property tax, or “rate”, to fund their services. At this time, the right to vote was related to property ownership, and it was decided to tax property owners, as it would be them who benefitted from locally provided services (Government of the United Kingdom, 2004). Today, the UK continues to rely heavily on property tax, deriving 11.9% of its total tax revenue from this source in 2015, which is the highest in the OECD (Busnello, 2014; Pomerleau, 2015).
Local government is responsible for a wide range of government functions. The list of these functions gradually grew as traditional services were expanded and new ones were introduced. By the mid-1920s, there were as many as 584 power stations, or undertakings, as they were legally referred to. Undertakings supplied a specific area, enjoyed monopolistic rights and privileges, and were owned and operated by private enterprises (34%) or municipalities (66%) (Robson, 1928). This system of vested interests, which allowed municipalities to use the earnings of the municipal power plants to pay non-electrical operational expenses, blocked any attempts for the development of a co-ordinated and integrated national system.
Legislation, based on the findings of the Weir Committee report[8] in 1926, created the National Grid and the Central Electricity Board. The Grid interconnected regional grids by 1933, and an integrated National Grid was in place by 1936. This would provide an abundant supply of electricity at maximum economies of scale and at sufficiently low costs to stimulate demand and economic development in the post-WWII period.
The Electricity Act of 1947 included legislation to prevent the relief of rates from electricity undertakings’ funds “to an inordinate and unwise extent”, so as to promote the use of electricity in the country[9] (AMEU, 1937, p.71). Under the Boards National Plan, nine national power zones were created, covering over 98% of the population (Hormell, 1932, pp.128–139), after which the Electricity Act of 1947 reorganised and nationalised the ESI and ended any further municipal involvement in electricity generation, transmission and distribution.
However, the basis of ownership of undertakings was motivated by service, savings and prestige; profit was never the key issue (Hart & Demetrius, 2000). Indeed, the larger municipalities supported the restructuring of the industry, as they recognised the long-term economic benefits of an integrated system (Hormell, 1932), and the loss of marginal revenue was a small price to pay.
In addition to electricity and gas supply, hospital services and cash assistance for the poor were shifted from local to national government. Nonetheless, the additional services that had been allocated to, and the higher standards that were expected of local government over time still necessitated ever-increasing central grants, and the surge in local government spending became untenable by the mid-1970s, as only 35% of total revenue was collected from own sources – property rates.
The Layfield Committee, which reported in 1976, found that the finances of local government were becoming unsustainable, and a choice had to be made between “a continuing and accelerating drift towards further centralisation or a reaffirmation of local responsibility”. An expanded tax base was needed, and a form of a local income tax on personal income was recommended.
Central government finally had to act when it was forced to take a loan from the IMF in 1976, a condition of which was to ensure significant cuts in public expenditure, including national grants. Local municipalities countered this by increasing property tax rates. National government then introduced spending caps for local government.
The Conservative government, in power from 1979, decided against expanded revenue sources for local government and started working towards replacing the property tax with the infamous poll tax, which was a community charge (tax) on individuals. Recognising that the poll tax would not be popular, the government forced the decision through in 1987, with the conference message: “There are bound to be difficulties, so let’s get them over and done with quickly” (Wilson & Game, 2011).
However, national government grossly underestimated how unpopular and administratively cumbersome this tax would be. After riots broke out following the implementation of the poll tax in 1990, the government was forced to backtrack. The tax was formally replaced with a council tax in 1992 (effective 1993/94), which strongly resembled the property tax system that had been supplanted.
The consequences of the poll tax were however profound and long-lasting, with more than a million voters “disappearing” from the register, while poll-tax rates had to be increased to make up for non-payers, creating a new culture of non-payment. By the time the tax was abolished, the proportion of locally determined net revenue expenditure had been reduced to 15% (53% in 1989/90), and VAT had to be increased from 15% to 17.5% to pay for the collective shortfalls – a policy fiasco by all accounts (see Hart & Demetrius, 2000; Green, 2017; King & Crewe, 2014).
Ultimately, little was achieved, with 63% of local government income received in 2012/13 being from government grants, compared to 65% in 1975/76 (Wilson & Game, 2011; Ellwood, 1998; Government of the United Kingdom, 2014; Dafflon, 2002), even though national government had gone to extraordinary lengths to curb local government spending since 1975.
Within this milieu, the consequences of reduced local independence and discretion – the long-admired hallmarks of English local government – manifested in four areas:
- Decreased local control of finances;
- Privatisation of certain local services;
- Loss of local state autonomy over various service functions; and
- The expansion of non-elected sub-national bodies to regulate local economies.
A more even-handed approach by the Tony Blair Labour government (1997 to 2007) saw increased funding directed to local government, but the Conservative Party, which came into power in 2010 and was responding to the 2008 global financial crisis, acted immediately, and local government endured five years of consecutive budget cuts, totalling 40% by 2015, with an announcement of a further 8% per year for four years (Goldsmith & Page, 1987; Stenson & Watt, 1999; Johnston & Pattie, 1996; Murray, 2014; Rutter, 2015; Goodwin & Painter, 1996; John, 2013).
In terms of public electricity generation, 14 electricity boards were finally privatised in 1989 under the neo-liberal economic policies of the Margaret Thatcher government. This ended all government ownership or involvement in ESI in England, but less than two decades later, municipalities once again got involved in the ESI, albeit on a micro scale. In an attempt to address energy poverty by supplying local-authority properties[10] and to reduce their own consumption costs, several energy companies that provide electricity and heat have been financed or set up by local councils such as Woking, Milton Keynes and Southampton. The success of these efforts has generated interest, but significant barriers exist, such as existing national policy and legislation (Roelich & Bale, 2015; Hetherington, 2013).
3.5 Conclusion
The objective of this chapter has been to extend the discussions around municipal funding and functions, while also providing appropriate international benchmarks against which to view South African local government. This then allows for an informed discussion of the role of electricity in the next chapters, and a comparison against the case study of Johannesburg in Chapter 5.
Indeed, the post-1994 period is particularly pertinent for South African local government, because it is one that is affected by the challenges of both the past and the future. Local government is now elevated to a full tier of government, with a new developmental mandate to address past inequities, but it is still hampered by the timeless challenges of limited income-raising streams, which speaks directly to the Johannesburg case study to come. This period is also one of concerted global focus on the importance of financial self-reliance of local government. This has allowed us to make meaningful comparisons with international practices in terms of imposed, but sometimes impossible local government self-reliance.
Ultimately, the international literature informing this book shows that even though local government functions are more likely to be weakly constituted, and municipal finances are more likely to be under-resourced in developing countries, it is necessary to establish these functions and provide the necessary resources for their realisation. And while the allocation and implementation of local government functions do vary from country to country, all local governments invariably face similar challenges.
Most notable of these is that, in the end, they must yield to central government decisions (funding cuts, policy changes, etc.); and they have limited revenue-raising instruments available to them, as they are generally barred from using national tax instruments to raise revenue. Property tax is by and large the only tax they can claim as their own, and although this tax is reliable, it tends to be inequitable due to its bluntness. Here the research has shown that there are sound economic reasons for avoiding tax duplication between tiers of government, but that the effect on local government finances has been to place municipalities in a precarious position.
National transfers undoubtedly compromise autonomy and are of the first expenditure items to be cut during periods of national belt-tightening – evidenced in England and Norway. It is however necessary to consider what kind of autonomy is appropriate in each territory. It is well understood that South African municipalities have a developmental objective, but they cannot realistically be expected to achieve this without the tacit political and financial support of the other two spheres of government. Sharing and co-managing responsibilities is exceedingly difficult to conceive, to finance, and to implement – a long process which at a minimum must rely on sustainable and robust economic growth and the fair redistribution of national finances. The current situation with South Africa’s municipalities shows that no sustainable response has been found since 1994.
Additionally, poorly considered national policy changes can often wreak havoc at local government level, as seen with the poll tax in England. Thus, it is not surprising that local government, which is expected to provide public-benefit services for which it cannot recoup costs (libraries, public parks, recreation centres), will seize upon revenue-generating opportunities wherever they present themselves, as certainly has been the case with electricity.
- As per definition: Revenue from central government and the authority to raise revenue from local sources are transferred from national to sub-national levels (see Chapter 1.3.2 on page 17). ↵
- The reports are published annually and sourced from NT’s website: www.treasury.gov.za/documents/national-budget/ (accessed 12 February 2021). ↵
- See https://businesstech.co.za/news/government/412459/the-shocking-state-of-south-africas-municipalities-uncovered/ (accessed 12 February 2021). ↵
- Under this approach, a national department undertakes a function on behalf of the municipality (or province). No funds are transferred, and on completion, the infrastructure is ceded to sub-national government which is then responsible for operations and maintenance. Such projects grew from R3 billion in 2010 to over R10 billion in 2016 (NT, 2016a; AGSA, 2016). ↵
- VAT was increased by 1% (14 to 15%) in 2018. In Minister Malusi Gigaba’s words “… increasing VAT was unavoidable if we are to maintain the integrity of our public finances”; this was expected to add R22.8 billion to the fiscus per annum. ↵
- The Carbon Tax Act No. 15 of 2019 came into effect on 1 June 2019. It is to be introduced in two phases. For more information, see https://www.iea.org/policies/3041-south-african-carbon-tax (accessed 12 February 2021). ↵
- It is common practice for political parties contesting municipal elections to make job creation a campaign pledge. For example: “Our manifesto recognises that jobs are created by small businesses and not by government” (www.enca.com/south-africa/damanifesto-promises-recipe-sa-success [accessed 12 February 2021]); and the Johannesburg Metropolitan Police Department’s (JMPD’s) recruitment of 1 500 officers was aimed at “creating jobs while curbing crime” (www.iol.co.za/news/crime-courts/jmpds-recruitment-of-1-500-officers-creating-jobs-while-curbing-crime-8874680 [accessed 12 February 2021]). ↵
- Report of the Weir Committee Appointed to Review the National Problem of the Supply of Electrical Energy, 1926. ↵
- From 1930, the contribution to the relief of rates could not exceed 1.5% of the net surplus revenue of the undertaking, and no sum could be paid to aid local rates unless the reserve fund amounted to more than 1/20th of the aggregate capital expenditure of the undertaking. Any surpluses would be returned to the consumer in the form of lower tariffs. ↵
- In 2016, approximately 2.3 million households in England spent more than 10% of their take-home pay on heating bills (Government of the United Kingdom, 2017). ↵
