4
“Economies rarely get rich on agriculture alone.” — Beattie (2009)
4.1 Objectives and Structure of the Chapter
At its core, this book seeks to contextually understand the challenges faced by the municipal EDI, which evolved in tandem with, and continues to be influenced by, two key factors:
- Government structures (national and provincial); and
- The national ESI and its contribution to the development of the economy; which municipalities form only a part of.
So, it is to the second context that we now turn, because while in truth the ESI of every modern nation is the lifeblood of its economy, for South Africa this is perhaps even more so. Here, the state’s entire economic development and industrialisation strategy was premised on inexpensive and plentiful energy, especially low-cost electricity, providing a competitive advantage. And indeed, the ultimate price of the crucial extent to which the system was dependent on cheap, abundant, electricity, has been borne by the entire economy throughout South Africa’s history as a unified nation (Mohammed, 1997).
4.2 Introduction
Economists broadly agree that a country’s ability to create or attract capital for local investment is what leads to economic development. Countries that do not, or choose not to do so, find themselves in a vicious cycle of poverty. Although each country will follow a different road to industrialisation, certain generalisations can be made (Trapido, 1971, p.50). In the case of South Africa, it was the discovery of diamonds, gold and other metals from the 1860s onwards that catapulted it from a poor, rural context, to a sought-after urban destination for entrepreneurs and skilled migrants. Initially, industrialisation led to high growth rates that peaked in the 1950s and 60s. Then South Africa’s economic fortunes began to unravel. To understand this, over the decades, local and international academics have intensely scrutinised the country’s economy; with much focus falling on the relationship between apartheid and capitalism. In the ideologically polarised world of East vs. West during the Cold War era, this resulted in academic comment and analysis largely following similar divergence. Indeed, South Africa’s segregationist policies, which had a direct, if not overwhelming, influence on the economy, meant that an area of study which ordinarily would have been dominated by economists, was ultimately shared with political writers and historians.[1] And it is here, under the “liberal-radical” debate, where some had postulated that capitalists were not implicit in the apartheid system, with little choice but to comply with, and operate under, prevailing conditions (Nattrass, 1991; Verhoef, 1998; Saunders, 1988), while others disagreed. This chapter now delves objectively into these conditions and the country’s economic development and the role of electricity within them.
4.3 Economic Development up to 1910: How the Discovery of Minerals Changed Everything
4.3.1 Economic Development: Setting the Scene
Feinstein (2005, p.1) attributes South Africa’s economic development to the “unique endowment of human and natural resources … Other countries possessed one or two of the distinguishing features, but only in South Africa were all of them present together”. Feinstein identifies three such key features.
The first was the presence of a large indigenous population, estimated at over 1 500 000 at the beginning of the 19th century. The second was the significant number of European settlers, which grew from 30 000 in 1820 to 1 300 000 by 1913 (Maddison, 2007, p.579). Such extensive European settlement in territories that had a large indigenous population was not the norm. This was not the case in India, most of Asia, and the rest of Africa; while from the outset here, settlers and the indigenous population were intrinsically divided. This had major and enduring implications for the group who ultimately controlled water, natural resources and land. The third of Feinstein’s features was the variety and quantity of natural resources (gold in particular). Until the discovery of minerals, South Africa was a distant backwater with minimal economic prospects (Feinstein, 2005, p.2; Lumby & Coleman, 1983, p.100; Nattrass, 1981, p.23). The economy relied almost exclusively on agriculture, but the land offered difficult agrarian opportunities: low-grade soil; insufficient and irregular rainfall; disease; pests and wild animals; and land disputes with the indigenous population.
The discovery of diamonds and gold was the catalyst that combined these three features and shaped the development and structure of the economy. By being able to convince foreign nationals to invest part of the capital surpluses locally, South Africa developed secondary industries and did not get trapped in a cycle of extraction benefitting only a few Randlords who controlled the diamond- and gold-mining industries (Nattrass, 1981, pp.162–163), as was the case with elite landowners in South America. More than anything else, minerals have dominated the economy, influenced government policy and allowed for the transformation from a solely agrarian to an industrialised economy. This process is now examined more closely.
Agriculture to Mining: Benefitting from Cheap Labour
Dispossessed of their land, the indigenous population could no longer farm independently; thus allowing white settlers to control the labour supply. This they duly exploited, with African farm workers little more than slaves. Then, from 1850, as demand for wool and other products grew in the Cape and abroad, agricultural prospects rose, as did the need for additional labour. Labour-supply issues reached a crisis point when diamonds were discovered in the 1860s and gold in the 1880s, with Africans unwilling to succumb to the settlers or to work for what was being offered. This led to migrant labour being sourced, and as early as 1898, 60% of the workforce was from Mozambique (Nattrass, 1981, p.137). More was needed, and government and employers introduced three mechanisms to induce the local African population to work:
- The implementation of a hut tax;
- The enforcement of pass laws to restrict movement and bind labourers to employers; and
- The continuous reduction of available agricultural land.
By 1911, mines were competing strongly for agricultural labour, with over 260 000 Africans employed by the mines, compared to 360 000 who worked on white-owned farms. Three practices, which developed in the diamond fields, were transferred to and entrenched in the gold mines:
- Skilled labour was the exclusive preserve of highly paid white employees, while manual work was done by lowly paid African staff;
- African workers were recruited as short-term migrants; and
- These lowly paid employees were housed in closed compounds (Feinstein, 2005, p. 63).
Unsurprisingly, the per-capita income of whites in 1915 was 11 times higher than that of Africans (Holborn, 2013, p.10; Bhorat, 2001, p.2; Feinstein, 2005, p.13; Nattrass, 1981, p.139).
Of crucial importance is that, unlike any other gold reefs in the world, which were easily accessible alluvial reefs or veins of metal ore, the reefs discovered on the Witwatersrand (in 1884) had an unprecedented uniformity and continuity in their length and breadth but were not easily accessible or to be found in rich veins. In massive areas, minute quantities of gold were embedded in hard quartz rock extending at an angle from the surface to depths of a few thousand meters. Extracting such gold necessitated substantial quantities of labour.
The difficulty and high cost of mining gold on the Witwatersrand meant that the industry’s formation was vastly different to that of diamonds. Owners of small claims soon realised that they weren’t able to mine viably, and the industry consolidated into nine gold-mining houses which controlled the Witwatersrand Basin. A notable feature was that most of the gold being mined was not being used for industrial or commercial purposes, but to back international currencies; the gold price was fixed at US$20.67 per ounce from 1834 until 1934. Gold producers could therefore not drive up the price, as was done with diamonds, and thus there was no need to compete or enter into monopolistic practices to influence the price. The only way mines could increase profitability was to manage costs, of which labour was the biggest (Ross, 2008, p.72; Feinstein, 2005, pp.93–95; Trapido, 1971, p.55). Here, the discovery of substantial coal deposits in Boksburg (on the Witwatersrand) in 1887 was also of major significance for the successful exploitation of gold, as it lowered transport costs through economies of scale (Lumby & Coleman, 1983, pp.176–177).
The “Poor-White” Problem
With the state and business controlling African employment as a highly cost-efficient labour source, a new emerging challenge was how to deal with the large number of destitute and uneducated Afrikaners who started coming off the land from 1900 until WWII. Partible inheritances and a deep suspicion of alien urban life had kept them on the land for many generations. But constant divisions and subdivisions of farms, and the massive destruction of farmland during the Anglo-Boer War (1899–1902), resulted in the land not being able to support families – forcing people into the towns, where English-speaking whites controlled skilled labour and Africans dominated unskilled labour.
Afrikaners were essentially unemployable and unable to live amongst their fellow whites, but also disinclined to compete with Africans for manual labour. The mining industry was also unwilling to employ Afrikaners as unskilled labourers, as they would not accept what Africans were earning and there was no justification for pay differences between the two for the same work. Such a situation led either to massive pay increases or unrest, both of which were unattractive to business. Bottomley (1993) estimated that by 1924 one in four Afrikaners had become “poor-white” and that this increased to one in two a decade later. The “poor-white” problem would thus dominate church and state attention for the next 50 years, as programmes and legislation were introduced to ameliorate it.
Indeed, the labour division that lasted until democracy in 1994, which was often explained as “skilled whites” and “poorly skilled” or “unskilled Africans”, was not based on race 100 years previously. Unskilled labour consisted of both races and evolved to the present situation by design (Nattrass, 1981, pp.57–58; Bottomley, 1993, pp.1–2; Lumby & Coleman, 1983, pp.23–24; Feinstein, 2005, pp.83–85; Clark, 1994, pp.42–50).
4.3.2 Supplying the Gold Mines with Electricity
Within such a complex context, development of the ESI took a somewhat unique but understandable path in South Africa. Mines needed large and concentrated quantities of power, and most generation focused on satisfying this demand, with little attention paid to residents, especially in towns and cities bereft of mining activity (Cape Town, Bloemfontein, Durban and even Pretoria). Effectively, local authorities, which provided services such as electricity, water, gas, and roads, came to own and operate regional utility companies, while the practice of mines building their own power stations continued for the next two decades (Eberhard, 2007b, p.3).
In 1906, the Victoria Falls Power Company (VFPC) was formed, with the original intention of supplying Transvaal and Rhodesia with hydro-electric power. However, the urgency for power after the Anglo-Boer War, which had desperately delayed the project, ultimately led to the abandonment of the hydro-electric project. In the interim, it was decided to supply the Witwatersrand from steam plants using local coal. VFPC purchased Rand Central Electric Works and the General Electric Power Company in 1907, and had four thermal power plants by 1915, with an installed capacity of more than 160 megawatts (MW) (Eskom, 2009).
This rapid growth through supplying power to the mines, and its success, led to a name change in 1909: Victoria Falls and Transvaal Power Company (VFTPC). That this created a single supreme supplier did not go unnoticed by business and national government, who observed that it “might perpetuate a powerful monopoly” (Conradie & Messerschmidt, 2000, p.44). This threatened the interests of several important groups in the Transvaal (Christie, 1984, p.38) and led to the appointment of a Power Companies Commission in 1909.
Marquard (2006, p.144) summarises the Commission’s findings as: 1) Conceding that there are significant economic advantages to the large-scale production of electricity; and that 2) Private investment could facilitate this; while 3) Supply by the private sector would lead to a “virtual monopoly in a commodity which has become practically a necessity of modern civilisation”. Recognising that it could not build or finance a large power station, the Transvaal government decided not to act against the VFTPC, but exercised control through mandatory licences that allowed for expropriation after 37 years (later extended to 40) – a period considered sufficient for investors to recoup adequate gains on their invested capital (Marquard, 2006, p.146; Conradie & Messerschmidt, 2000, p.44–45; Horowitz, 1994, p.2; Christie, 1984, p.44; Mountain, 1994, p.65).
This was all achieved through the Transvaal Power Act No. 15 of 1910, which was written hastily and passed just three days before the province was amalgamated into the Union of South Africa. It became the basis of government electricity policy in the consolidated country, with requirements of the Act including:
- The establishment of a Power Undertakings Board, which had the authority to license public power undertakings and their supply area; and
- An obligation for licensees to charge uniform rates, i.e., having regulated prices according to a supervised rebate system of annual “surplus” profits, which were re-distributed to consumers on a pro-rated basis of their consumption (Horowitz, 1994, p.2).
The Commission’s report, which led to the publication of the Bill (precursor to the Act), pandered to the requirements of the gold-mining industry, and only then considered compromises to satisfy the needs of lesser groups such as the coal-mining industry and municipalities (Christie, 1984, p.43). Indeed, a proposal in 1907 for Johannesburg municipality to build a power station that would have absolute monopoly of supply within its jurisdiction, was rejected outright by Rand Mines, who believed that ratepayers would be tempted to tax the mines for the relief of rates (Christie, 1984, p.35).
Thus, the Act regulated all power companies supplying electricity to others, but bypassed municipalities who would continue to be regulated by the Provincial Administrators as per the provincial ordinances of 1905 (Mountain, 1994, p.65). The Act also introduced the concept of an electricity “undertaking”, defined as an entity undertaking the generation and distribution of electricity in a specific area.
Local authorities were not required to apply for a licence in their jurisdiction, and other private-sector parties could apply for a licence, subject to this not being vetoed by the local authority. Section 5 of the Power Act excluded large users – mines, railways and government operations – from the local authority’s area of jurisdiction. This provision meant the local authority could not veto such undertakings being supplied by other power generators, which gave VFTPC, and later Eskom, access to its primary consumer base.
Ultimately, the Transvaal Power Act was responsible for regulation, until it was superseded by the Electricity Act of 1922. However, with regards to licences and their attached conditions, the Transvaal Power Act was “effectively preserved” until 1995, as all subsequent legislation recognised the existing licencing conditions between Eskom and local authorities (Marquard, 2006, p.146).
Originally driven by the electrification of resource extraction, the Transvaal Power Act has fundamentally survived until today, by forming and facilitating the following path-dependent processes for ESI:
- Its allowance for expropriation created the foundation for a national vertically integrated utility;
- Cross-subsidisation arose as a financial consequence of uniform tariffs;
- Municipal rights to generate and distribute electricity in their area of jurisdiction eliminated competition, as private companies had to apply for a licence;
- Municipalities could not supply large users (mines, government and railways), even in their jurisdictional area, thereby limiting their revenue sources and compromising the ability to operate efficiently; and
- It entrenched the techno-political “culture” in South Africa (see Jaglin & Dubresson, 2016).
Here, it is worth pausing to revisit the theory of path dependency. As we saw in the Introduction, path dependency suggests that the outcome of a process depends more on its history than on current conditions. Path dependency focuses on identifying specific patterns of timing and sequence, showing the importance of the specific sequence of small historical events which result in significant consequences. It looks at how people and institutions take actions that reinforce stickiness in creating lock-in, from which the institution cannot escape without the involvement of an outside event. Thus, the decisions taken over a century ago to regulate South Africa’s ESI in a specific manner, for very particular reasons, have endured and continue to stifle or block much-needed reform.
4.4 The Union of South Africa (1910–1948)
4.4.1 Creating the Economic Rules of the Game
The Cape, Natal, Orange Free State and Transvaal came together to form the Union of South Africa because they realised it was the only way in which mining could be expanded and Afrikaners re-empowered after the Anglo-Boer War. In return for their loss of independence, and to avoid an over-concentration of political and economic power in mining, it was agreed to allocate a primary national government function to each province. Cape Town (the Cape) became the legislative capital; Bloemfontein (Orange Free State) became the judicial capital; and Pretoria (Transvaal) became the executive capital. With nothing left to offer Pietermaritzburg, the province of Natal was compensated financially and made the agricultural capital of the country, which in reality amounted to little.[2]
Financially, the newly formed Union relied heavily on revenue derived from the gold-mining industry, which was charged a tax to fund the administration and development of the four provinces. This included roads, education for the white population, and other services. Any disruption in the revenue from the gold mines would impact heavily on the Union as a whole (Lumby & Coleman, 1983, p.186); and from 1920, marginal mines started considering hiring African workers for certain semi-skilled jobs reserved for whites.
The white miners would accept pay cuts but not dilute the white-to-African workers ratio, and eventually embarked on a strike (in 1922). This quickly became politicised, and 230 people died in the ensuing violence. Then, with the strike crushed, industry retrenched 2 000 white workers, began using Africans for semi-skilled jobs, and introduced new equipment which greatly improved productivity.
Immediately, mines reaped the benefits and profits returned. But there was a price to pay. The force shown by the government shocked many and resulted in greater support for the NP in urban areas, which up until then had been lacking. The NP, representing rural Afrikaners, formed a pact with the Labour Party. The latter was supported by poor English-speaking workers from the cities. This Pact government won the 1924 elections on a ticket of Afrikaner nationalism and assuring whites that they would not have to compete with Africans for unskilled jobs.
The government’s “civilised labour” policy recognised white trade unions but not black ones, and the Industrial Conciliation Act of 1924 and the Wage Act of 1925 restored the previous racially biased policies and regulations, first started under President Paul Kruger in the Transvaal in the previous century (Nattrass, 1981, p.163; Lumby & Coleman, 1983, pp.186–189; Feinstein, 2005, pp.80–84; Bottomley, 1993; Archer, 1989). Meanwhile, industrialisation intensified, and in so doing constructed an Afrikaner economic power to parallel its political power.
Developing an Industrialisation Policy
Some of the first industries were founded as early as 1910, with the number of factories increasing from 550 to 1 500 in the period 1890 to 1910 (Lumby & Coleman, 1983, p.198). Industry benefitted when European factory output declined significantly with the outbreak of World War I (WWI), leading to increased local and international demand; and also from the introduction of a tariff in 1915 to disadvantage competing imports.
Consolidation and state ownership of railways, through the formation of the South African Railways and Harbours Administration (SAR&H), was followed by the decision to create Escom in 1923 to develop the country’s ESI; providing further evidence of government commitment to industrialisation. In her research on industrialisation in South Africa, Verhoef (1998, pp.17–19) concluded that rapid industrial production occurred after the introduction of import substitution[3] by the Pact government in 1924; which is why after having set up Escom, Hendrik van der Bijl was asked to create the Iron and Steel Corporation (Iscor) in 1928, to further exploit the country’s rich coal and iron-ore deposits.
As a product of this period, much of the manufacturing sector focused on the needs of the mining industry; with foreign exchange, earned from the sale of gold, financing the importation of capital goods and materials to develop the sector. Then, in 1929, the government’s mining engineer classified minerals extraction as a wasting asset, which would decline until it no longer contributed to the country’s gross national product. But fortune smiled in 1931 when Britain left the Gold Standard and devalued its currency, with the gold price going from 84 shilling to 125 shilling; as the US followed suit in 1933 and the price increased by US$14 to US$35 (140 shilling). These events resulted in a six-year expansion cycle for gold mining and over £80 million of foreign capital entering the country (Lumby & Coleman, 1983, p.191). On the back of the gold-mining boom, so too did the manufacturing sector flourish, growing at 9% per annum in real terms from 1936 to 1951; with new opportunities created by the outbreak of WWII and gross output doubling to £400 million (Feinstein, 2005, p.123) within ten years (1939–1949). And the biggest transformation during this golden period for manufacturing was the transition and evolution of the engineering sector, powering this growth.
For the third time, Van der Bijl was called upon to set up a new state entity. The Industrial Development Corporation (IDC) was created in 1940 to “facilitate, promote, guide and assist” (Cartwright, 1971) the development of industry by the private sector through the provision of loans or equity. Tariff protection intensified and expanded, and it was no longer necessary to demonstrate market potential for the tariff to be granted. Industries that benefitted included agricultural implements, electric motors, yarn and cloth, pulp and paper, certain chemicals, and sheet glass.
However, the foundation on which the manufacturing sector rested was not sound. Firstly, the market was just not big enough to accommodate meaningful economies of scale; compounded by the purposeful exclusion of the African population, resulting in an oligopolistic market. Secondly, a key consequence of operating in a market where products were protected by tariffs and import quotas was the low level of efficiency. Here Feinstein (2005, pp.128–130) argues that a system based on discrimination and inequality was carried from the agricultural to the mining sector; and that while these two sectors could operate on a low-skill, low-productivity and low-efficiency basis, this approach could not support the development and sustainability of secondary sectors like manufacturing and construction. Another impediment created by the excessive use of tariffs to protect local manufacturing, as noted by Laight (1955, p.217), was that “despite all sophisticated evidence to the contrary, a policy of tariff protection can be expected to raise the price of these goods upon which duties are imposed and indirectly, the general level of prices and wages”. Thus, mines were paying higher prices for locally manufactured goods. This increased their cost base but could not be passed on to the consumer, as the price of gold was fixed. Paradoxically, the competitiveness, or lack thereof, of the industrial sector, directly impacted the profitability of the mining sector on which it relied and had been specifically created to replace (Feinstein, 2005; Nattrass, 1981 & 1988; Bonner et al., 1993; Lumby & Coleman, 1983; Archer, 1989; Laight, 1955).
4.4.2 Consolidating the ESI to Create a State Monopoly
The Establishment of a Municipal Association for Electricity
Local authorities continued developing their electricity-supply infrastructure to provide residents with power, and up until 1922, the industry was made up of private and municipal enterprises (Horowitz, 1994, p.2). The large number of power suppliers resulted in chaotic conditions, with little legislation, regulation and standardisation; with a diverse range of provincial acts and municipal by-laws governing the ESI. Different supply voltages were used across the country, and many consumers were supplied with direct current (AMEU, 1995, p.11; Steyn, 2001, p.62). To address this, 22 engineers from 17 municipalities came together to form an association to cater for the needs of municipal electrical engineers.
The Association of Municipal Electrical Engineers (known as the Association of Municipal Electricity Undertakings, AMEU, in 2016) was formed in 1915. At the second conference, held in 1917, the 31 members who attended discussed a wide range of topics. Among these were product standardisation, the conservation of energy resources, and most notably, the promotion of standardising income derived from electricity sales. From inception, the Association voiced its disapproval of the local government practice of electricity surpluses contributing to the relief of property rates, referring to it as “licensed robbery” (AMEU, 1995, p.16).
A Fork in the Track: How SAR&H Irrevocably Changed the National ESI
By 1916, the management of all railway lines and harbours in the four provinces fell under one entity, SAR&H. This provided focused impetus to electrify the railroads. In 1917, Sir William Hoy, the general manager of SAR&H, thus commissioned Merz and McLellan Consulting Engineers (MM) to conduct a study on the possibility and viability of railway electrification in South Africa (Marquard, 2006, p.146). The report considered the broader question of electrification and the economies of scale that could be achieved by supplying both railways and industry; warning against a fractured electricity supply, which was believed to have constrained economic growth in England (Horowitz, 1994, p.3); and recommending a centralised approach to regulate and unify electricity supply.
Sir Robert Kotze (who had undertaken the 1909 Power Companies Commission study and participated in the drafting of the Transvaal Power Act of 1910) was tasked with reviewing the findings. His committee supported the conclusions and expanded them to follow the English model, whose aim was to control and regulate the electricity industry.
Factors that the prime minister would need to consider included persistent strikes by miners and municipal power workers, the implementation of racial policies, working conditions, and the effects of WWI. But the real conundrum was set by SAR&H’s Sir Hoy, who stipulated that while SAR&H had no intention of building its own power stations, it was averse to procuring power from private suppliers or electricity undertakings (Jacobs, 1941, p.18).
The railways needed a reliable power supply, which was not certain from strike-prone municipalities. In addition, Hoy did not believe that municipal tariffs would be as “it might be” (Christie, 1984, p.55); meaning that beyond possible unreliability, he also regarded municipalities as potentially expensive, and was thus not willing to build railway lines where the electricity supply was municipal.
The makings of the trajectory to future events were thus in full motion at the time that the report was being written in 1921/22, within the increasingly unstable environment of the time; making SAR&H’s demand for power from a trusted publicly owned utility more likely to convince the prime minister to implement the committee’s recommendations. This took the form of the Electricity Act of 1922, and in Horowitz’s view, reflected the call to secure reliable and cheap electricity supply, particularly for mining and railway electrification, within tumultuous times.
The objectives of the Act were to be achieved through the creation of Escom, whose mandate was to supply electricity to “Government departments, the South African Railways and Harbours Administration, local authorities, companies and other persons carrying on industrial undertakings or to any persons whatsoever in the Union” (Government of South Africa, 1922, Section 3[476]).
The Act also called for the creation of an Electricity Control Board (ECB) to license and regulate electricity undertakings. In future, all electricity undertakings would require a licence to generate and supply electricity. Government departments and local authorities supplying within their area of jurisdiction were exempted from obtaining a supply licence. The Act also established the general principle that Escom’s undertakings “be carried on neither at a profit nor at a loss” (Government of South Africa, 1922). The Act thus set up the institutional structure for the creation of a large, single supplier of electricity for big industry and rural areas, but had to recognise existing municipal producers, who would retain the right to decide on urban electricity generation and distribution.
The Act, whether by design or not, protected the revenue stream municipalities enjoyed from the surplus derived from their MEUs. It also gave them the flexibility to abandon their MEUs by entering into pooling or other agreements with Escom, which many did. Furthermore, the right to expropriate power stations after 38 “plus two” years was confirmed, and Escom was granted water rights and wide-ranging powers such as the right to expropriate land and streets for reticulation and distribution.
Finally, on request, the Act accorded Escom “expert status”. This implied that any extension to an existing, or application for a new, power station by a municipality, could be referred to Escom by the Provincial Administrator. This gave Escom the ability to influence the final decision of a licence-application process based on its own vested interest. If an MEU planned to increase its generation capacity by an amount exceeding 10% of its existing output in any 12-month period, the Act required an Escom evaluation to ascertain whether it could supply ratepayers more advantageously (Government of South Africa, 1922, Section 38).
The Provincial Administrator was not bound by Escom’s recommendations, and in 1936, in advising the Johannesburg municipality, MM believed adjudications would be fair (MM, 1936). This was based on precedents of the Administrator adopting decisions contrary to Escom recommendations, but turned out to be an overly optimistic assessment, as Escom recommendations “invariably carried the day” (Conradie & Messerschmidt, 2000, pp.74–75).
VFTPC Expropriation and the Rise of Escom
The newly formed Escom wasted no time in exerting its authority. It immediately opposed the VFTPC’s application to build a major power station in Witbank, even though Witbank had large quantities of coal, and technical advances in long-distance transmission made such a plant viable. Escom argued that the VFTPC would make large profits at the expense of mines and industry. A compromise was reached whereby the VFTPC would design, build and operate the plant, but Escom would own it. The VFTPC also agreed to share mining revenue with Escom. The plant was completed in 1926, and although very lucrative for the VFTPC, as the company didn’t have to make any capital outlay for it, it was the beginning of the end of the VFTPC’s operations in South Africa. All future power stations were built on this basis, until expropriation was invoked and the VFTPC’s assets were sold to Eskom for £14.5 million in 1948 – the single biggest financial transaction in South Africa at the time.
The expansion of the SAR&H network had provided the base load needed to make Escom’s regional undertakings viable; and thus, by 1948, Escom was the main supplier of bulk electricity in the country (Marquard, 2006; Horowitz, 1994; Conradie & Messerschmidt, 2000). Having essentially disposed of the VFTPC, Escom now turned its attention to the MEUs, which is detailed in later sections.
4.5 The Apartheid Years (1948–1994)
The Golden Years of Gold (1948 to the Early 1970s)
The government, with the help of Van der Bijl, developed a new basis of operation for state corporations: monopolisation of the markets and fragmentation of the workforce, achieved through the physical decentralisation of industry. In this way, the state could control markets and labour (Bonner et al., 1993, p.77; Addleson, 1990, p.102). To this end, the IDC facilitated the creation of monopolies in the industries in which it invested, crushing local competition by being the lowest-cost producer. The IDC also funded the Phosphate Development Corporation (Foskor), which manufactured industrial fertilisers, and then the South African Coal, Oil, and Gas Corporation (Sasol) was set up to convert coal into gas and then gas into petrol. These projects were too large for the private sector and also strategic – providing perceived protection against sanctions.
The diversification of the economy was evidenced by the manufacturing sector contributing more to the country’s GDP than the combined contributions of the mining and agriculture sectors for the first time, in 1954. However, these results were largely driven by a period of sustained global economic growth following the end of WWII and the discovery of substantial new sources of gold and other resources (coal, uranium, copper, iron ore and platinum). The country’s fortunes turned in the early 1970s though, for three reasons:
- The reduction in gold output as mines aged, reducing the much-needed foreign exchange to import capital equipment;
- The global oil crisis and increasing political hostility to apartheid; and
- Undoubtedly and most importantly: the country’s low level of efficiency and high cost of production in the industrial sector. (Feinstein, 2005, p.202; Lumby & Coleman, 1983, p.227; Verhoef, 1998; Nattrass, 1981; Clark, 1994; Laight, 1955)
Apartheid’s Inevitable Economic Collapse (Early 1970s to 1994)
By 1970, South Africa’s industrial structure had experienced significant sophistication. Large sums had been, and were being, invested in the country’s infrastructure. More than 5 000 kilometres of tarred roads had been delivered by the late 1960s, with a further 6 000 kilometres commissioned. Dedicated rail lines serving the mining industry had been built. Escom was in the middle of one of the world’s biggest new build programmes, with 3 500 MW under construction in 1969 and plans underway to add a further 25 000 MW by 1979 (Marquard, 2006, p.155).
Manufacturing too had progressed beyond the first phase of producing consumer goods, to now produce intermediate and capital goods. However, two factors meant it was unable to achieve autonomous growth and independence from mining, and to a lesser extent, agriculture:
- Continued reliance on imported goods and raw materials to deliver final products; and
- The limited international demand for locally produced products.
Thus, industry continued to rely on the foreign revenue earnings from the primary sector. A new strategy was needed.
The 1971 Reynders Commission, appointed to investigate export trade, concluded that the economy would have to re-orientate from import substitution to the promotion of exports – “the country appears to be confronted with a fundamental choice: a lower rate of economic growth or more intensive efforts to increase exports” (Reynders, 1972, p.18). Market-orientated trade policies were accelerated, but instantaneously highlighted the inefficient state of local manufacturing after decades of protectionist government policy (Ratcliffe, 1975, p.45), which masked skill shortages, high costs and low productivity.
If South Africa was to maintain, let alone increase, its exports, its industry needed structural reform. The answer was seen to be greater beneficiation of primary products and developing the capability to produce more sophisticated and competitive goods. Government targeted specific sectors; most notably chemicals, textiles, and the motor vehicle industry, all of which received incentives, tax subsidies and other support mechanisms. However, there was also strong empirical evidence at the time to suggest that export incentives do not necessarily result in increased export or manufacturing volumes (Feinstein, 2005; Verhoef, 1998; Addleson, 1990; Lumby & Coleman, 1983; Nattrass, 1981; Laight, 1955; Reynders, 1972; Ratcliffe, 1975 & 1979; Bell, 1975; Smit, 2009; McCarthy, 1988).
In many ways, dominance of the mining sector in the overall economy had made changes in strategy more difficult. Industrialisation had taken a very particular form, which had evolved and become entrenched. This phenomenon, unique to South Africa, was termed the “Minerals-Energy Complex” (MEC) by Fine & Rustomjee (1996). Under the MEC, industrialisation was driven by mineral extraction and energy generation, with downstream sectors and linkages amongst them developing to support it, including financial services.
4.5.1 The Development of the National ESI under the “Nats”
Phase I: Market Domination and Consolidation (1948–1957)
The year 1948 brought profound change. The NP, or “Nats” as its members were collectively termed, narrowly won the national election. This was followed by the deaths of the chairman of the VFTPC, Bernard Price, and Hendrik van der Bijl.
For the period 1945 to 1959, Escom’s total generating capacity grew from 1 217 to 3 297 MW. The utility’s number-one priority was supplying the mines with cheap and reliable power, on the basis of neither profit nor loss, and this was a key reason why industry supported the expropriation of the VFTPC. The mining industry was thus able to influence Escom’s investment decisions, in a practice that continued until the 1980s. Escom could not build fast enough, and demand often outstripped supply, resulting in power outages. These were managed by emergency rules, supply agreements with the mines, and mutual standby assistance pacts with generation plants owned and operated by municipalities.
During this decade, municipal power supply was valued by Escom, and there was a good working relationship between the two, evidenced by Escom not objecting to any municipal building applications referred by the Provincial Administrator for power stations; most notably, Johannesburg’s Orlando (pre-1948) and Kelvin A and B (post-1948) Power Stations (Eskom, n.d.; Marquard, 2006, pp.152–154; Conradie & Messerschmidt, 2000, pp.105–119; Steyn, 2001, pp.70–73; Christie, 1984, p.155).
Phase II: Escom Takes Control (1957–1973)
Escom’s build programme continued unabated, and generation moved to the large coal fields in the Eastern Transvaal (now Mpumalanga). Existing 60 MW generation units were replaced with 200 MW units. Costlier but more-efficient dry-cooling technology, which used eight million litres less water per day, was introduced with these new units. Escom persevered with its build programme and was rewarded when technology advancements unlocked mining at a depth of more than 1 500 metres. By 1970, Escom’s sales increased by 105%, which included a fourfold increase to municipalities. Moreover, Escom prioritised a national interconnected system, which it completed in 1972, that allowed for mega generation plants to be built adjacent to where the coal was mined (Conradie & Messerschmidt, 2000, pp.113–143).
Escom’s culture of continuous expansion, which created economies of scale, reduced the price of electricity, and it now turned its attention to municipalities, where demand was growing. By its own reckoning, Escom was the designated national generator of electricity and it was no longer prepared to support, or abstain from objecting against, new municipal generation applications submitted to Provincial Administrators.
The 1960s then saw the “right-of-supply” battle between Escom and the large municipalities, who owned and operated their own generation plants, which we detail in the next chapter. Escom, with the tacit support of national government, won. Henceforth, municipalities would retain their distribution rights, but would no longer be permitted to build any new generation plants. This arrangement remains in place, but in 2020 is being contested in court, in what may prove to be a landmark decision.
Phase III: Escom’s Golden Years Quickly Turn to Crisis Years (1973–1985)
Escom’s significant achievements led to hubris. The downturn in the global, and more specifically, the local economic and political climate from 1973, did not deter Escom’s decision to maintain its build-rate plans of 7 to 8%. However, its fleet base was now sizable, which meant bigger and more complex plants. New power stations were also plagued by technical problems and accidents, resulting in additional costs (funded by increased tariffs) and delays (causing shortages and blackouts).
Low electricity prices, to stimulate economic growth, could no longer be sustained, and tariffs started increasing steeply from 1975 – by up to 30% and 45% in nominal terms per annum (Steyn, 2003, p.1). External financing following the 1976 Soweto Riots also became uncertain, and by 1977, electricity cost 166% more than it did in 1971. Another feature of Escom’s approach to tariffs was the absence of a fixed cycle or set date for increases. For example, tariffs would remain fixed for periods exceeding one year, followed by two increases in short succession (Table 4.1). This played havoc with municipal and end-user budgets.
Source: Baasch (n.d.)
Eventually, Escom’s practices became the subject of two commissions of inquiry, beginning in 1977 with the Board of Trade and Industries (BTI) investigating the “suitability of the tariff policy and structure applicable to the supply of electricity in South Africa”. The Inquiry found that Escom and municipalities were under-regulated, and that the ECB lacked sufficient capacity. The ECB was enlarged and its budget increased. The Inquiry also raised grave concerns regarding Escom’s archaic accounting methods, lack of budgeting and management control. Turning to municipalities, the level of profits on electricity tariffs (used for the relief of rates), was also noted.
Decades later, Steyn’s (2001, pp.80–94) analysis concluded that Escom was ultimately able to undermine the BTI findings by asserting that the Inquiry had misinterpreted its accounting practices. It simply responded to the high tariff increases by running at a loss, to be recovered in future years. This tactic only bought time though, and in 1980, high-tariff increases were resumed (Table 4.1). Between 1979 and 1982, the bull-run on gold and the uncharacteristically cold winters increased demand, and Escom had to resort to planned and unplanned power outages, while developing plans to treble its capacity to 70 000 MW at a cost of R65 billion (Steyn, 2001, p.79). These were announced in 1983, but by then the bull-run had ended and the economy was weakening.
Then, the second inquiry into the supply of electricity, under Dr W.J. de Villiers (after whom the report came to be known), addressed concerns regarding increasing electricity tariffs and the amount of capital required for the provision of electricity. The Inquiry proposed, among other things, a new management structure, improved operational performance, and that Escom could no longer operate at “neither a profit nor a loss”. The report was accepted in full by Cabinet on 20 November 1984.
Phase IV: Regeneration (1985–1994)
State President P.W. Botha appointed Johan Maree as Escom chairman in 1985 on the basis of Maree’s vast financial and business acumen, and Dr Ian McRae as Escom’s chief executive; tasking the two with reviving the utility. The De Villiers recommendations were enacted through legislation (Eskom Act No. 40 of 1987, and Electricity Act No. 41 of 1987), and the utility was henceforth known as “Eskom” (a combination of the English “Escom” and Afrikaans “Evkom”). The underpinning objective was to privatise state-owned enterprises; but with the fall of P.W. Botha (who supported the international trend of privatising state assets) and the start of secret negotiations with the ANC (detailed below), this initiative was dropped.
Under Maree and McRae, changes were immediate. The utility’s management culture transformed from engineering-dominated to more balanced and commercially oriented. Between 1986 and 1989, over R2 billion was eliminated from Eskom’s budgets, with the workforce reduced from 66 000 to 40 000 by 1993. Given the political turmoil engulfing South Africa, the combination of cost savings and improved management could not have come soon enough, and eased the tension between national government and the private sector. These successes were important and allowed the new management team to achieve its over-arching objective, manifested in the now-infamous quote: “keeping government out of the engine room”. Politicians were appeased by favourable comparisons when Eskom was benchmarked against international utilities, and when the utility entered into a price compact in 1991 that allowed an initial 9% increase followed by a cumulative 20% reduction over the next five years (Marquard, 2006, p.172; Conradie & Messerschmidt, 2000, p.254; Steyn, 2001, p.110).
In a more balanced assessment, Steyn (2001, Chapter 5) agrees that the reforms visibly improved governance at Eskom. However, the long-standing practice of over-investing in power plants was not stopped, just delayed; and although the other cost-cutting and governance measures helped, it was ultimately the time delay that improved Eskom’s financial state. Of the six power stations being planned, only one, Lekwe, was cancelled.
Years of over-investment in generation plants finally overtook demand, and in 1991, Eskom’s total sent-out rating was 36 228 MW, against a peak demand of 22 342 MW. The first half of the decade saw no growth in consumption, and for only the third time in Eskom’s history, demand declined – by 0.4% in 1992; all while new stations were coming online. Thus began a programme of decommissioning older and more-expensive/less-efficient plants; six plants with a combined 5 000 MW capacity were mothballed by 1991 (Horowitz, 1994, p.13; Steyn, 2001, pp.113–122; Conradie & Messerschmidt, 2000, p.260).
More needed to be done to soak up the excess supply, and a marketing department, established in the mid-1980s, immediately started an aggressive campaign. Agrelek, which targeted farmers, convinced them to switch to electricity for all their power requirements, such as for crop spraying, drying, and irrigation pumping. Then, using Agrelek as a blueprint, Eskom introduced Industrelek (industry), ElektroWise (households), ElektroServe (service and hospitality), and UtilitiMark (bulk resellers). Eskom entered into long-term supply agreements with five municipalities, which displaced 940 MW of municipal generation, at discounted rates. Eskom also offered industry discounted tariffs to increase its electricity consumption and capital expenditure; these cheaper tariffs would apply for as long as Eskom had surplus supply – estimated at ten years. Finally, Eskom entered into long-term supply agreements with large energy-intensive users in the ferro-alloy and aluminium sectors, which would later come back to haunt it, most notably an aluminium smelter in Richards Bay in 1991 and another in Mozambique in 1997 (Conradie & Messerschmidt, 2000, pp.285–287; see Jaglin & Dubresson, 2016).[4]
National Electrification Programme (NEP)
Living conditions for the black population were dire during this period, and a trip to a township by McRae in the early 1980s both appalled and convinced him that such levels of poverty constituted the greatest threat to peaceful political transition. Thus followed multiple undercover and at the time illegal meetings with the ANC (McRae, 2006); and in 1989, McRae announced the utility’s commitment to “electricity for all”. This included a scheme to assist municipalities with the electrification of black townships, declaring a target of connecting one million homes over a period of five years. Eskom’s decision to act in advance of political events was bold, sincere[5] and in alignment with Eskom’s business interests. By supplying a new untapped market, it was simultaneously forging relations and trust with the government-in-waiting, to retain organisational autonomy (“keep them out of the engine room”) (Marquard, 2006; Conradie & Messerschmidt, 2000; Steyn, 2001; McRae, 2006; Bekker & Marquard, 2008).
“Electricity for all” was easier said than done though. Eskom was a bulk supplier with limited distribution to rural/semi-rural[6] and farming communities, and additional, supplementary issues included:
- Regulation;
- Access to communities;
- Vandalism and theft;
- Post-payment resulting in unaffordability and non-payment;
- Cross-subsidisation; and
- Political resistance.
Results were mixed. On the positive side, installation costs reduced dramatically; Readyboards[7] with pre-paid meters improved user budget management; and access to communities was enhanced. Conversely, scepticism remained, especially from provincial administrators who believed a precedent for free electricity was being set. Electricity bills were also bundled into municipal bills and became the target of rent boycotts. As early as 1988, Soweto was already R10 million in arrears, but supply could not be cut, for fear of the political and international fallout (McRae, 2006, pp.88–93).
The most contested area and ultimate Achilles heel though, was Eskom’s old foe, the municipalities. Having taken the initiative, Eskom at first was able to target highly populated urban areas, which had the greatest potential for low-cost connections. And as the electrification initiative gained acceptance and became an imperative, the process started to formalise. For example, the National Electrification Forum (NELF) was formed in 1993, at which Eskom came to an agreement with the ANC that it would electrify 2.5 million homes between 1994 and 1999 (Bekker & Marquard, 2008, p.17).
With the municipalities now inherently involved though, Eskom started to find it increasingly difficult to access urban townships controlled by them. Simultaneously, rural areas had lower densities, higher poverty rates, and consequently much lower consumption levels. So, the benefit of increased connection, according to Mick Davis, former Eskom director of finance, was questionable; and public funds could possibly have been used in a manner that provided greater benefit (Steyn, 2001, p.113).
4.6 Democracy – At Last!
4.6.1 Economic Development
By 1994, the NP had ravaged the economy with its futile attempts to protect apartheid:
- GDP had shrunk for three consecutive years (1991–1993);
- GDP per capita and investment rates were declining;
- There had been a negative balance on the financial account for nine consecutive years;
- The budget deficit was 9.5% of GDP;
- Public-sector debt was 64% of GDP; and
- There was little room for additional spending (Roberts, 2006, p.1).
This then was in part responsible for the ANC adopting a post-1994 neo-liberal economic policy, whose primary objectives were to lower and manage inflation, reduce the budget deficit and support trade liberalisation; abandoning the previous long-standing rhetoric of a centralised economy.
How this evolved, bears closer examination.
Deciding on a Developmental Ideology: The RDP
In 1989, the ANC had few formulated political and economic policies; all were open to interpretation and relied heavily on the 1955 Freedom Charter. During transitional negotiations though, it soon realised it needed to develop a detailed economic policy to respond to concerns of, and pressure by, various groups. This included the ruling NP, with which it was negotiating; the local (white) business community; and the international community, led by the World Bank and the IMF, which espoused neo-liberal economics. A tussle ensued amongst the members of the so-called tripartite alliance, made up of the ANC, the South African Communist Party (SACP) and the Congress of South African Trade Unions (COSATU). Grassroots activists in each organisation continued to advocate a radical economic policy of nationalisation, curbing the power of large national business and limiting the extent of foreign investors’ influence. Work commissioned to develop economic policy between 1991 and 1993 ranged from the Macro-Economic Research Group (MERG), to the Industrial Strategy Project (ISP). MERG provided an alternative approach to neo-liberal economics. It aimed to demonstrate that organisational, technical and infrastructural capacity existed, and that the creation and development of manufacturing exports was a viable vehicle for economic growth. Ultimately, the ANC settled on the investor-friendly neo-liberal-leaning RDP as its official economic policy going into the 1994 elections (Williams & Taylor, 2000; Habib & Padayachee, 2000; Nattrass, 1994a & 1994b; Carmody, 2002).
From RDP to GEAR to ASGISA
Early disappointment in the lack of impact of the RDP saw the ANC introduce its new macroeconomic policy in 1996: the GEAR framework, which, it was planned, would increase annual growth by an average of 4.2%, create 1.35 million jobs by 2000, grow exports by 8.4%, and significantly improve social structures. The policy was however heavily criticised for being developed by a small team of technical experts who did not consult with any parties or share their economic models.
Under GEAR, Carmody (2002, pp.258–259) found government’s approach to globalisation to be contradictory. While the government pursued a much tighter fiscal policy than proposed in GEAR, with tariff reductions exceeding those required by the World Trade Organization (WTO), the Labour Relations Act of 1995 introduced stricter market regulation. This combination of higher labour costs and losing long-held tariff protection, at a time when India and China entered the global trading system on a large scale, highlighted just how uncompetitive and unsuccessful South African industry was at exporting goods. It was an industry enabled by gold mining (Freund, 2010) and “which grew behind tariff barriers and languished there” (Nattrass, 1994a, p.520).
GEAR, then, didn’t even come close to meeting its objectives. Plans to rapidly privatise state-owned enterprises stalled, as investors didn’t step forward and trade unions opposed their sale. On GEAR’s failure, Weeks (1999) concluded that fiscal contraction and high real interest rates were the cause; and Carmody’s (2002, p.256) research found that by 2002, more than half a million jobs had been lost, in contrast to the 600 000 that were to be created.
Next, in 2003, President Mbeki introduced the Accelerated and Shared Growth Initiative for South Africa (ASGISA) to link the two disparate economies created under apartheid (first and third world). Optimistic targets and programmes were included in the policy framework when it was launched in 2006, but these came under immediate scrutiny for offering little that was new, being overly optimistic, failing to create consistency amongst ministries, and having inadequate financial resources (Gelb, 2007; Bell, 2006; Davies & Van Seventer, 2006; Frankel & Sturzenegger, 2007; Hausmann, 2008; Nattrass, 2008). Ultimately, ASGISA never got off the ground, as President Mbeki was replaced in 2008 by President Motlanthe, who was followed by President Zuma in 2009.
A New President with a New Set of Ideas
President Zuma rapidly introduced a planning commission in the Presidency, and formed a new ministry, the Economic Development Department (EDD), which was mandated to develop policy for the Department of Trade and Industry (DTI). This though created the possibility for conflicting policy development, as well as issues around where the balance of power would lie (Nattrass, 2008, p.12). Three major strategy documents were produced:
- The Industrial Policy Action Plan (IPAP) by the DTI;
- The New Growth Path (NGP) by the EDD; and
- The National Development Plan (NDP) by the National Planning Commission.
A review, not a critique, undertaken by the Centre for Development and Enterprise (Kaplan, 2013) found that although all three strategies prioritised employment growth and had some alignment, significant differences existed between IPAP and NGP on one hand, and NDP on the other. The differences underpinned and informed the varying policies proposed by each, and it was crucial that the most appropriate policies be selected if government strategy was to be coherent and effective.
Employment Equity and Broad-Based Black Economic Empowerment (B-BBEE)
Of course, throughout the post-1994 era, the inequity of employment and personal economic development opportunities has remained one of apartheid’s key legacies. The first democratically elected government needed to urgently address this issue in order to ensure that political change also brought tangible financial transformation.
Several pieces of legislation were promulgated to address the domination of whites, and specifically of white males, in the workplace. Of these, the Employment Equity Act of 1998 started the process of providing preferential access for African people,[8] women, and those with disabilities, through affirmative action. And although significant strides were made in state-owned entities and government, this was not to be the case in the private sector. This became a major thorn of emotive contention between public and private sectors.
In this context, the different perspectives on employment equity, a major national debate, are succinctly captured in the findings of a detailed study commissioned by the Department of Labour (Bezuidenhout et al., 2008), which shows two contending arguments. The first states that racial imbalance persists in the private sector, and that an unwillingness to implement national government policy and legislation is hindering employment equity – with high levels of unemployed, mainly African graduates, bearing testament to it. This is then countered by the private sector, which points out that “… the major obstacle to employment equity is the lack of skill among designated groups.[9] Companies that have aggressively implemented targets, such as Eskom, have had to suffer the consequences of rising levels of incompetence” (Bezuidenhout et al., 2008, p.64).
The research for this book has found evidence to support both viewpoints. In short, the public and private sectors are concurrently found wanting in their commitments to genuine transformation and skill development.
4.6.2 The National ESI: To Restructure or to Reform?
Setting the Scene
A change in the leadership of Eskom in early 1994 coincided with the democratic transition in South Africa; Eskom’s board opted to replace McRae a month before the elections (Conradie & Messerschmidt, 2000). At the same time, reforming the ESI was high on the ANC’s agenda. The new government eventually formulated and outlined this reform in 1998 in the White Paper on Energy Policy.[10] This sought to:
- Continue with the electrification programme while ensuring access was provided at affordable rates;
- Improve energy governance through increased government co-ordination and planning;
- Stimulate economic development through enabling legislation; and
- Facilitate the introduction of greater competition.
Its key objectives were to bring about cost-reflective tariffs and regional distributors; and to promote energy efficiency through an integrated planning approach.
Energy policy aligned with government’s overall neo-liberal macroeconomic approach and was aimed at liberalising power generation, to mitigate risks associated with a single-supplier model. The Eskom Amendment Act of 1998 vested Eskom’s equity in the state, repealed its tax-free status, and formed it as a limited-liability company with share capital. The private sector was targeted to generate 30% by 2004, and government signalled its intent by contracting consultants to design an electricity market in which electricity generators, traders, and power purchasers could transact with each other on a variety of platforms and enter into bilateral contracts that ensured fairness to all parties. The market design would facilitate both physical and financial hedging. A transparent and independent governance mechanism would be needed to oversee such transactions. Eskom would recoup its lost revenue through entry into the continent. Figure 4.1 represents the future structure of the ESI as envisaged by Cabinet (Eberhard, 2005b, p.5315).
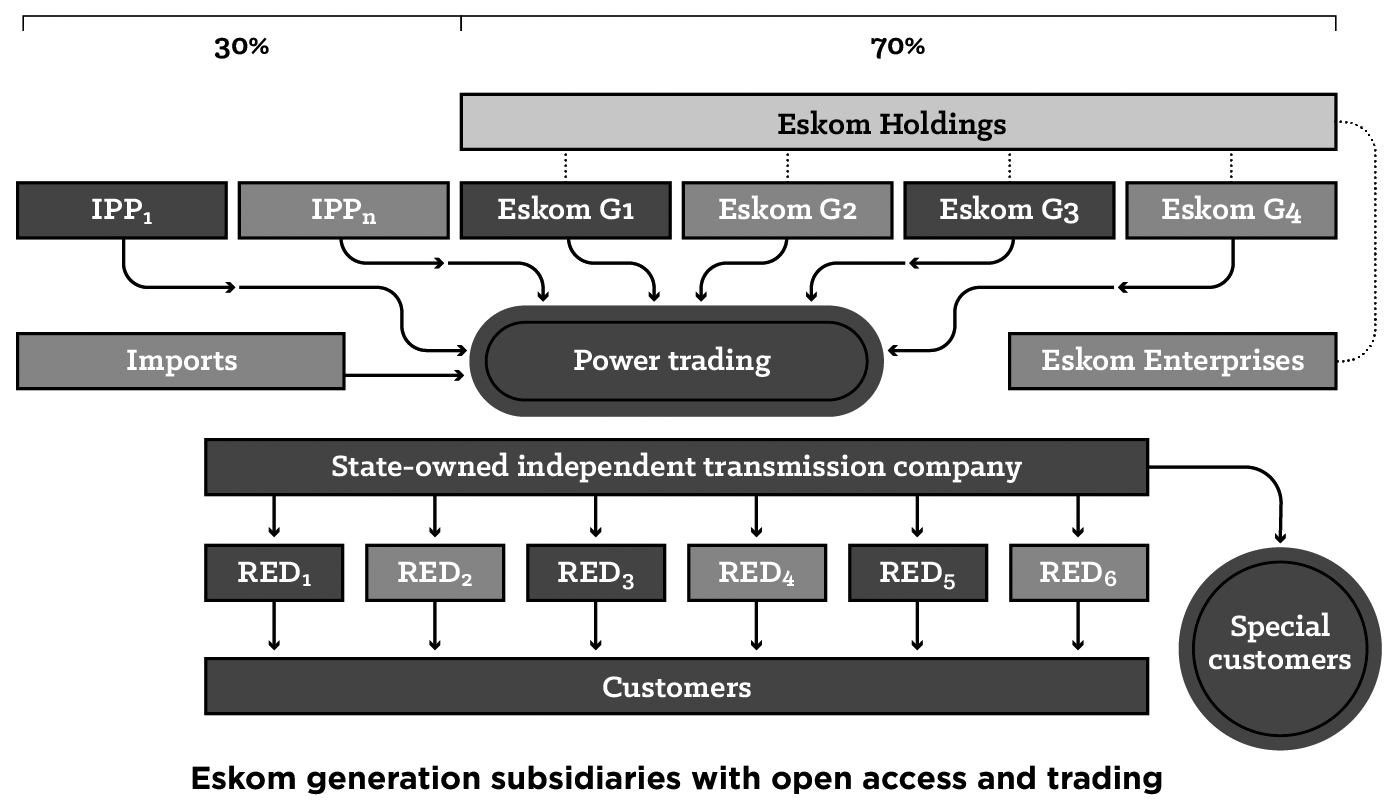
Source: Eberhard (2005b)
Officially, Eskom had to comply with its shareholder’s instruction and began ring-fencing its operations. Internally, however, it was a different story. After many decades of being the only game in town and controlling the ESI, it wasn’t going to go down without a fight – manifested by lobbying at the most senior political level and carefully crafted public statements: “Eskom has the lowest electricity price in the world, and excellent technical performance when benchmarked against the rest of the world. We need clear objectives as to why we are going this route” (Chalmers, 2001).
In this, Eskom found an unlikely ally in organised labour, who objected to the proposed reforms on the ideological standpoint of anti-privatisation and who embarked on national strikes against government’s plans and apparent lack of transparency. The lead union, COSATU, estimated that over five million participated in the action. Eskom’s consumers were also strongly opposed to privatisation plans (Ashe, 2002; Coetzee, 2010), with some fearing the loss of their discount-rate deals. Fate also played a role: the California energy crisis and Enron’s failure in late 2001 was a godsend which strengthened the anti-reform cause. NT announced the postponement of the privatisation programme, and after the 2004 national elections, government announced that Eskom would not be selling assets, but would still seek private-sector power producers to build and operate up to 30% of new supply.
Private-sector investments into new generation did not materialise, though, due to inappropriate legislative frameworks and opposition to privatisation. By this time, Eskom’s reserve margin declined to ~5% in 2004. Something had to give; and it did when demand outstripped supply and the first blackouts were experienced (McDonald, 2009; Eberhard, 2000 & 2005b; Pickering, 2010; Chettiar et al., 2009; Kessides et al., 2007).
National Blackouts and Eskom – “There is No Crisis!”
We shouldn’t frighten ourselves too much. Yes, indeed, there was a problem … but there is no crisis. Whatever needs to be done to make sure that the economy grows and new investors come into the economy is being done. We shouldn’t be holding out as threats to local and foreign investors that something disastrous is going to happen … (President Thabo Mbeki addressing Parliament after the 2006 blackouts in the Western Cape)
It should not even be contemplated that the national blackouts came without warning. As far back as the mid-1990s, Eskom notified government that the existing fleet of power stations would be inadequate by 2007, and that to avoid a supply shortage, construction would need to start before 2000. That this was recorded in the White Paper serves as its tacit acknowledgement. But with a government moratorium in place, Eskom could not act; until in 2005, with the entire electricity system under serious threat and imminent collapse, it was ordered to construct the 9.6 GW (Medupi and Kusile) needed. Unfortunately, 2005 was truly too late. The system, under persistent increasing strain, started to crack, and the first blackouts occurred in Cape Town in November 2005.
Finally, in November 2007, the country ran out of power. Eskom’s neglected plants were failing, and as much as 25% of its 39 GW generating capacity was not functioning (Fig, 2010). This was exacerbated by:
- Low stocks of coal supplies;
- Poor quality of coal;
- Logistical coal-supply issues;
- Heavy rains;
- Insufficient maintenance of power plants; and
- Poor planning and demand forecasting (Chettiar et al., 2009; Kessides et al., 2007).
Load-shedding was implemented nine times in November and December 2007; and national rolling blackouts commenced on 24 January 2008. It took Eskom a fortnight to stabilise the grid, but blackouts continued until June. A national emergency was declared. The economic effect was devastating, with load-shedding costing the economy R2 billion per day (Jaglin & Dubresson, 2016; CDE, 2008; Styan, 2015).
In response, Eskom installed 2 GW of diesel turbines, and it ramped up its Demand-Side Management programme, which had until then existed in name only. As soon as the system was stabilised, however, maintenance would be neglected; and the cycle repeated itself, with the entire system coming close to collapse on 30 June 2014. On 30 October in the same year, Eskom’s biggest clients were instructed to reduce consumption by 10%; while levels of load-shedding were allocated numbers (1, 2, 3 and 4) to better communicate the severity of particular shortages to the public. In total, there were 56 days of load-shedding between January and April 2015, with the minister warning that load-shedding would continue for the next 18 months (Jaglin & Dubresson, 2016, pp.72–75; Government of the Republic of South Africa, 2014).
For Eskom, the financial consequences were as severe as the technical ones were. There were massive budgetary overruns in the construction of Medupi and Kusile, Eskom operated its costly gas turbines for long periods, and its personnel benefitted from high-remuneration packages. With no provisions for new power stations, Eskom turned to its tariffs, as it has always done (Figure 4.2). Between 2007 and 2015, tariffs in real terms increased by 170%, and would have been higher if NERSA had not capped requested tariff increases.[11]
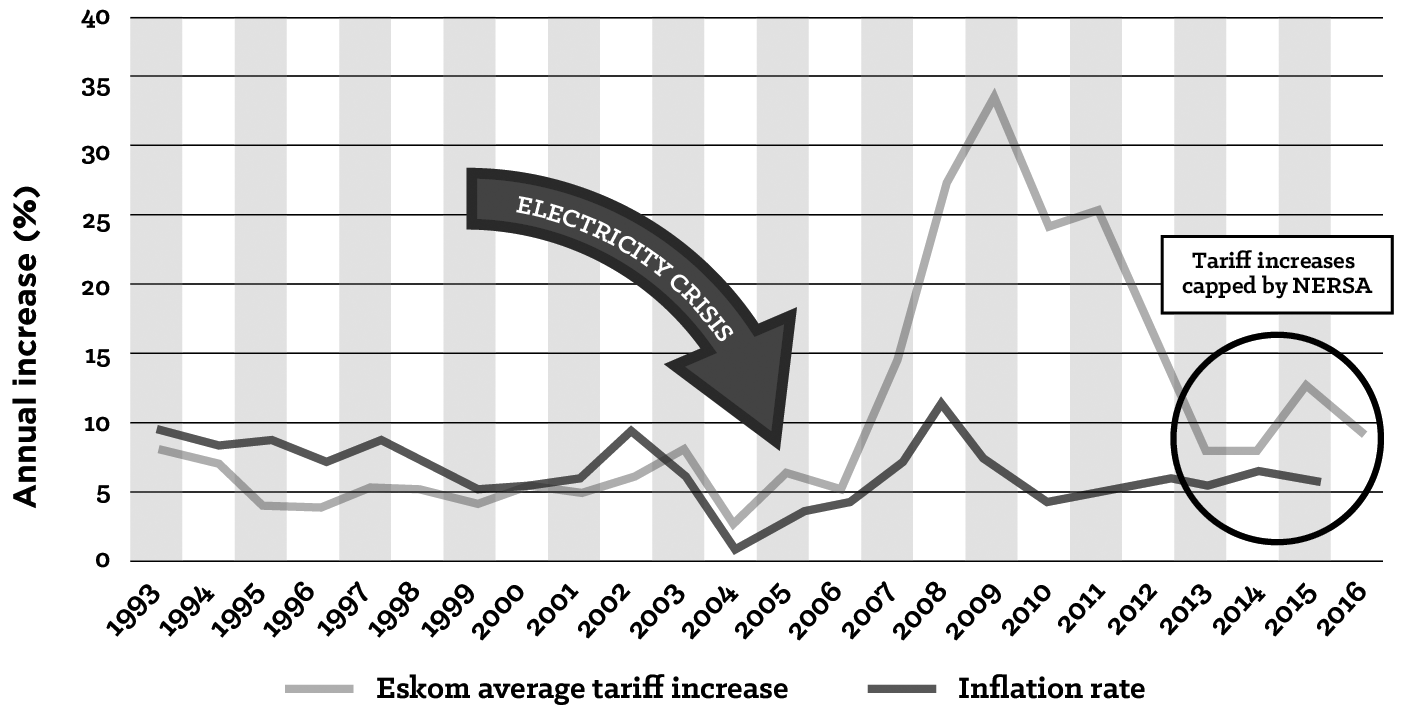
Source: Stats SA and Eskom
Ironically, perhaps predictably, the electricity crisis created the conditions for IPPs to enter the market with Renewable Energy (RE) generation; and NERSA approved a Renewable Energy Feed-In Tariff (REFIT) for certain RE technologies[12] in 2009. In 2011, the programme was taken over by NT and the DoE, who shifted to a competitive bidding process, but with a much larger ambition. Additional mandatory criteria were introduced, namely job creation, prescribed minimum local content requirements (to support local industry), local economic development, and black ownership. Known as the Renewable Energy Independent Power Producer Procurement Programme (REIPPPP), it was well received; by September 2016, 6 376 MW of RE had been procured from 102 IPPs – 2 738 MW of which had been connected to the national grid (IPP Office, 2016). This contrasts with Medupi and Kusile, which were plagued by cost overruns and delays. Medupi was expected to cost R56 billion, but the budget increased to R105 billion; the station’s first unit (800 MW) was initially planned to be commissioned in mid-2011, but this only took place in 2015 (Crookes, 2015). As of December 2016, no additional units had been commissioned.
Eskom in Constant Crisis
Throughout this period, Eskom, and indeed the ministries which oversee it, have been subjected to relentless political interference. Between 2005 and 2017, the chairman of the Eskom board has been changed six times and its CEO ten, while the DoE has had five ministers and the Department of Public Enterprises three. These events have led to a lack of continuity, to instability and a loss of confidence at best, and near catastrophe at worst. In this, Eskom’s crisis can be crudely explained as the realisation of McRae’s fears – government had finally made it into, and taken control of, the engine room (for a detailed account of these events, see Eskom: Electricity and Technopolitics in South Africa [Jaglin & Dubresson, 2016] and A Historical Institutionalist Analysis of the Evolution of South Africa’s Municipal Electricity Sector Within the Broader Electricity Supply Industry [Covary, 2020, Chapter 5]).
4.7 Conclusion
Insofar as countries are unique and each follows its own developmental path, similarities exist and broad generalisations can be made. Seen in this light then, South Africa’s three characteristics of a large indigenous population, a sizable European settler populace, and huge mineral wealth, distinguished it from other resource-rich countries, who only had combinations of these. And although minerals were discovered prior to the formation of the Union of South Africa in 1910, when the British formally exited the scene, their influence on political and economic structure endured.
Since then, as identified in this chapter, three distinct periods have existed, each one controlled by one of the three major population groups:
- The English-speaking white population until 1948;
- Afrikaner nationalists under apartheid from 1948 to 1994; and
- The black majority, through the ANC, from 1994 onwards.
Here the research findings suggest that no ruling group has enjoyed total impunity, as it has always been kept in check by one or both of the other groups; a key consequence of this is that every successive ruling group has usually chosen to adapt existing, and not develop new, policies to prioritise its electorate and interests, entrenching and perpetuating path dependency. This has seen policies and structural frameworks survive, with little or isolated true reform introduced. Together with the stranglehold of the MEC on the economy (although waning), this is possibly the reason why the way “things are done” in South Africa has undergone little transformation. Several systemic weaknesses have repeatedly surfaced over the decades, but responses or solutions have in most cases been superficial, regardless of the population group in control of government. Table 4.2 illustrates how recurring issues present themselves and resurface over time.
| 1910–1948 “English-speaking Randlords” |
1948–1994 “Afrikaner nationalists” |
1994–2016 “Black elites” |
| Labour | ||
| White labour represented by labour unions. Semi-skilled and skilled labour reserved for whites only
Challenge to white labour resulted in a shift to conservative government in 1926 which introduced “civilised labour” Capital and even the state sought to circumvent policy by training Africans Economy restrained by skills shortages |
Entrenchment of pro-white labour policies for the Afrikaans populace through job reservation
Increased mining mechanisation as a move to contain wage costs and disruptions Agricultural and mining model of low wages and labour exploitation transferred to industrial sector (unsuccessfully) Economy restrained by skills shortages |
Employment equity and Black Economic Empowerment (BEE) to address misalignment of the labour market
Black unions align with political parties to influence policy. “Decent jobs” as official mantra, with the policy of wage protection over job creation Unemployment rises from 20% in early 1990s to 25% in 2014 Economy restrained by skills shortages |
| Finding: For well over one hundred years, government labour policy has favoured one racial or cultural group over others. Notable is that under apartheid this practice was exclusionary and indefensible, whereas under the democratic government, it is necessary and morally appropriate; but to a large extent inappropriately implemented and manipulated. As a result, the country has always created elites (often undeserving) at the expense of the broader population, thus excluding full economic participation. Another enduring, and confounding, policy priority, is targeting “high wage – high productivity” under a Porterian model,[13] over a labour-intensive one (Nattrass & Seekings, 2015). This excludes the majority, while the continuous upliftment of skilled workers widens inequality. Skills shortages are, and continue to be, a weakness of the labour market | ||
| 1910–1948 “English-speaking Randlords” |
1948–1994 “Afrikaner nationalists” |
1994–2016 “Black elites” |
| Industrialisation | ||
| Mineral wealth recognised as a “wasting asset”, necessitating the need to develop a viable secondary sector
Government embarks on creating an enabling environment for this through Escom, Iscor, IDC, etc. Industry is supported by import substitution and trade tariffs |
Decentralisation, supported by incentives, to create economic activity in rural areas, with limited results, as firms are unable to operate profitably without subsidies
Government report recommends a switch from import substitution to export orientation |
Being a member of the WTO means trade liberalisation and tariff removal
There are some winners, but most companies are unable to compete without trade protection, in a situation exacerbated by Indian and Chinese manufacturing |
| Finding: South Africa’s industrialisation is inextricably linked to the MEC, while non-MEC production is largely uncompetitive, with limited scope for exports. The removal of tariffs demonstrated just how reliant firms had become on them. The small size of the market and selective government support of certain industries has led to an oligopolistic market structure | ||
| Current-account deficit | ||
| Finding: In all three periods, the economy has relied on inward foreign investments to balance its foreign-exchange requirements, creating regular flashpoints and destabilising the economy when investors withdraw large amounts of money on short notice. Mining, and less so agriculture, are the country’s bedrock of net foreign exchange inflows. The current-account deficit in 2015 was 5.4% and 4.4% of GDP in 2014 and 2015, and averaged 4.11% of GDP for the period 2005 to 2015.[14] The foreign-exchange inflows fluctuate due to the cyclical nature of commodity prices, but ultimately their contribution is diminishing | ||
| 1910–1948 “English-speaking Randlords” |
1948–1994 “Afrikaner nationalists” |
1994–2016 “Black elites” |
| Electricity | ||
| All generation, transmission and distribution brought under state control. MEUs cannot supply users of more than 25 kVA in their area of jurisdiction | Escom starts a massive new build programme. Tariffs rise sharply to fund capital expenditure, and government intervenes after industry protests | White Paper (1998) calls for reform and competition. Programme stalls due to labour protest and lack of government commitment |
| Finding: Eskom controls the ESI, and its taking control of municipal EDI is not inconceivable, with it having threatened to cut off defaulting municipalities and take over their operations. Its policy, supported by national government, of using residential sales to subsidise commercial and industrial tariffs, aligns with developed country models, which is contrary to developing country practices. In 2011, industry and mines accounted for 77% of sales but generated only 67% of revenue (Thopil & Pouris, 2013) | ||
| Path-dependent mechanisms | ||
| Economy: A young country shifts from an agrarian to a mining economy, to exploit its resources. Inevitably, the multiplier effect of the positive feedback loop[15] (self-reinforcing actions) locks (amplifies) economic development to the MEC
ESI: VFTPC, and then Escom, must generate new and large quantities of power for the mines, pursued through economies of scale. The multiplier effect kicks off Escom’s long-term modus operandi of continuous build; in a positive feedback loop |
Economy: Economic growth during the first period emboldens unsustainable policy – positive feedback loop. The economy suffers from international and national pressure. Government responds by attempting to maintain equilibrium – negative feedback loop, i.e., actions to maintain the status quo
ESI: With continuous build now entrenched in its psyche, it is business as usual for Escom; the utility does whatever is needed to grow its generation capacity – pointing to a positive feedback loop |
Economy: The economy has changed little since 1994. Globalisation has exposed structural inefficiencies and an uncompetitive environment – evidenced by low growth, high unemployment and inequality. Reform and innovation exist in small measure, with stasis dominating to maintain equilibrium; in a classic illustration of a negative feedback loop
ESI: Reform avoided through poor implementation and Eskom’s and labour’s influence. From 2000, incessant political interference has led to decline, inefficiency and corruption – a positive feedback loop |
This chapter has demonstrated the extent to which politics, the economy, government, and the ESI (inclusive of EDI) are inextricably linked. And that the complexities are of such magnitude that any attempted changes to EDI in future, which are anything more than superficial, cannot be considered in isolation. Ultimately, it is an intricate and interlinked situation, and now that we have a clear picture of it and the context it exists in, we can move on to our ultimate focus – municipal ESI.
- See Freund (2018). ↵
- As explained by Dr Thornhill in his interview with the author. ↵
- Import Substitution Industrialisation (ISI) is a trade and economic policy which advocates replacing foreign imports with products that are produced domestically. ISI is based on the premise that a country should attempt to reduce its foreign dependency through the local production of industrial products. ↵
- The two smelters consuming as much as 5.5% of Eskom’s total generation became controversial when the country suffered blackouts and tariff increases of over 300% in five years, while the smelters continued paying the tariffs agreed to in the 1990s. At the 2014 tariffs, the smelters would be uneconomical. The cost to Eskom was estimated at R11.5 billion in 2014. Although there were initial benefits, the net effect has been a cost to the economy, and it has only been viable through what is effectively a state subsidy (Allix, 2014). ↵
- A dedicated electrification department was established in the distribution division, with an electrification manager appointed in each of its sections to ensure the achievement of targets (Steyn, 2001, p.112). ↵
- With the exception of Tygerberg (Cape Town), Sandton, and Midrand (Transvaal), which started out as farms but would go on to become urbanised over time. ↵
- A mini-distribution board equipped with circuit breakers, earth-leakage protection and plug points. ↵
- The Act defines “black people” as a generic term for Africans, coloureds and Indians. ↵
- The country’s higher and tertiary education systems continue to produce graduates and graduands of varying employability depending on the institution they attended. Several universities lost their accreditation for a Bachelor of Commerce by industry bodies in the 1990s (Bezuidenhout et al., 2008). In 2017, Bachelor of Laws degrees at 17 universities were reviewed, and four of these institutions were served notice that if standards were not improved, accreditation would be withdrawn (see www.derebus.org.za/withdrawal-accreditation-response-universities/ [accessed 15 February 2021]). ↵
- The White Paper was heavily influenced by the findings and recommendations of the Electricity Restructuring Interdepartmental Committee (ERIC). ↵
- In 2013, Eskom applied for a 16% annual average tariff increase for a five-year period, but NERSA capped this at 8%. This figure was revised upwards to 13% in 2015 and 9.4% in 2016 when Eskom requested a review. ↵
- Solar photovoltaic, solar thermal, concentrated solar, and wind. ↵
- Professor Michael Porter’s Five Forces Model is a framework for analysing a company’s competitive environment. It states that a company’s profitability is dependent on 1) the number of its competitive rivals; 2) the number of potential new market entrants; 3) the power of its suppliers; 4) its customers; and 5) the threat of substitute-products influence. Since its publication in 1979, it has become one of the most popular and highly regarded business strategy tools. ↵
- See https://data.worldbank.org/country (accessed 23 April 2021). ↵
- This approach provides an alternative description of path-dependent mechanisms, through the concepts of self-maintaining and self-reinforcing structures. The theory is drawn from the natural sciences, which it uses to explain how a system moves from an equilibrium to a non-stable state. The most cited example of this is that of temperature change, which has been adopted by political science as the analogy to explain the theory and will be used in the explanation that follows. Before providing a description of each type of loop though, with temperature as the analogy to describe it, it is necessary to list two characteristics identified by Knapp (2007, pp.3–5). The first is that both positive and negative feedback loops may operate simultaneously, particularly when various actors have different interests or resources. The second is that despite similarities or ability to co-exist, their long-term dynamics and responses to change are radically different. A negative feedback loop is described as a self-maintaining or self-correcting mechanism vying for a stable condition (homeostasis). Like a thermostat, whose objective is to maintain a set temperature, it responds to external forces of hot and cold by acting in the opposite way – switching itself on when the temperature drops and off when it rises. Thus, it acts to counterbalance, not reinforce, changes. Customary examples include central banks’ standard and universal response to inflationary pressure, the tightening of credit policies, or politicians adjusting future policy changes to align with constituency needs prior to an election. Baumgartner & Jones (2002) point out that negative feedback is always necessary in an equilibrium model and is therefore a part of all neo-institutional analysis. Without it, political interests “would gather ever-increasing powers until they overwhelmed the entire political system”. Knapp (2007) illustrates this from the perspective of vested interests, where elites would move to restore equilibrium if their interests were to come under threat. Knapp draws on North’s (1990) seminal work to emphasise that self-maintaining structures with common interests may still diverge in development, as actors move to exploit the rules. Thus, the system is able to select non-viable structures, be they inappropriate or past their usefulness – implying that negative feedback supports institutional survival of the fittest – a state that rational choice institutionalism, through its functionalist view, seeks to identify and eradicate (Williams, 2012; Knapp, 2007). Turning to positive feedback loops, we now consider the concept of self-reinforcement. In contrast to counterbalancing, positive feedback is a self-reinforcing process which accentuates or amplifies a trend. Observing this process over time will identify the clustering of events, along with large and unexpected changes. Baumgartner & Jones (2002, p.15) state that “seemingly random initial events can lead to a cascade or a spiral of subsequent events that dramatically change the status quo”. Here, the multiplier effect forms the basis of path-dependence theory, as decisions become locked-in, making their reversal costly and complex. Examples of positive feedback include economies of scale and increasing returns (Pierson, 2000, p.252). Left unchecked, this leads to an unstable system of cumulative advantages and self-destruction (Williams, 2012; Baumgartner & Jones, 2002). In Pierson’s view, political and social structures are far more prone to be characterised by positive feedback – producing path dependence – as compared to economic structures. Reverting to the analogy to illustrate the point, in a state of self-reinforcement, the system would be fitted with a reverse thermostat. Such a thermostat would not submit a signal for the heat source to be switched off in response to an increase in the temperature, but it would do the opposite. It would turn up the heat, increasing the temperature even more, and it would shut off the heat source if the temperature was low. This means that positive feedback loops can amplify historical events, such that small interventions can change events significantly, resulting in multiple outcomes. It is the set point of the thermostat which becomes key, as rooms with identical structures, but different set points (histories), display diverging developmental trajectories (Knapp, 2007, p.4). ↵
