5
“The relationship between municipalities and Escom had been a love-hate one. Escom loved to have the municipalities’ extra capacity on hand in times of crisis, but loathed the way the big municipalities were seen to be taking advantage of the situation.” — Conradie & Messerschmidt (2000, p.138)
5.1 Introduction
The previous chapters explained why MEUs were constantly “under siege” from their political masters (at local, provincial and national level), as well as, to begin with, VFTPC, and then Eskom. This chapter demonstrates how this played out by identifying the political, technical and financial obstructions that these institutions placed in MEUs’ way, and the outcomes of this. Here it should be noted that in all of this, MEUs, as operating entities, also had to deal with everyday trading conditions and normal operational necessities – technology changes, economic up- and down-turns, staff competency, and many others. We also consider these in this chapter, using Johannesburg – the country’s financial centre and biggest city – as a case study.
Stylistically, the research presented under each of the time periods is anchored around the primary theme affecting the municipal ESI at the time. From 1910 until 1948, it was the relief of rates; from 1948 until 1994, it was Escom’s battle for rights of supply; and in the final period (from 1994), it was the challenge of providing electricity for all.
5.2 Historical Backdrop – Up to and Including Union (1910)
With the exception of Johannesburg and Kimberley, numerous attempts to establish municipal government in the interior between 1850 and 1900 failed, largely due to a lack of financial viability (Green, 1957). It was under British control that municipalities were formally established – most of which came into existence in 1903 – across the Transvaal. The town engineer was responsible for all public works under municipal governance. Most of the early engineers were trained via the apprenticeship system (Mäki, 2013).
The Cape Electric Light and Telephone Company was formed in 1879, and the country’s first electric lighting appeared in Cape Town’s railway station in 1881; this lighting was extended to Table Bay Harbour by 1882. From there, the demand for electricity grew across the country and “by the turn of the century most independent electricity generation plants, for one reason or another, had been taken over by the local municipalities. The result was that municipalities generated most of their electricity … [a] practise which endured for many years” (AMEU, 1995).
5.3 The Union of South Africa (1910–1948)
5.3.1 Municipal Finances and the Policy of Using MEU Revenue to Provide Rate Relief
Provincial government controlled municipalities via ordinances, which is why local government functions varied across provinces. The newly formed South African government borrowed greatly from the British structure, and from Union (1910) onwards, municipal financial self-sufficiency was strictly enforced, regardless of the pressure placed on municipalities by, for example, natural population growth and urbanisation. For example, by 1937, Johannesburg had consistently balanced its municipal budget since Union without any contribution from national government (Maud, 1938, p.290). Furthermore, 68 years after Union, on average, national government grants to municipalities made up just 4.7% of municipalities’ total revenue (Solomon, 1983, p.58).
The provision of trading services, such as electricity and water, was allocated to local government. The two major revenue sources for municipalities became property rates and the surpluses generated from the charges for these services. Here, the sale of electricity generated the bulk of surpluses. In the early 1940s, based on gross receipts, fees from trading services accounted for almost 60% of total income, while property taxes contributed 25%, and the remainder (~15%) was from other sources (Cowden & Holmes, 1969, pp.123–124).
There were two categories of services provided by municipalities:
- Pure public goods, which are non-excludable and non-rivalrous. This means that individuals cannot effectively be excluded from their use of the service, and one individual’s usage of it does not reduce its availability to others. Classic examples include street lighting, parks, footpaths and flood control.
- Quasi-private (or common) goods. These are services that can be charged for based on consumption – units of electricity, litres of water, cubic feet of gas, kilometres travelled, etc. Quasi-private goods have characteristics of both private and public goods.
Figure 5.1 and Table 5.1 show how municipalities started cross-subsidising activities by using positive revenue contributions, such as electricity, against loss-making services, such as transport. The extent to and the speed with which the Johannesburg municipality started using contributions from services to subsidise property taxes, pursuing an indirect over a direct taxation policy, is also evident. By 1935, indirect taxes contributed as much as 77% of the municipality’s total revenue. Property ratepayers also benefitted from the city preferring to impose special rates for specific purposes (such as a road levy, and amounts for water mains extensions and for the use of the tram), over increasing property rates. Figure 5.1 may also demonstrate the uncertainty and difficulty associated with property tax collections. Annual increases or decreases of over £100 000 were not uncommon, as can be seen, and this cannot be explained by the policy of keeping rates as low as possible. Electricity and water provided far more reliable revenue sources, where disconnection for non-payment is relatively straightforward (Randall, 1938, p.412).
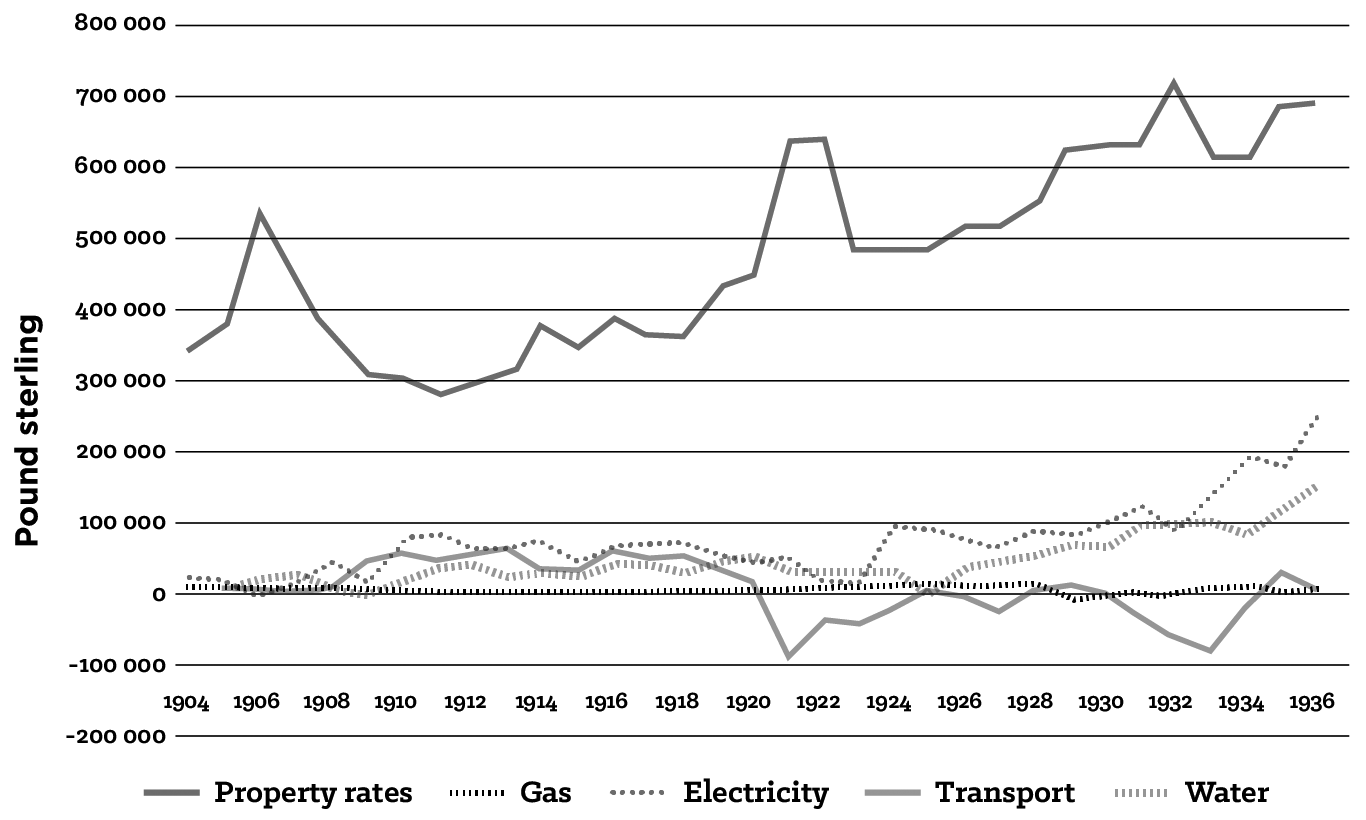
Source: Randall, 1938, p.411
Randall (1938, pp.410–411) was very critical of the city’s practice, which he claimed was nothing less than a tax, and not a “good one”, as it was “inequitable and disguised, but probably recommends itself partly because the bulk of the citizens do not realize that they are being taxed, and therefore do not object”. In his paper, Randall goes on to warn against keeping property rates artificially low by maximising the surpluses from the trading undertakings to the greatest extent possible. It was viewed as unsustainable, and it was thought that the policy needed to be reversed. A more equitable distribution, through higher rates, could not be reasonably challenged by rate payers. A 1935 commission of inquiry, which reported on municipal power stations, stated:
… the profits of the electricity department … allocated in relief of rates, unduly favour the ratepayers at the expense of the consumers. They are unreasonable from the point of view of the users of electricity, and uneconomic from the point of view of industrial and general development of the city. (Maud, 1938, p.114)
Relief of rates was not unique to Johannesburg and was practised by all municipalities. The question that arises is: Why was it pursued to the extent that it was? Certainly, part of the answer is, as Randall notes, that the users of services were exploited. However, there was strong political will to retain this practice, which prevails in present-day 2020. I posit that this was yet another practice inherited from the British system of local government, which aligned with the interests of landowners and which became entrenched even though the British removed it in 1947, because of the autocratic structural governance framework.
In South Africa, the right to vote in national elections was limited to white males,[1] and even greater limitations were placed on who could vote in municipal elections. This right was highly prized, and the failure of a qualified voter to exercise it was viewed as a breach of civil duty; with authorities printing a list of delinquent voters in the local papers. In the Transvaal, Ordinance No. 8 of 1912 (repealed by Ordinance No. 2 of 1914) required a “property qualification” for voters. The report of the 1921 local government commission of inquiry called for this ordinance to be re-established, as “only responsible citizens with a real stake in the municipality should be entrusted the franchise” (Cloete, 1978, pp.119–123). The recommendation was not adopted but illustrates two things:
- The British system was replicated; and consequently
- The privilege and power that property owners enjoyed.
The Cape Province kept the municipal voters’ roll limited to property owners for a much longer period, until as late as the 1950s.[2] Thus, in addition to surplus revenue from undertakings, users were being charged a tax they were not aware of. This arrangement was also in councillors’ interest, as minimising property taxes would ensure the support of the electorate. The practice continued even when the vote was extended to all white citizens, as property owners were likely to carry the greatest influence and provide financial support to political parties.
5.3.2 The AMEU and the Policy of Using MEU Revenue to Provide Rate Relief
Contextual Background
The policy of using municipal undertakings’ revenue to provide rate relief did not enjoy universal local government support. Many were against it, not least of which were the electricity undertakings, whose operations were undoubtedly making the biggest contribution to the relief of rates.
The topic was first raised as early as the second AMEU[3] convention in 1917, and came up regularly for discussion thereafter – in 1927, 1929, 1935, and 1936. The issues raised at each convention centred on concerns of what was believed to be the unsound policy of allocating “net surplus profits” from electricity undertakings for the relief of rates. Indeed, by 1937, the AMEU had succeeded in drafting a policy recommendation for the Provincial Administrators to consider, with the objective of inspiring legislation that placed a limit on this practice. In its original form, the recommendation was based on the UK’s Electricity Act of 1926, but after a heated debate the proposal was watered down significantly. As it turned out, the recommendation only made it to the Administrator of the Cape Province, and was promptly postponed when the municipality itself objected.
The topic of relief of rates was consuming an inordinate amount of time at annual AMEU conventions in the build-up to the 1937 policy paper, with highly charged discussions having to be ended by the chairman, and always with no mutually agreed outcome. Typically, but not always, the MEU delegates opposed the practice, whereas municipal councillors’ interests lay in appeasing their voters, who did not want to see their property taxes rise. It was therefore decided at the 1936 convention that the AMEU needed to adopt a formal position at its next convention.
The section below provides a summary of the AMEU executive committee’s rationale for opposing the practice of relief of rates, followed by responses received from delegates, both for and against the practice.
Summary of the AMEU Paper Presented at the 1937 AMEU Conference Analysing the Policy of Rate Relief and Outlining the Association’s Position
The paper, prepared and presented by Councillor James, addressed the topic by breaking it down into themes, under each of which the advantages and disadvantages of the practice are considered. To maintain the integrity of the paper, the below summary maintains the original format and then concludes by detailing the various responses put forward by the delegates.
General Considerations
From a MEU perspective, rate relief is defined as the act of literally using electricity undertakings to relieve ratepayers of the need to pay the full amount necessary to balance the general fund revenue for municipal services, by extracting lump sums from the electricity undertaking. It also includes the provision of public and inter-departmental electrical services at less than cost. Electricity is no longer a luxury only accessible to an affluent few, but has become a necessary requirement for the health and general well-being of a community. Similarly, for industrial activity to provide employment and economic well-being, it is a requirement that electricity supplies are made available to a virtually unlimited extent, at low cost. Alternatives to electricity do exist, but are generally less convenient and have a diminished security of supply. However, charging inflated prices to cover other expenditure raises the likelihood of a loss of business. The objective of the electricity undertaking is to provide the service at the lowest-possible cost, and dividends are received intangibly through the increased valuation of the district served, and not necessarily in cash. Additionally, higher tariffs ignore the needs of the poorer sections of the community. Indeed, the inordinate temptation of “easy money” from electricity sales has prompted other countries to introduce legislation to control such action; making the AMEU’s 1937 attempt to embolden such legislation consistent with global practices.
Equity
It is not equitable for electricity users to unwittingly contribute to total municipal expenses. The greater the usage, the greater the contribution. All ratepayers are not necessarily electricity consumers, but all electricity consumers are ratepayers, either as owners of property or through the rent that they pay. Ratepayers may own large tracts of land using no electricity, whereas a family must pay rates and for electricity. It is thus unsurprising that owners of large rental properties and undeveloped land stand to gain the most from, and are the most ardent supporters of, the policy. A figure of 14.5% is quoted as a real-case example of the contribution towards the relief of rates. In other words, the price of electricity is 14.5% more expensive than it should be, in order to pay for other municipal enterprises.
Financial Security
Municipal reliance on revenue from electricity undertakings has become so convenient that in certain instances the amount taken exceeds gross profit, resulting in a deficit being carried forward. This practice will undoubtedly put future development of the undertaking at risk; in extreme cases, it will risk the undertaking itself. This has been due either to councillors not understanding the consequences or councillors having so little regard for the undertakings. The relief of rates is only possible when there is a surplus, which is a true one – after allowance has been made for external charges, such as redemption (repayment of an investment or a debt on or before its maturity date), interest on loans, and most importantly, depreciation and obsolescence of plant and equipment, which are often overlooked or subject to variation on personal opinion. It is the way that these three items are treated that makes such sizable amounts available for the relief of rates.
Electricity undertakings operate in a rapidly changing environment, where improved technology is constantly introduced. This could lead to equipment having to be replaced during its working life, and undertakings must be financially prepared to do so. The transfer of money for rate relief rather than being put back into the business, leads to the situation where undertakings must secure loans to finance new equipment and operations, adding interest costs and further necessitating tariff increases. This practice is akin to raising loans indirectly for the relief of rates, the legality of which is questionable. Here, additional minor arguments for ratepayer relief include that on account of ratepayers effectively standing as guarantors, loans are secured at a lower rate. This too is refuted by the AMEU executive on the basis that it is in the ratepayers’ interest and that financial institutions are already very willing to loan funds to electricity undertakings.
Rewards to Ratepayers
The relief of rates practice is supported by the argument that ratepayers are entitled to a return on their investment, as they ultimately stand as guarantors. The argument is rejected on the basis that the ratepayers are only liable for interest on the capital invested in the undertaking, which of course, benefits the district and in turn their investment. But even if it is accepted that the ratepayers as investors are entitled to a reward, it can be argued that their reward consists of them becoming owners of an asset for which they have not paid anything. This takes the form of the increased valuation of their properties due to the prosperity which the supply of electricity has brought. The advantage to ratepayers is maximised by supplying electricity at the lowest-possible price and operating the undertakings in a prudent financial manner, rather than reducing monthly rate payments.
Legislation
The problem of rate relief is not unique to South Africa. In England, legislation in 1926 was introduced to place a limit on this practice. In New York, a proposal to aid rates from municipally owned electricity undertakings was rejected outright on the basis that it is the private sector’s purpose to obtain profit. Public undertakings are created and operated for the well-being of the population, and although it is a requirement that undertakings are properly managed, consumers must not pay a higher tariff to benefit ratepayers.
Turning to South Africa, the Electricity Act of 1922 requires Escom to regulate its charges at its various undertakings to operate at neither a profit nor at a loss. Other licensees (notably VFTPC) are required to distribute 25% of their surplus profits to their consumers.
Although no legislation exists for municipal undertakings, a draft ordinance was published in the Cape Provincial Gazette on 19 May 1936.[4] It allowed for a portion of net surplus revenue from electricity undertakings to be used for the relief of rates, but limited it to 1/20th of the total capital expenditure of the undertaking (the same level as stipulated in the Electricity Act of Great Britain of 1926). Furthermore, if transfers are deemed excessive in the opinion of the Provincial Administrator, the Administrator can direct that no further contributions be made for a specified period thereafter without written consent.
Conclusion
Relying on profits from undertakings for the relief of rates is a doubtful practice, as it is an unreliable form of taxation because profits vary from year to year. An overreliance on this revenue source is likely to create municipal funding problems if electricity sales or profits drop. Additionally, using electricity profits to fund unprofitable or risky municipal enterprises discourages the enterprise itself from maximising profits. Electricity undertakings should be run on business principles, and the provision of services to the municipality itself should be at market rates and without subsidy. This principle should apply to all municipal services undertakings.
Delegate Responses to the Official AMEU Position on the Policy of Rate Relief
Table 5.2 captures the essence of what were lengthy, polite, but pointed responses, in favour of and against the practice. Two things can be surmised from the responses:
- The delegates had strong views on the subject, creating conflict; and
- A glance at the responses, both from this conference and others (before and after), confirms that, typically, MEU delegates (technical) supported the removal of the practice, and councillors (political) opposed its removal.
| Municipality/Delegate | Comment |
| Support the removal of rate relief from MEU funds | |
| East London | Practice equates to an indirect tax
As electricity undertakings are natural monopolies, they are exploiting their position Concern that technological advances may more readily result in the replacement of electricity if it is too expensive Electricity profits used for rate relief must be limited to a small percentage, with consumers enjoying lower tariffs |
| Johannesburg | The views of the Town Council (politicians) do not coincide with that of their financial advisers and engineers
Ratepayers should receive relief subject to a limit, which should be “somewhat higher” than the caps applied in other countries. Reserves for obsolescence should be maintained Before appropriations are made, consideration should be given to the reasonableness of electricity tariffs |
| Pretoria* | Does not encourage prudent accounting, such as provision for depreciation and obsolescence
Artificially high electricity tariffs harm a city’s competitiveness Experience from England shows that the practice was abused and necessitated legislation Many councils have terminated the policy from other undertakings (gas, water). Why is it done for electricity? The Electricity Act effectively nationalised the industry, is an admission that it is a public utility needed in modern life and therefore must be provided at lowest cost |
| Cape Town | Failure to match loan periods to the useful life of equipment is effectively raising loans for the relief of rates. Proper and prudent accounting is crucial |
| Port Elizabeth | Larger electricity consumers do not benefit from the relief of rates |
* The delegate from Pretoria stated the arguments from both camps, but personally believed that the surplus contributed to rate relief should be limited to 2% of the outstanding debt of the undertaking per annum.
| Municipality/Delegate | Comment |
| Support the policy of rate relief from MEU funds | |
| Bloemfontein | Escom’s efforts to curb MEU profits have become an obsession
Municipalities are trading concerns which are required to provide functions and services. Some of these are unprofitable by their nature, but as they are vital and necessary, they are provided. By not using the funds available from profitable undertakings, the city is forced to raise loans or increase its taxes. Either way, the consumer is in the same position, as a cheaper electricity tariff is offset by a higher tax rate. It is a vicious circle and what is given with the one hand is taken away by the other |
| Pretoria | Ratepayers stand as guarantors for the undertakings and rightly deserve a return
Services lose money, break-even or make money; but they must be provided, necessitating a “swing-and-roundabouts” approach If profits may not be used, ratepayers will refuse to pay higher rates for services that are operating at a loss Sales are increasing, suggesting that rates are not too high and do not hamper industrial progress Electricity is no longer a luxury and thus can be taxed. This reduces direct taxes, such as income tax Municipal undertakings do not pay taxes, yet use available infrastructure (roads, buildings, etc.). Relief of rates is a way of contributing |
| Stellenbosch | The issues cited do not apply to municipalities supplied by Escom. These towns also have limited prospects to attract industry, thus profits from electricity allow rates to be kept at a level which encourages new buildings, which expands the revenue base |
| Durban | It is municipal policy to maximise profits on electricity sales and use the proceeds for rate relief
Preventing this practice will only result in councillors finding another way to tax the electricity undertakings Even though it is an indirect tax, it is very thinly disguised and must be exploited to the fullest |
| Municipality/Delegate | Comment |
| Neutral | |
| Escom | Councillors and engineers should not be pitted against each other, as both should be working to achieve the same objective – the progression of the city and not their individual departments
Possibly too simplistic to state that what the one hand gives, the other takes away Municipalities distribute surpluses to subsidise rates; only to take loans when there are shortfalls. Reserve accounts should be kept; these could be used to finance capital projects and called upon when needed The impact on small, medium and large consumers must be considered Undertakings must charge their municipalities on a cost or cost-plus percentage basis for own consumption |
Source: AMEU, 1937, pp.77–106
After robust and lengthy debate, consensus could still not be reached, and the discussion was abandoned. A sub-committee would be formed to investigate, and would present its findings at the 1938 conference.
How the Debate Ended
Little changed in 1938 and 1939, and all discussions were postponed indefinitely due to the outbreak of WWII (AMEU, 1939).
For the 1945 convention, the AMEU president proposed that national government be approached directly. The real issue was the relationship between central and local government. Over the years, municipalities had been required to undertake additional functions, which they did not believe was their responsibility and for which they received no additional income. Being so hard-pressed for money, the municipal treasury was often forced to act in the way that it did. The situation deteriorated to the extent that the Institute of Municipal Treasurers and Accountants was preparing a report that was to be submitted to the Minister of Finance. Consequently, a meeting was held with the four Provincial Administrators, and an overhaul of the municipal system was the expected outcome. The councillors’ proposal was adopted (AMEU, 1945).
The 1946 AMEU convention concluded that the practice would not be reversed and decided to change their approach to one of “damage limitation”, where the relief of rates was done in a financially responsible manner, which would not put the electricity undertakings at financial risk. This message was to be communicated to the United Municipal Executive (UME) (AMEU, 1946). Any hope of changes to local government functions and the financing thereof ended when the ruling party lost the national elections in 1948 and the NP came into power.
Tracing and providing an accurate account of these events demonstrates how the now path-dependent self-reinforcing practice of relief of rates rapidly entrenched itself, whose benefits, a hidden tax, were of such magnitude that opting out or transforming became increasingly unlikely. Furthermore, an accurate account of the concerns raised by those who opposed it allows for an evaluation of what has come to pass. In other words, it becomes possible to determine how prophetic these assertions were some 80 years later, through a counterfactual analysis.
5.3.3 MEUs: Development and Operations up to 1948
This section details how municipalities first started generating and distributing electricity, demonstrating how the MEUs developed utilities in their own right.
The first attempts at the bulk supply of electricity in Johannesburg were nothing short of disastrous. A concession, for electricity and gas supply, with land, was granted to a private company in 1888. The company went bankrupt before any generating equipment had arrived, and it was acquired by the Johannesburg Lighting Company in 1891. This company did not fare much better. The council expanded its own generation, but this too failed and the project was shut down in 1907. The municipality then entered into an agreement with VFTPC for the supply of 1 700 kW, but failed to enter into long-term supply agreements. Finally, the municipality built a new generation plant of 13 MW (in 1911) and announced that it was “practically equal to all demands made upon it”[5] (Maud, 1938, pp.111–114).
By 1923, more generation was needed, and the municipality approved plans for a new £550 000 power station. By then, however, the Electricity Act of 1922 was in force which required that applications for all new power stations, or extensions, be submitted to the Provincial Administrator. The Administrator was compelled to ask the newly created Escom to sanction or oppose the application, but was not obliged to follow Escom’s recommendation. Escom did not support Johannesburg’s application, and proposed three alternative power supplies for the city.
The Johannesburg Electricity Undertaking (JEU) outmanoeuvred Escom by making piecemeal extensions, each one small enough to not require the Administrator’s approval (MM, 1936). The turning point came when VFTPC was not able to adequately meet the needs of the mining industry, and a reciprocal supply agreement was concluded, where the JEU would supply VFTPC during the day (when the mines needed the most power) and vice versa in the evening, when the JEU’s demand peaked. The Administrator, against the wishes of Escom, approved Johannesburg’s application for a new power station in January 1928 (Maud, 1938, pp.116–118). Johannesburg’s insistence on own supply centred on three issues:
- Continuity of service;
- Financial considerations; and
- Local industries and consequent value to its ratepayers.
The first issue concerned the high incidence of power outages from the long-distance overhead transmission from Witbank. The consulting engineers also calculated that it would be of greater financial benefit to the city if it generated its own electricity. By this time, the city had become accustomed to, and reliant on, the profits generated from its electricity trading – the returns from 1912 to 1924 were 120%. Finally, the city wanted the annual money spent on wages and stores to be kept in the local economy (Sankey & Clark, 1925).
The new Jeppe Power Station, construction of which began in 1927, used a 10 MW turbo generator; it extended its capacity three years later with two more 10 MW generators. Plans for an additional plant were only approved by the Administrator with the reciprocal supply agreement between VFTPC and JEU. A major overhaul of the Jeppe Power Station facility was undertaken between 1935 and 1939, resulting in a total generation capacity of 114 MW. In 1939, the JEU was granted permission to build the 300 MW Orlando Power Station in Soweto. Delayed by WWII, it only came into operation in 1945 (Fraser, 2008).
The reciprocal supply agreement was mutually beneficial, as Johannesburg’s electricity was entirely integrated into the greater Witwatersrand system, allowing the two supply companies to assist each other during shortages. This is the most likely reason that Escom did not object to Johannesburg’s application to build the Orlando and the Kelvin A (1957) and Kelvin B (1962) Power Stations soon thereafter, as at the time, Escom was struggling with shortages (Conradie & Messerschmidt, 2000, p.137). This co-operation agreement, as we will see, ended as soon as Escom stabilised its supply. By 1959, Johannesburg had 570 MW of generating capacity and sales of 1 350 GWh (Christie, 1984, p.162).
5.4 The Apartheid Era (1948–1994)
This section of the chapter consists of three distinct parts. The AMEU minutes from the early 1950s provide a record of the development of the municipal ESI under apartheid. Indeed, during this long period of NP rule, there were three dominant themes relevant to this research, which the municipal ESI was grappling with. Accordingly, the research is structured to reflect this. The first period (1955 to 1969) deals with rights of supply. The second period (1971 to 1988) covers the municipal ESI’s era of distribution. The final period of just seven years (1988–1994), considers the industry’s response to and preparation for the democratic national elections. The final section then undertakes a detailed examination of Johannesburg’s municipal finances and electricity surpluses.
5.4.1 MEUs: Development and Operations
By the 1950s, the AMEU was meeting biannually. These gatherings were attended by municipal electrical engineers from all the major cities and towns that generated electricity and/or had an electricity undertaking. Smaller towns increasingly opted to outsource their electricity requirements to Escom as the utility’s new generation plants came into service. The larger municipal undertakings, especially JEU, operated fully integrated utilities, and did not see themselves as electricity distributors.
Period 1: Rights of Supply (1955–1969)
30 November 1955: It was reported that the ECB[6] had agreed to give municipalities the right to supply electricity to areas outside their area of jurisdiction, subject to certain conditions. Johannesburg did not accept the ECB conditions and formed a sub-committee to address the issues with the ECB.[7] Pretoria had a policy of charging higher tariffs in rural areas and the ECB required them to provide justification as to how the tariffs were derived. Cape Town charged rural users the city tariff plus 20%. The ECB wanted all undertakings to apply a standard formula for rural users; the AMEU’s rural-tariffs sub-committee submitted a proposal but received no response.
The AMEU clarified the definition of “undertakings” in November 1956 as: “A local authority carrying on an electricity supply undertaking”. “Supply” included generation and distribution.
In 1957, the ECB notified all municipal undertakings that henceforth any supply to an industrial customer greater than the 150 kW allowable limit needed to be approved by the Ministry of Economic Affairs – representation and the submission of an application for each connection would be required. The AMEU rejected this outright and would request a meeting with the minister.
April 1958: The ECB responded that the proposed conditions would be modified, but provided no further detail. Attempts to meet with the minister yielded no results. The ECB referred the AMEU to the provincial secretary, who did not reply. A sub-committee was formed to discuss the matter with Escom directly, in the hope that the matter could be resolved amicably.
The feedback at the November 1958 meeting was that Escom had been contacted, but no response had been received and it was unlikely that one was forthcoming. The AMEU decided to report the matter to the Institute of Municipal Treasurers and Accountants, which represented their interests at the Borckenhagen Commission meetings.
May 1959: The theft of copper had become an epidemic, and a request was to be made to national government to review laws. Municipalities opting to take their bulk supply from Escom stated that their finances were adversely affected by Escom’s practice of increasing tariffs at very short notice, as this additional cost had to be absorbed until the next scheduled annual tariff increase. It was proposed that Escom increases be passed on to consumers immediately.
October 1959: The participants heard that the Borckenhagen committee had postponed their meeting. The ECB had not finalised the revised conditions but agreed to provide temporary permission to municipalities to extend reticulation to rural areas.
May 1960: The AMEU had received the revised conditions for supply to rural areas from the ECB and raised the requirement of a uniform tariff as an issue. Rural tariffs had to be divorced entirely from municipal area tariffs, as they could not be brought in line with municipal tariffs due to different cost structures and voter pressure groups. Additionally, it was patently unfair to expect a local authority to invest in a distribution network only to allow Escom to decide to supply any users whose load exceeded 150 kW. It was confirmed that the meeting with the Borckenhagen committee was set for 30 November 1960.
April 1961: The AMEU committee accepted the ECB conditions, which maintained the 150 kW supply limit, to supply customers outside their area of jurisdiction, but did not accept this as an internal restrictive condition.
November 1961: The sub-committee findings were that Escom and the undertakings were essentially competitors when it came to supplying industrial customers within a municipal area of jurisdiction.
May 1963: It was agreed that a committee, which would collaborate with the Institute of Municipal Treasurers and Accountants, would submit a memorandum to the fifth Borckenhagen Commission.
November 1964: The committee agreed to support the UME proposal that the Electricity Act of 1958 be amended to compel users situated within the municipal area of jurisdiction to take supply, if available, from the municipal undertaking. The Ministry of Commerce and Industry communicated that it would not support this proposal.
October 1965: With Orlando Power Station, JEU’s upgraded peaking plant (a plant that generally only runs when there is a high demand), and Kelvin A and B Power Stations all operational, Johannesburg started planning for the future. MM were appointed to evaluate the available options, and delivered a series of reports. The first report, revised with updated figures (MM, 1966), focused on two strategies, which they called Basis A and Basis B. In terms of Basis A, it recommended that the city avoid or delay the construction of a new plant by taking supply from Escom. Basis B considered zoned supply, where Escom would take complete responsibility for supplying a zone of the city, with additional zones added as required. Basis A and B were evaluated against a simultaneous study on the economic viability of the JEU building a new plant (MM, 1965). The study, using a growth rate of 7.5%, estimated that maximum demand would grow from the 594 MW recorded in 1965, to 1 420 MW (5 700 million kWh) in 1978. Estimating future output and the extent of derating of existing power stations, and determining acceptable standby requirements, it was calculated that if the JEU opted to build a new power station, it should be sized at 1 000 MW. The conclusions of the study were that a zoned supply (Basis B) was the least financially advantageous option and would also introduce transmission and distribution difficulties. A bulk supply from Escom would provide a financial benefit to the city until 1974, the expected completion date of the new plant, and a net saving could be expected by 1978 which would stabilise at approximately R1.75 million per year in 1980. The report considered the future supply and price of coal, transport costs, and bulk-tariff costs before recommending that the city build a new generation plant at Liefde-en-Vrede. It would need to be started by June 1966 for the unit to be in service in March 1971. City management accepted the recommendation and submitted an application for a new power plant to the Provincial Administrator (JEU, 1966).
A delegation met with the minister on 23 August 1967, but it was only granted one hour, and only three items were addressed:
- A proposed amendment to the Electricity Act, providing as a matter of right the opportunity for a municipality submitting an application for a generation licence to respond to any comments or objections made by Escom. The minister agreed to this but Escom came forward requesting that they too have the right to respond to the reply.
- Local authorities be represented at Escom and the ECB. The minister’s view was that this was unlikely to be approved, as it would set a precedent for other ESI participants to claim the same right.
- A request for the ECB to report to the Provincial Administrators rather than Escom. Under the existing arrangement, it was difficult for the municipalities to conclude anything other than that Escom representatives protected their own interests in their reports – acting as consultants, competitors and as an interested party, all at the same time.
Mr R. Leishman, general manager of the JEU, demonstrated that Johannesburg could generate electricity at a cheaper rate than the bulk tariff that Escom charged the city and that the municipality would be using sewage water for as much as 80% of the power plant requirements, whereas Escom used fresh water only – a 1956 study concluded that water would be a limiting factor to the country’s economic development (MacKay et al., 2003). The city further requested that, should municipal borders be extended, electricity supply become an automatic right, subject to the outcome of a negotiation with Escom.
The minister would only make two promises:
- To give local authorities the opportunity to reply to points made by Escom in its reports to the Administrator; and
- That local authorities retain the right to generate electricity, but only if they could show that they could do it cheaper than Escom could.
The minister undertook to put these two points in writing and respond fully to the memorandum that UME submitted, but he did not follow through with this (Giles, 1968).
At the May 1968 AMEU meeting, Mr Leishman stated that the minister’s failure to respond was causing serious delays to its application for a new generation licence. It was agreed that a “reminder” letter be sent to the minister and Provincial Administrator. Mr Leishman also advised the AMEU committee that the city had decided to institute legal proceedings and would approach the Supreme Court to approve its application.
November 1968: Shortly after the release of the Borckenhagen Commission report, the minister responded,[8] stating that he would adopt the Commission’s pronouncement that “the country’s requirements of electricity should be undertaken by Escom”. In reaching its conclusion, the Commission stated that no evidence had been received from local authorities. Leishman disputed this, stating that the Commission had not requested any evidence on municipal electricity generation. It was resolved that the UME be requested to arrange a follow-up meeting with the minister, with the requirement that he be properly briefed and that it not be limited to a short session.
June 1969: Reporting on the outcome of a meeting held in Margate[9] (which came to be known as the Margate Convention) between all affected parties to resolve the rights-of-supply issue, the AMEU had agreed to accept the minister’s proposal of “probably the best solution to the problem”. Municipalities henceforth accepted that Escom would become the de facto bulk supplier and generator of electricity, leaving distribution to municipalities. In return for the loss of revenue, municipal distribution borders would be extended, subject to an agreement reached between Escom and each municipality. The Margate Convention was the event where local authorities relinquished their right to generate electricity.
In the 1969 Annual Report of the City Manager: Electricity Department, Johannesburg (JEU, 1969, pp.1–4), Leishman confirmed that the Provincial Administrator, following the directive of the minister, had turned down Johannesburg’s application for a new 1 000 MW power station for the third time, on 14 April 1969. The city explained that it never contended that it could generate more cheaply than Escom, but that the bulk-supply rate offered by Escom was higher than the cost of self-generation. The city attempted to get an assurance from Escom that tariffs would not increase by more than a third over a period of 15 years (coal costs excluded), but Escom would not agree to this. Even though the lawyers felt that there was a high chance of the Administrator’s decision being set aside, it was decided to take bulk supply from Escom, as demand was growing and the plant could not be built before demand would exceed supply. Leishman took early retirement the following year. Having fought so hard for so long, the loss was crushing, and he lost his will to continue.[10]
Period 2: A New Business Model – Era of Distribution (1971–1988)
MEUs had to adjust to their diminished role of distribution and accept that they were now price-takers with limited bargaining power. They reduced their generation activities to nursing their existing power plants to eke out every kilowatt of power. In the next two decades, the relationship between Escom and municipalities was characterised by less acrimony and greater co-operation, but mutual tension was ever near.
September 1972: Escom agreed to support the AMEU application to the ECB to remove the 150 kW supply limit to industrial users. During the period 1973 to 1977, there was much discussion and debate about the interpretation of how Escom-owned distribution infrastructure should be valued, based on the recommendation of the second Borckenhagen report. The AMEU felt that they were represented in an unsatisfactory manner by the UME and decided to approach Escom directly. This yielded better results, but unexpectedly and contrary to the commitment made in 1972, Escom reversed their decision to remove the municipal 150 kW supply limit to industrial users. A furious AMEU submitted a new application to the ECB to have this condition removed. In response to complaints about frequent tariff increases with no notice period, Escom stated that it was not able to provide a six-month notice period.
November 1977: Escom notified municipalities that they could expect load-shedding to take place.
October 1981: Escom requested that the notice period for tariff increases be reduced from three months to one month. This was rejected by the AMEU, who stated that three months’ notice was the absolute minimum.
In 1973/74, JEU had entered into a bulk-supply agreement with Escom when its plants were no longer able to meet demand. Later that decade, the JEU commissioned MM to undertake two reports. The first evaluated how the city’s power-supply system (MM, 1979) could be best used to maximise profits from its existing plants; and shield its users from excessive Escom tariff increases, Escom changes to the tariff structures, and frequent outages. The report analysed usage patterns, forecast future consumption for planning purposes, and discussed how to maximise the Orlando and Kelvin plants. The study reported that maximum demand would increase from that recorded in 1978, 1 066 MW, to 3 189 MW in 2000; this could be reduced to 2 839 MW through energy-efficiency measures (load control and higher tariffs). The second report (MM, 1981) investigated the viability of new generation opportunities, including unconventional options. The study concluded that it was not economically feasible to build a replacement power plant at Orlando. Peaking plants were found to be uneconomic and to have too many technical barriers. Likewise, pumped storage opportunities (a type of hydro-electric energy storage used by electric power systems for load balancing) were too small, and the alternative technologies they investigated were not viable. The best option, the report concluded, was for the JEU to invest in extending the life of their existing fleet for the longest period possible.
August 1984: The AMEU made representation at the De Villiers Commission. The advisability of a standard tariff for users would be considered, and AMEU representatives would attend national workshops on township electrification.
September 1986: Escom agreed (relented) to fixed annual increases on 1 January 1987.
November 1987: Eskom approached the AMEU to market electricity jointly. Support and training would be provided at branch level, with an undertaking that future strategies be worked on jointly, to which the AMEU agreed.
February 1988: Eskom provided an assurance to the AMEU that a maximum demand charge would not be levied on MEUs that still generated electricity.
Period 3: Quo Vadis? – Preparing for a Democratic Government (1988–1994)
The statement that the distribution industry has not been “capable” of supplying electricity to those who need it is incorrect and objectionable. The distribution industry was not allowed to do so by Government policy. (AMEU Response to Department of Mineral and Energy Affairs Report on the Development of the EDI, November, 1992 [AMEU, 1992])
By 1988, Eskom had transferred most distribution areas to municipalities, but these were taken back when the utility began supplying townships and rural areas with electricity (Marquard, 2006). Both Eskom and MEUs were operating in a highly charged and uncertain economic, political and structural environment. P.W. Botha’s privatisation plans, strongly supported by the minister, meant the entire ESI was nervous.
The 1989 AMEU conference in Cape Town was themed “Quo Vadis?” (“Where are you going?”), and was part of a broader strategy to define the Association’s objectives, mission and function, in response to the above challenges. A discussion following the opening address saw the Eskom representative (Botes, 1989) state that it was inevitable that the ESI would be rationalised. The AMEU’s response was immediate. An extraordinary meeting on “Rationalising the ESI” was held one month later on 10 November 1989 (AMEU, 1989). AMEU members were incensed:
… municipal electricity undertakings have been running well and ESKOM was looking to off-load non-paying black areas …
… how would ESKOM supply electricity to black areas, as they neither have the manpower [n]or [the] resources to do this efficiently[?] …
… combined venture as proposed by ESKOM … would mean that industry will subsidise black areas …
With delegates having vented their frustrations, the discussions changed tone and members confirmed their commitment to electricity for all, requesting a meeting with Eskom for an official clarification of their interpretation of rationalisation of the ESI. Less than three months later, with the government now under F.W. de Klerk, it was announced that Eskom was not considered as a suitable candidate for privatisation (Conradie & Messerschmidt, 2000, p.263).
Eskom was given a reprieve, but the future of municipalities remained uncertain. In October 1990, the Thornhill Report was released, and it became evident that things were changing, and MEUs were about to encounter major structural changes.
From 1990 until the 1994 elections, the regionalisation of EDI dominated discussions. During this charged and uncertain period, the stakes were high. Consultation extended beyond the traditional industry participants of government, AMEU, ECB and Eskom. The AMEU had to position itself in the ongoing NELF discussions, which had multiple and diverse stakeholders,[11] who the AMEU was not accustomed to or familiar with. The AMEU had to reach consensus amongst its constituents, which was not straightforward, as members had different political affiliations. Ultimately, the AMEU accepted that regionalisation[12] of some form was necessary, and it communicated this externally.
January 1991: Eskom’s introduction of Time of Use (ToU) to large customers led to a shift in usage and a loss of revenues for municipalities (see Figure 5.6 on page 152), which was to be recovered from households. The AMEU lobbied Eskom (unsuccessfully) for the ToU tariff to be based on a daily, and not a monthly maximum. At a meeting, it raised concerns that Eskom had applied to provincial government to start distributing electricity to urban African residential areas, with the view of taking control of this market. Essentially, Eskom was planning to compete with municipalities, which was contrary to the Margate Convention. Municipalities were encouraged to take steps to protect their client base.
June 1992: The AMEU and Eskom met to discuss tariffs:
- They resolved to agree on the extent to which Eskom would be allowed to influence municipal tariffs;
- Municipalities would support standardised tariffs, if Eskom would do the same;
- The development of regions around nuclei was acceptable, on condition that in time these regions would come under government control;
- There was a need to apply ToU tariffs to household electricity usage; and
- National inclining block tariffs would be introduced.
September 1992: The AMEU attended the inaugural NELF workshop,[13] where electrification and the restructuring of the EDI were debated. The AMEU recognised the need for both but noted that vested interests were likely to resist change and that local authorities were best placed to undertake distribution. The AMEU once again put forward its views, held from the 1930s, that surpluses be shown as a visible tax.
The section that follows casts focus on municipal finances and the practice of relief of rates using MEU revenue during the current period under discussion.
5.4.2 Municipal Finances and the Policy of Using MEU Revenue to Provide Rate Relief
With the NP in charge, and the same funding challenges, the UME (in 1953) once again approached national government for the appointment of a commission of inquiry into municipal finances and how financial relief could be provided. Indeed, the issues raised and the proposals put forward differed little from those of 1944 (Jenvey, 1964, p.149).
Government finally yielded, and in August 1956, the Committee of Inquiry into the Financial Relations Between the Central Government, Provinces and Local Authorities (whose report understandably came to be known simply as the Borckenhagen Report) was appointed by the minister. The terms of reference asked the committee to investigate and report on, among other things:
- The existing functions of local authorities, whether these were justified, and the extent to which functions should be abolished, diminished or transferred;
- The sources of income of local authorities, and the adequacy of the income sources to perform these functions (Borckenhagen, 1964).
The Borckenhagen inquiry took 15 years to finalise and yielded little from a local government perspective. This was succinctly summed up by the 1970 mayor of Johannesburg, Patrick Lewis (1987): “Little help could be expected from its recommendations, as it based its figures on outdated 1962 statistics.” The committee proposed that health be redirected to provincial or national government, which would materially reduce the financial burden on local authorities, and on that basis it was concluded that municipalities did not require new sources of income. Moreover, the committee sided with Escom – stating unequivocally that distribution should reside with local authorities, but industrial users should be afforded the protection of Escom rates. This entrenched Escom’s right to directly supply energy-intensive users and drove the final nail into the coffin for municipal electricity generation (Marquard, 2006; Jenvey, 1964; Borckenhagen, 1964; Craythorne, 1982; Browne, 1983). The practice of rate relief from electricity surpluses was officially sanctioned by national government in the 1971 White Paper (Ministry of Finance, 1971).
Not surprisingly, municipal finances did not improve, and municipalities continued to lobby government, proposing alternative and additional models. The minister of finance finally yielded, and in 1976, the Committee of Inquiry into the Finances of Local Authorities under G.W.G. Browne (1980) was convened. As had been the case with the Borckenhagen Report, the Browne Commission’s recommendations offered little to municipalities. The report did not identify any new revenue sources; in fact, it implied the opposite and proposed that municipalities were inherently inefficient and should put their affairs in order. This finding was expressed forcefully (Browne, 1980) and backed up by the report seeking to reduce existing revenue sources, recommending that the surpluses from all trading services be restricted to 10% for five years, and thereafter to a maximum of 5%. Craythorne (1982) provided a scathing analysis of the committee’s work, finding fault with its limited understanding of local government and stating that the committee clearly pushed through national government directives:
The startling display of ignorance could have been avoided … It might have been hoped that having got off to a bad start the report might have improved but unfortunately this was not the case … It is difficult to escape the conclusion that this was deliberately done to avoid dealing with the need for subsidies to local government.
The Browne Report was followed by yet another inquiry – the Croeser Working Group on Local Government Finances, which endorsed and promoted the policy of RSCs. The Regional Services Act of 1985 introduced a levy on business payrolls and turnovers (Government of the Republic of South Africa, 1985).
Ultimately, national government failed to resolve the issues facing local government. In truth, its actions made matters worse, and it was seemingly fixated on identifying weaknesses in local government.
5.4.3 Johannesburg’s Municipal Finances and Electricity Surplus
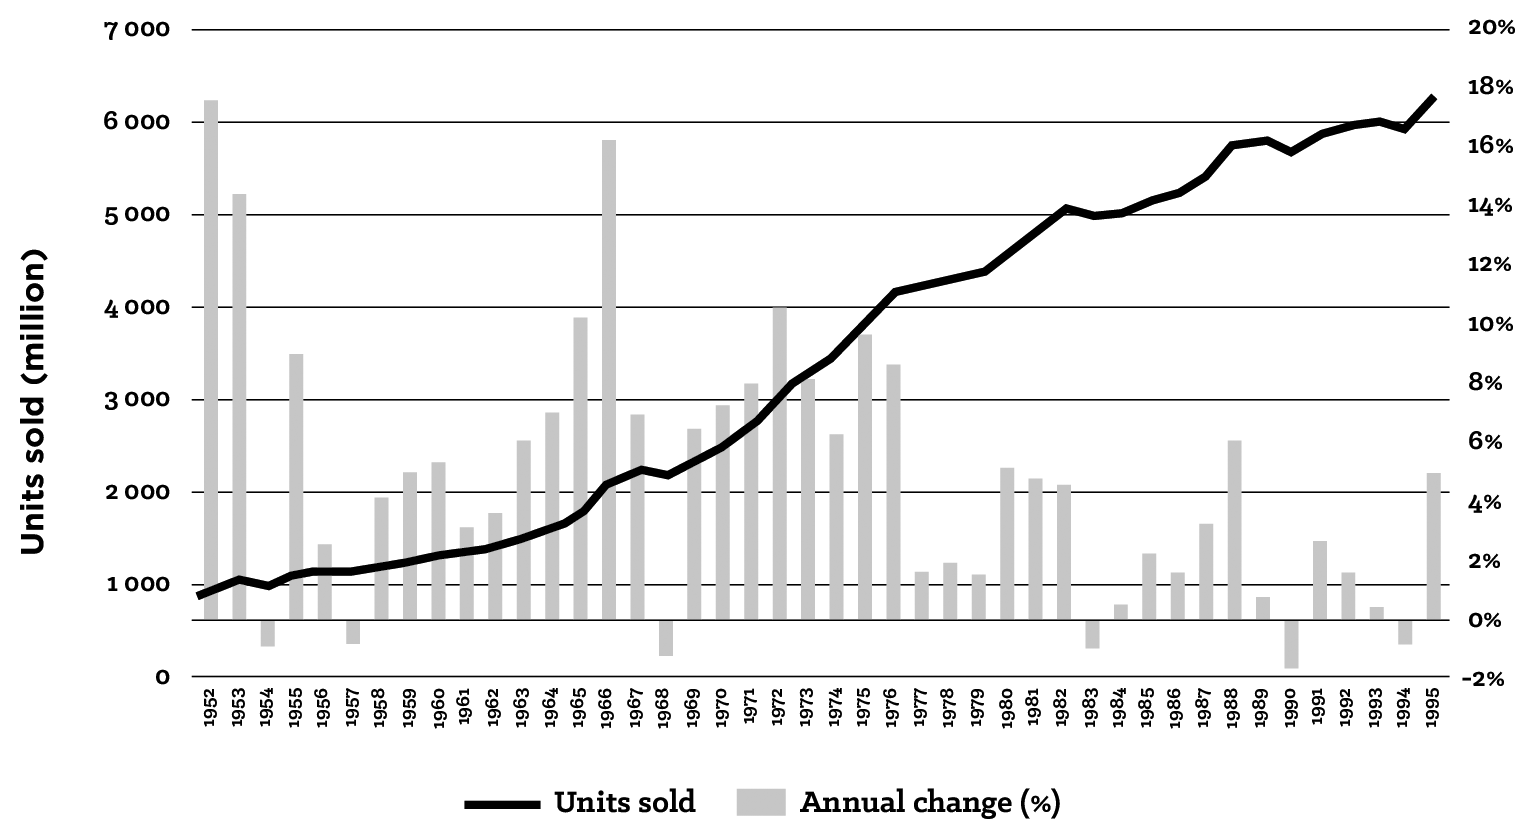
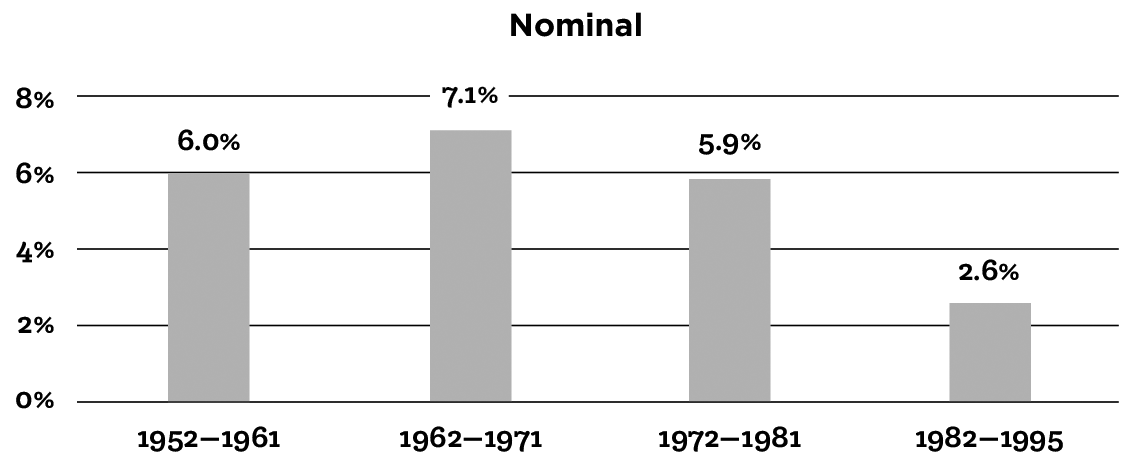
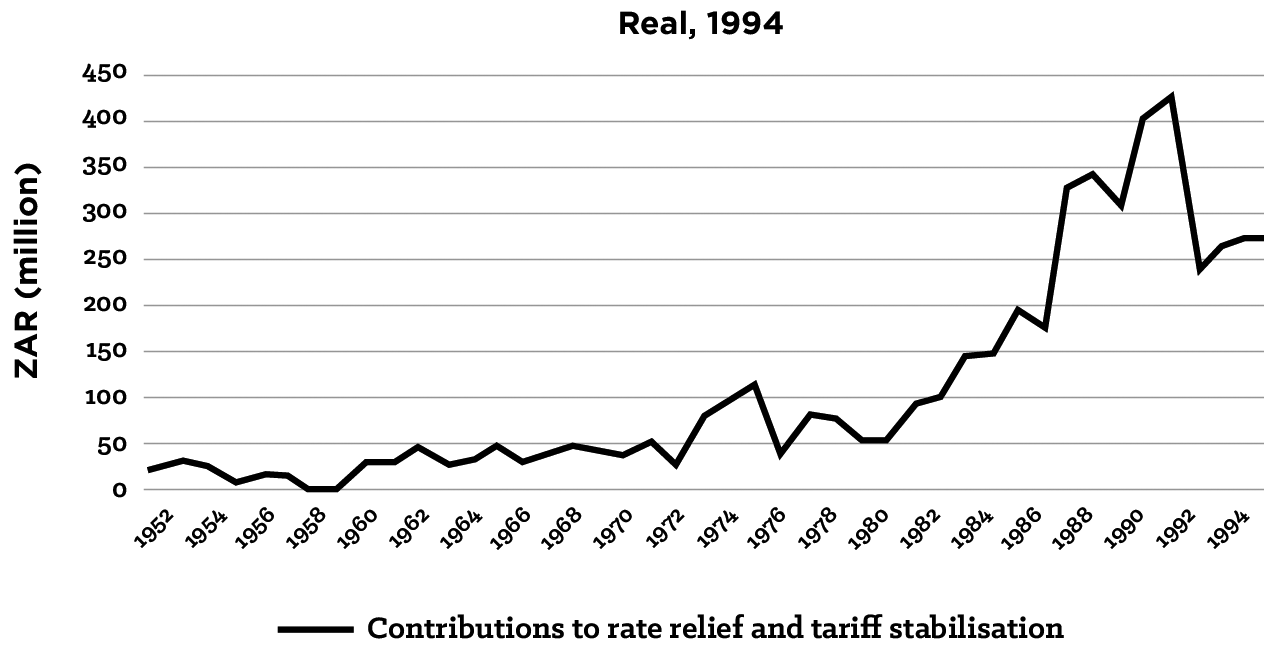
When looking at Johannesburg as a particular focal point for this period, one immediately notes that electricity consumption grew in line with the city’s population growth and geographical expansion. Figure 5.2 illustrates the growth in electricity usage for the period 1952 to 1995. The JEU sold 928 534 029 units in 1952 and 6 229 159 044 in 1995 – an average growth rate of 4.9% (Figure 5.3). Figure 5.2 shows both macro and micro trends. For example, 1953 and 1954 reflect the post-war boom years, while the period up to 1976 reflects the positive economic conditions punctuated by small recessionary periods. The impact of the Soweto Riots is clearly visible (1977–1979), followed by the short-lived gold run of the early 1980s. From thereon there is modest growth due to high tariff increases and of course the political and economic environment.
Source: JEU, Annual Reports of the City Manager, Electricity Department
Source: JEU, Annual Reports of the City Manager, Electricity Department
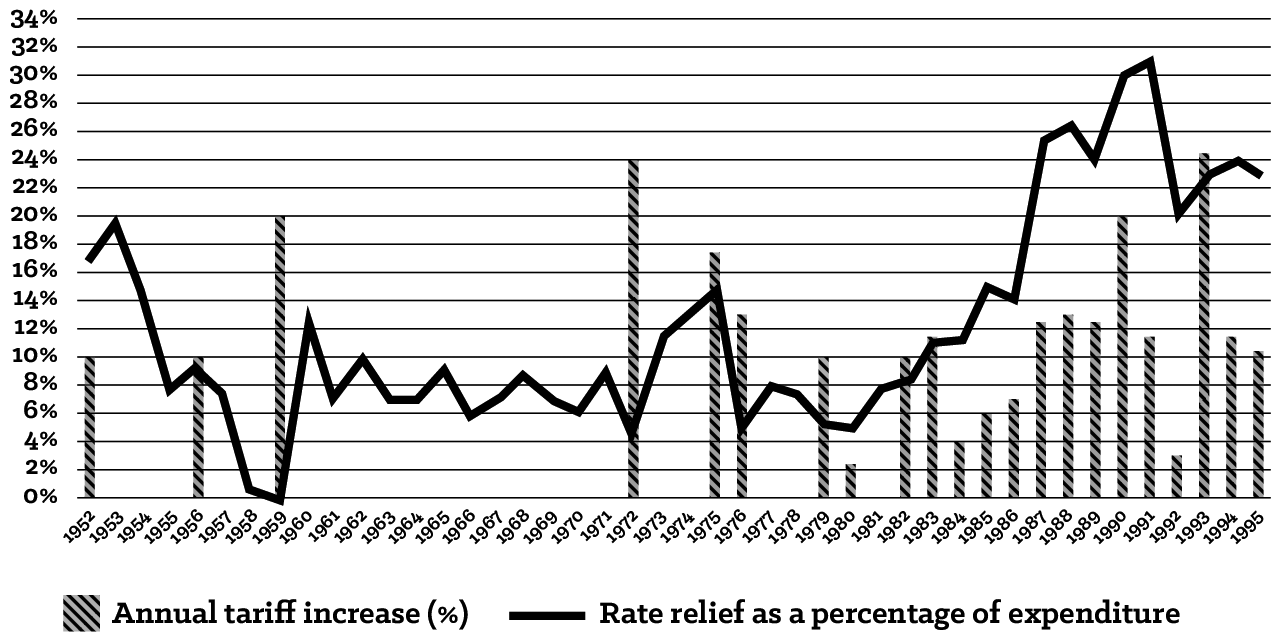
Figure 5.4 is interesting for many reasons, as it shows how electricity surpluses became a reliable and indispensable source of revenue. It shows clearly the relationship between a tariff increase and an increased surplus in the following year. Notable examples include 1959, 1972, and from 1985 onwards. Infrequent but larger nominal tariff increases up to the late 1970s were replaced with smaller annual tariff increases to begin with, becoming more significant in the late 1980s.
Source: JEU, Annual Reports of the City Manager, Electricity Department
Figure 5.5 now illustrates the annual contributions the electricity department made to the relief of rates for the period 1952 to 1994. Two things stand out. The first is the extent to which contributions increased from the early- to mid-1980s. During this period, Escom was in an over-supply situation and offered the city bulk-supply discounts. Escom recognised that once it became the JEU’s primary supplier, it would find a way to remove the discounts; the JEU accepted Escom’s offer, but kept the Orlando Power Station operational as an alternative supply.
We knew that if we shut down Orlando, the game was over and Escom would revert to the original tariffs, so we kept two boilers operational. This worked well, and we were even able to increase the discounts, until 1990. The electricity undertaking made large surpluses during this period. (Martin Pomeroy, city electrical engineer)[14]
The second standout observation is the profound effect on the electricity surplus that occurred in 1992, when the city reduced residential tariffs and limited the increase on business tariffs. The surplus dropped in real terms (using 1994 as the base year) from R449 million to R234 million. The loss in revenue from electricity in 1991 was offset by a corresponding 68% increase in revenue from property rates (Johannesburg Municipality, 1992, p.vi) (Figure 5.6).[15] The inevitable question thus arises: Given the prevailing operational environment, why did the city take the drastic and risky decision to reduce electricity tariffs? The answer is the evolution of Sandton – “a nouveau riche exemplar of peripheral urbanization” – and Murray (2011, p.114) explains that this was not by design:
In 1967, at the height of apartheid, the National Party carved out two new municipalities, Sandton and Randburg,[16] in what at the time was the peri-urban periphery of Johannesburg … this decision to create a separate local government at Sandton was primarily motivated by the mounting fear of losing citywide elections to the white political opposition, which had its strongest base of support in the northern suburbs … In order to secure their own tax base, Sandton municipal authorities set out, with some animus, to compete against the Johannesburg central city for corporate clients by offering considerably lower property taxes rates, and relaxed zoning applications favourable to the expansion of commercial and retail development.
Not only did Sandton benefit from lower property rates and relaxed zoning requirements, but it also enjoyed significantly lower electricity rates than what the city was charging, as it received its supply directly from Eskom. The effect was that Johannesburg came under pressure from its anchor tenants. The city argued that it offered far superior infrastructure, all of which came at a cost. However, this was insufficient: “there was a backlash from energy dependent consumers and particularly those who were close to the borders of Johannesburg where their competitive counterparts enjoyed the Eskom demand tariffs some 40 to 50% less than Johannesburg’s”. To start, the exodus was not wholesale. Companies retained their offices in Johannesburg, but opened new offices and made expansions in Sandton and Randburg. Once the new offices were established, the entire company followed.[17] Democracy saw the demarcation of new municipal and provincial boundaries; Johannesburg absorbed the Sandton and Randburg municipalities as well as several townships, most notably Soweto and Alexandra, to form a Metropolitan Local Council (MLC). A peculiarity of this new arrangement was that Eskom continued to distribute to Sandton and Soweto, while rates had to be equalised across the city – prompting the Sandton rates boycott in 1996.
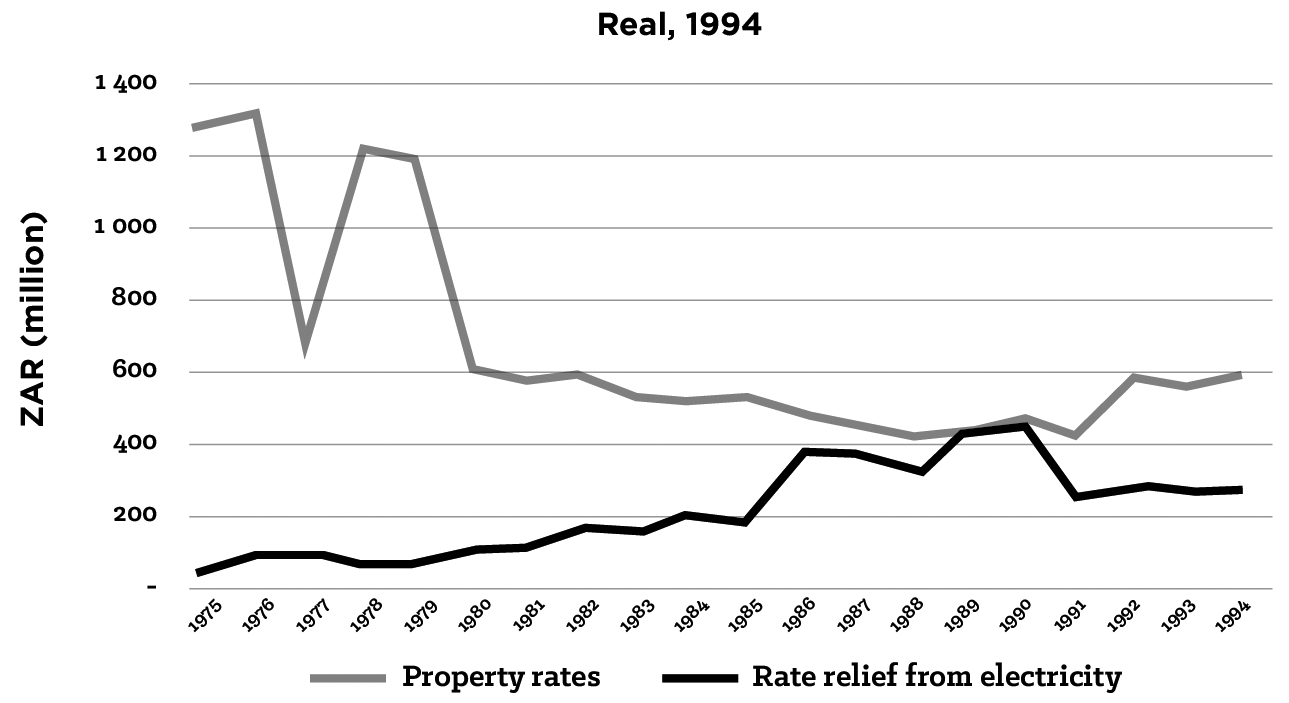
Note: The sharp drop in property rates revenue in 1977 was not explained in the annual financial statements, but doubled (in nominal terms) the following year.
In painting a strong numerical picture of municipal funding reliance on limited sources during this period, Figure 5.7 demonstrates the extent to which electricity sales and property rates make up the bulk of municipal revenue. Indeed, a closer analysis (Table 5.3) reveals that municipal functions were:
- Operated at a marginal profit, or at a loss (water and sewerage); and
- Heavily subsidised (transport and health) or completely subsidised (culture and roads) by property rates and electricity surpluses.
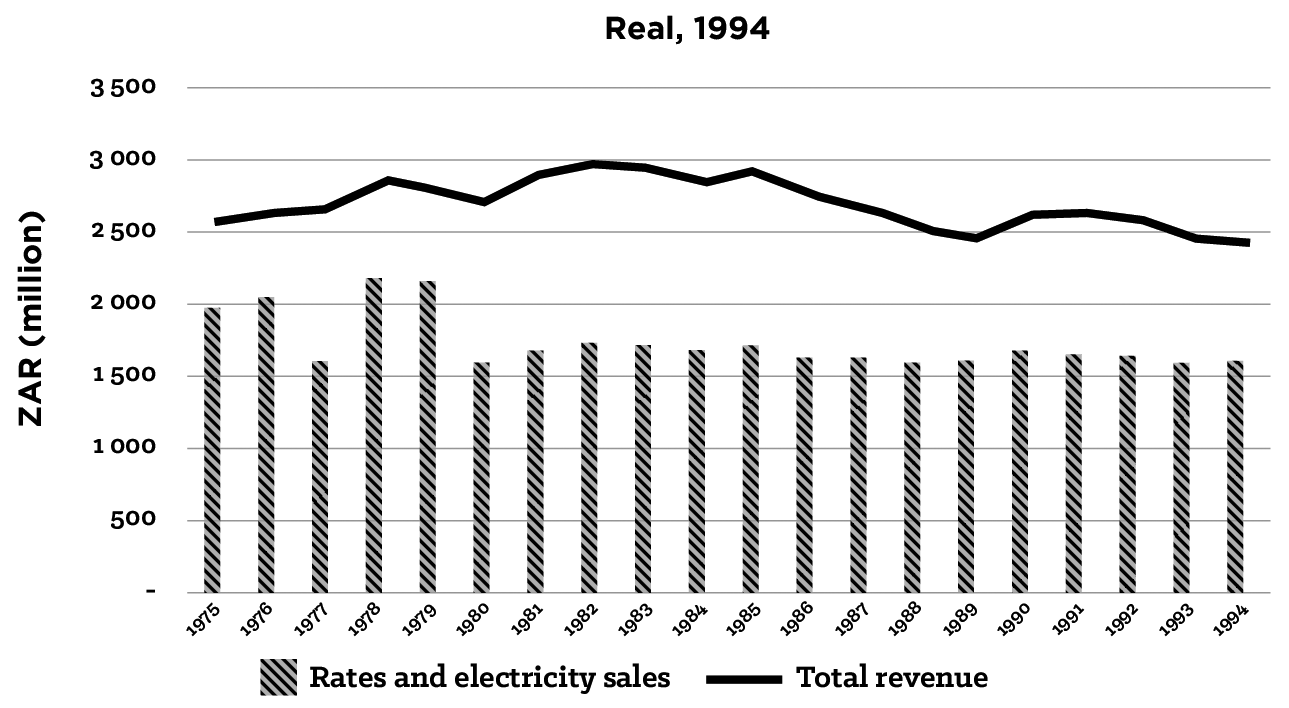
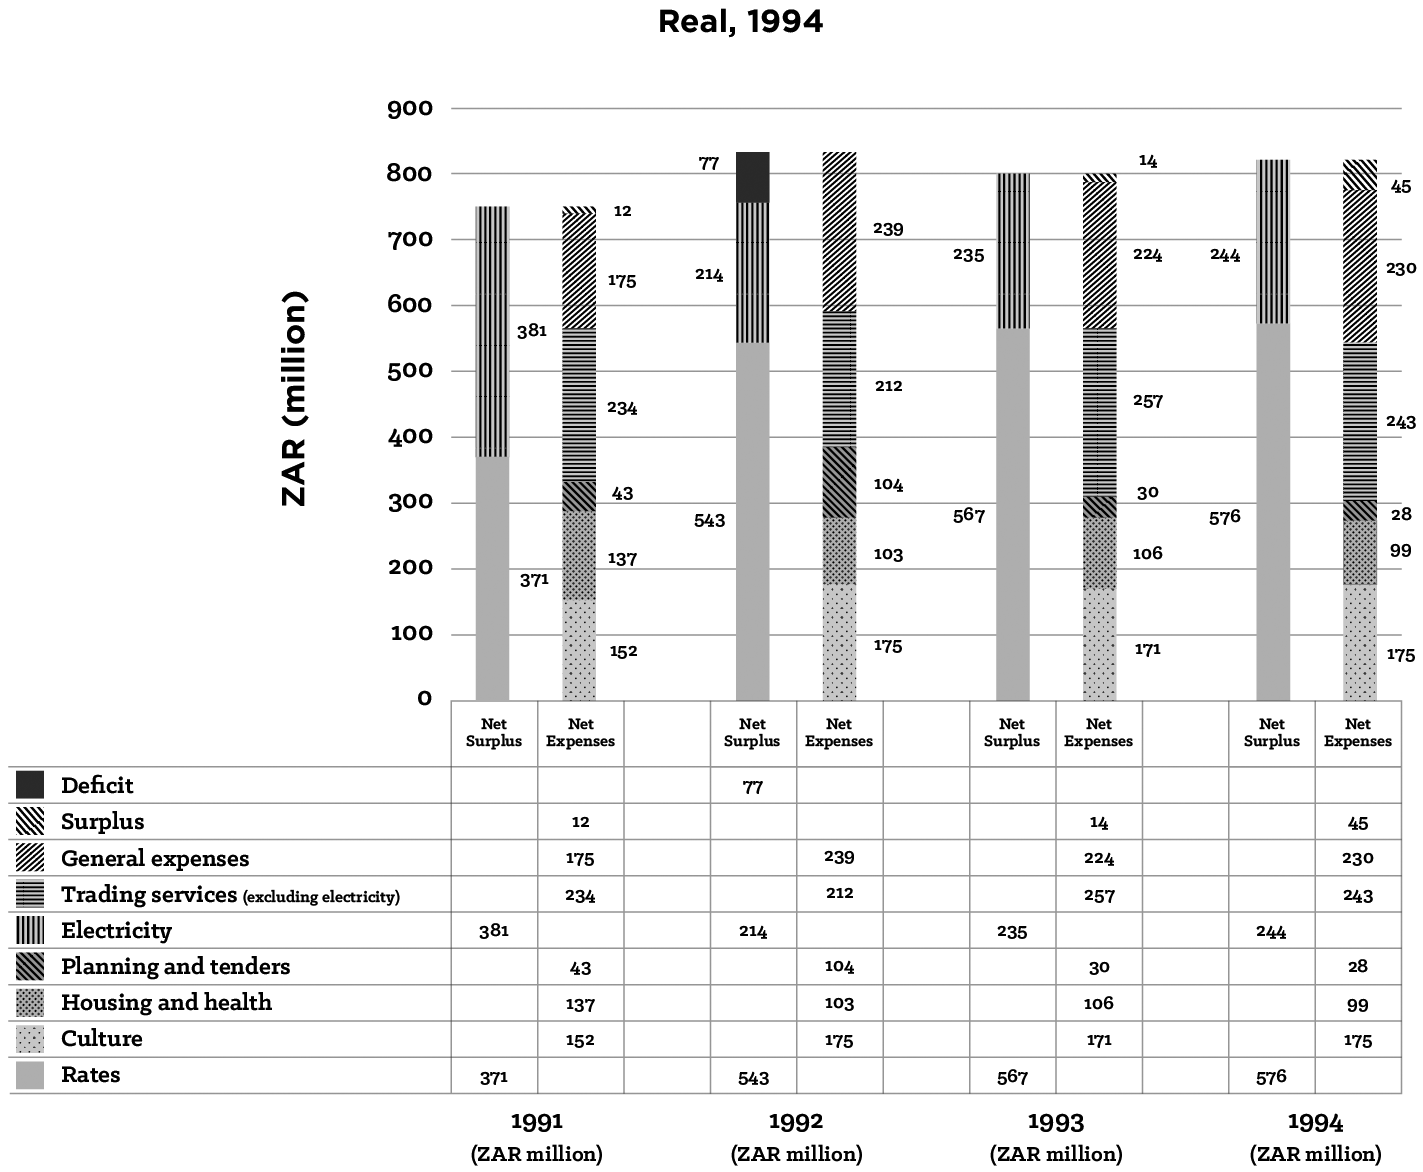
Figure 5.8 shows the city’s exclusive reliance on rates and electricity to provide functions for the period 1991 to 1994.
More than anything, the long period under NP rule again demonstrated an escalating intransigence in shifting away from the practice of relief of rates on the part of municipalities – particularly given that the electricity-generation battle had been lost to Eskom – with the growing reliance on revenue from electricity distribution being made worse by national government’s ongoing dithering in critically addressing the challenges of municipal funding – which itself was overtaken by socio-political events in the latter part of the period, as the nation inexorably began to move towards democracy.
5.5 Democratic Elections and Electricity for All (1994–2017)
5.5.1 Setting the Scene
The immediate post-apartheid period was dominated by two pressing but contentious issues:
- The urgent need for Eskom and municipalities to meet the targets and commitments made towards national electrification; and
- The restructuring of the ESI.
5.5.2 NEP and the New Regulator
Having served its purpose and in danger of compromising agreed outcomes due to the theoretical debates on the form of a future ESI, NELF was disbanded in 1995 (Conradie & Messerschmidt, 2000, p.314). NELF’s work was consolidated into a final report which highlighted the state of crisis that the ESI was in, most notably the distribution sector which needed urgent restructuring. Over 400 municipalities distributed electricity, and Eskom serviced a further 2.5 million consumers, ranging from high-intensity users (mines and smelters) down to indigent households. As many as 120 municipalities serviced fewer than 1 000 households, and more than 90 had annual revenues of less than R1 million. The result was a fractured industry with too many tariffs, vastly disparate charges and varying service levels. Users in Gauteng paid between 9 and 17 cents per kWh, whereas equivalent users in Mpumalanga (where most of the power stations were located) paid 23 to 32 cents per kWh. Surpluses from electricity sales were as inconsistent – 50% of the total was generated by the top four municipalities; the next 25% was generated by 18 municipalities; with the final quarter being divvied up amongst the remaining 380-plus local authorities, almost all of which were operating at a loss.
The report recommended the establishment of an electricity regulator, who would replace the ECB, have wide-ranging powers, and be charged with overseeing the restructuring of the ESI. The first phase of this overhaul would see Eskom absorb the small and non-performing MEUs. The second phase would see the establishment of a limited, and more feasible, number (5 to 17) of REDs. Consolidating the EDI would achieve the long-held objective of cost-reflective tariffs, end cross-subsidisation (relief of rates), and ultimately deliver a competitive ESI (Conradie & Messerschmidt, 2000; Bekker & Marquard, 2008; Galen, 1997).
However, NELF’s reform recommendations directly challenged the vested interests of Eskom and municipalities, and “the controversial recommendations ground to a halt” (Conradie & Messerschmidt, 2000, p.320). The National Energy Regulator (NER) was however established on 4 October 1995, with ex-Eskom CEO McRae appointed as its first chief executive, and many key positions being filled by ex-Eskom personnel. All exemptions to regulations were removed from the Electricity Regulation Act, as henceforth Eskom and all MEUs would report to the newly created NER. With so many Eskom people at NER, there was little question as to where sympathies lay, an issue which became a source of contention for the AMEU.
A first order of business for NER was the establishment of the Electricity Working Group (EWG), which was tasked with making recommendations on the future structure of the EDI. All stakeholders were involved (there were 24 workshops in total), and the EWG undertook a thorough analysis of the industry. Many of the affected parties (Eskom, AMEU, the Institute of Municipal Treasurers and Accountants) undertook their own reviews.
Unsurprisingly, Eskom and the AMEU clashed (again) when the latter discovered that Eskom generation was charging Eskom’s own distributors a lower tariff, through its Wholesale Electricity Tariff (WET). The government then set up the Electricity Restructuring Interdepartmental Committee (ERIC) to review the findings of the EWG. The stakeholder consultations that the NELF, EWG and ERIC processes had undertaken readily identified the issues (Galen, 1997, p.1):
- The EDI was fragmented, inefficient and needed to be rationalised and prioritised;
- Tariffs needed to become cost-based. To do so, cross-subsidies would need to end or be marginal. Electrification could be funded through tariffs but had to be done in a transparent manner; and
- The ESI needed to separate generation, transmission and distribution, to create a competitive operating environment.
The differing political ideologies and vested interests of the various stakeholders made finding mutually acceptable action difficult. For example, the urgent need to reform and consolidate EDI was universal, but how was it to be done? Some favoured creating a national electricity distributor, whereas others believed that a small number of regional distributors, the so-called REDs, would be more efficient and more responsive to local concerns and interests. The boundaries[18] of REDs required careful consideration of ownership, asset valuation, regulation, and human resources. The ERIC report and its recommendations were submitted to Cabinet. In May 1997, after numerous revisions to address comments and concerns, Cabinet approved the consolidation of the EDI into the maximum number of financially viable and independent REDs (Eberhard, 2007b; Conradie & Messerschmidt, 2000; Galen, 1997).
However, not all tiers of government agreed. At its inaugural meeting, SALGA[19] immediately rejected the establishment of REDs, as this was viewed as a constitutional matter. Electricity and gas distribution, amongst others, were municipal functions protected by the Constitution. SALGA’s position did not deter national government, which in 1998 issued the White Paper on Energy Policy, which detailed its intention to reform the ESI.
Due to a variety of factors, it was decided to move the second phase of the electrification programme from Eskom to the DME. An evaluation of the programme for the period 1994 to 1999 found that it had cost R8 billion, and had increased electrification from 36% to 66% nationally through three million new connections, primarily in cities and towns (Borchers et al., 2001, p.iv).
5.5.3 REDs (So Close, Yet so Far), ISMO and ADAM (Much of the Same)
The Need to Reform the EDI, and the REDs Programme
By 2005, there were 278 municipalities, and the more-than 400 electricity distributors had merged into approximately 180 units, which were still too many (DME, 2002; Mlambo-Ngcuka, 2004). Having abandoned plans to privatise generation, government remained committed to reforming the EDI, as the issues identified in the mid-1990s persisted.
Section 156 (1) and (2) of the 1996 Constitution assigns and lists the functions municipalities have exclusive authority over; electricity reticulation is one of these. In 2002, the DME stated that, in their opinion, EDI restructuring could still occur without a constitutional change. The basis on which such a conclusion was based remains unclear but suggests that national government believed that a political solution was probable. This approach compromised the programme from the outset, as municipalities negotiated knowing their participation was voluntary and thus from a position of strength (Eberhard, 2007a & 2005b; Pickering, 2010; Gaunt, 2008).
In 2000, national government appointed PricewaterhouseCoopers (PwC) to develop a mutually beneficial and acceptable model for all stakeholders and which addressed the contentious issues of boundaries, ownership, asset valuation, regulation, and human resources. The report, meant to serve as a blueprint, was compiled by the EDI Restructuring Committee (EDIRC) (DME, 2001) and proposed six REDs, each anchored by a metro to provide financial sustainability (Figure 5.9), supported by 57 recommendations to achieve the end objective. The blueprint was approved by Cabinet in 2001, and EDI Holdings, a state-owned entity, was formed in 2003 to resolve outstanding issues and manage the process. In early 2005, President Mbeki confidently set June 2005 as the target date for the establishment of the first RED (RED1), a pilot project jointly approved by Eskom and the Cape Town metropolitan government. The target was achieved, but on paper only. The stumbling block was Eskom, who having previously supported the programme, was unwilling to operate under the rules and provisions of the local government system,[20] which were different to those applicable to state-owned entities. On this basis, Eskom resisted (refused) transferring its assets, customers and staff to RED1 control. To appease Eskom, the REDs were categorised as non-municipal entities, but unsurprisingly, this arrangement then became unacceptable to the city of Cape Town, who stated that the nature and structure of the arrangement had fundamentally changed to its detriment, and it promptly pulled out and asked NERSA to revoke the RED1 distribution licence and re-establish the status quo. All agreements were cancelled and RED1 was dissolved.
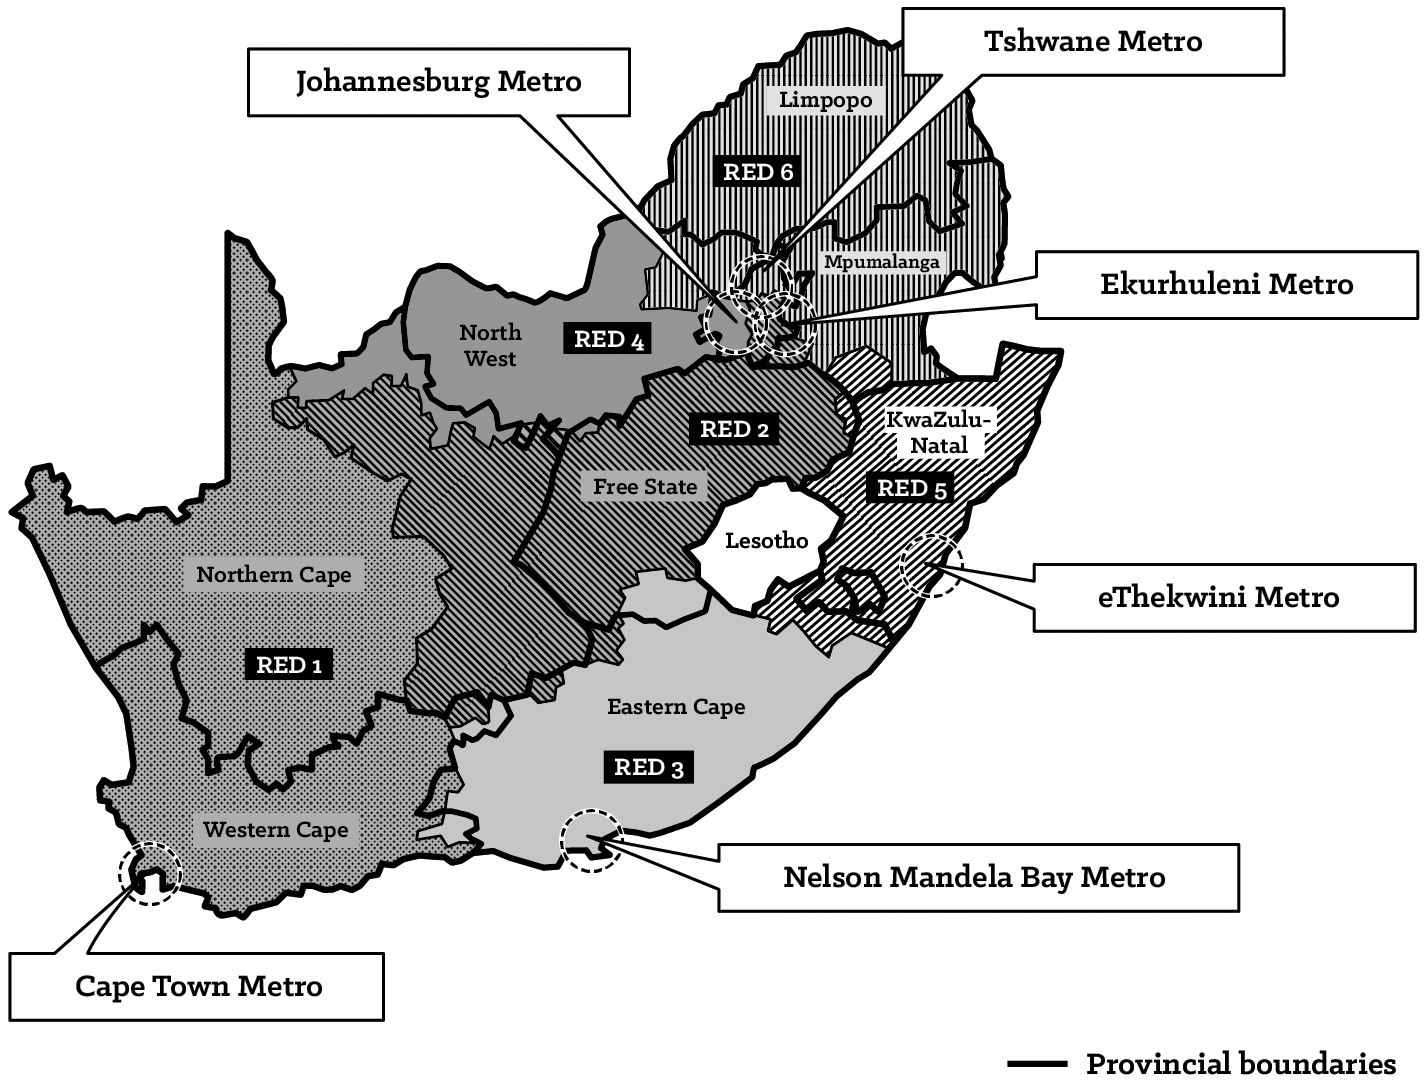
Source: Eberhard (2013b)
In 2006, the DME instructed EDI Holdings to make REDs work. In June 2008, EDI Holdings CEO Phindile Nzimande expressed that she believed they were getting close: “Never before has the environment for the establishment of the REDs looked so substantially promising”. From 2006, over R1.2 billion was spent on reviving the REDs, but with little progress. Government finally threw in the towel and the REDs scheme was officially abandoned and EDI Holdings wound-up following a Cabinet decision made on 8 December 2010.
Reforming the EDI, which had developed, and been entrenched for, over a century, was never going to be straightforward. The failure of REDs, however, came down to three main issues:
- How would ownership of the REDs be determined?
- How would local government and Eskom be compensated for their assets?
- Who would control the REDs?
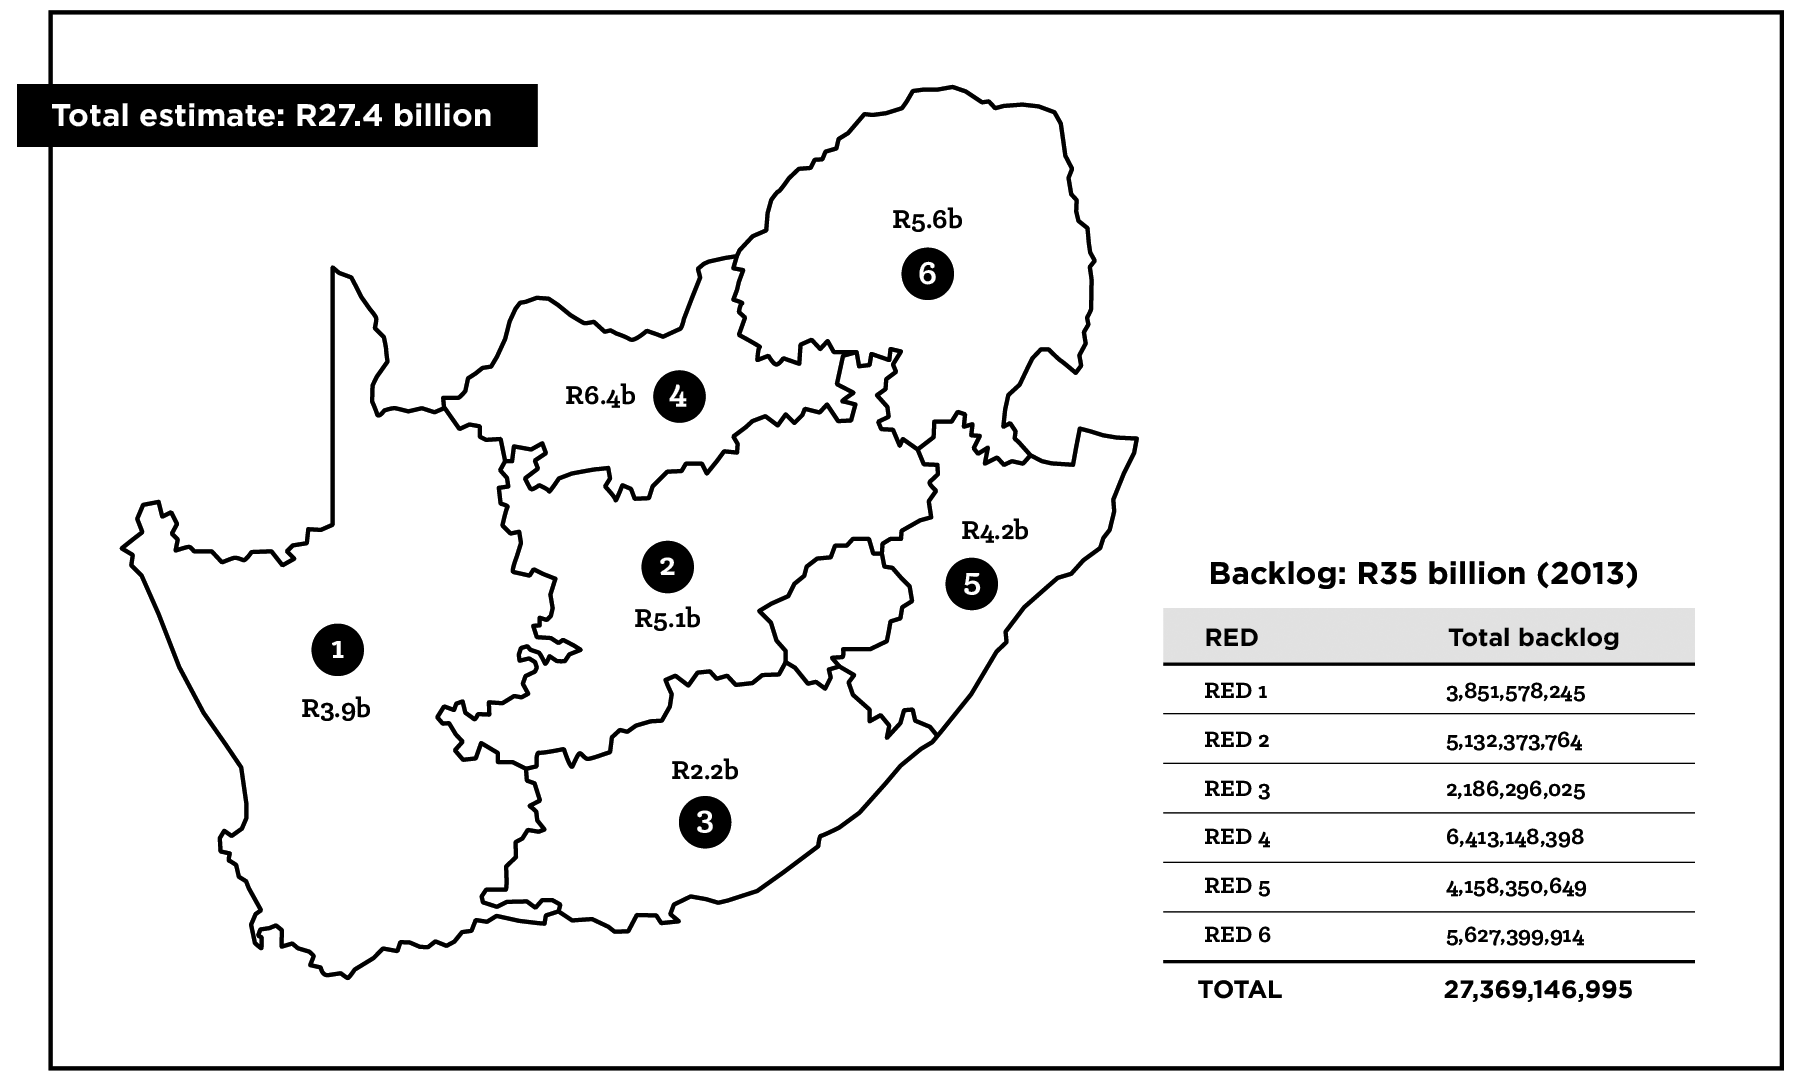
The attempt to reform the EDI took 15 years, cost several billion rand and yielded little. The real victims however were the physical municipal distribution systems. During this extended period of uncertainty, the owners of each distribution system, in being told that their assets would be transferred into a new structure for an unknown sum or for nothing – as many feared – adopted a policy of minimum maintenance. Not only were non-essential capital investments put on hold, but preventative and common infrastructure suffered the same fate. Indeed, it was not uncommon to wait for equipment to fail before action was taken. The backlog of infrastructure maintenance was R27.4 billion in 2008, and by 2013 estimated at R35 billion (Figure 5.10) and growing at approximately R2.5 billion per annum, which the minister of energy (formerly the minister of minerals and energy) and NERSA continually kept referring to as a ticking time bomb (McDonald, 2009; Eberhard, 2000, 2005a, 2005b, 2007a & 2013b; Pickering, 2010; Kessides et al., 2007; Gaunt, 2008; DME, 2001 & 2002; Mlambo-Ngcuka, 2004; Savage, 2008; Nzimande, 2008; Yelland, 2010).
Source: Eberhard (2013b)
Approach to Distribution Asset Management (ADAM)
With the REDs scheme abandoned, EDI Holdings was absorbed in April 2011 by the DoE, which inherited the issues the REDs project was set up to resolve. In November 2012, Cabinet approved the DoE’s ADAM programme, which would work with municipalities to address the high backlogs of maintenance and refurbishment of their distribution networks, but due to the enormity of the task, a phased approach would be adopted. NT re-allocated R320 million of the funds not utilised by EDI Holdings to DoE to initiate Phase 1, or the “Mini-ADAM”, which would target nine MEUs (seven local municipalities and two metros). Updating Parliament on the progress of Mini-ADAM in November 2013, the SALGA representative explained that the majority of the selected MEUs had neither the financial nor the human resources to identify and develop high-level electricity master plans to normalise their networks.
The sheer lack of progress since 2011 is astounding. Knowing from 2008 that the capital-investment backlog was growing at R2.5 billion per annum and of national urgency, the DoE took the better part of four years to complete Mini-ADAM, spending a paltry R320 million. During this period, the backlog ballooned to R80 billion by 2017, and the DoE was still only referring to Mini-ADAM and considering innovative finance mechanisms.
Integrated System Market Operator (ISMO)
Eskom, as a vertically integrated utility which generates, transmits and distributes, has managed and controlled South Africa’s electricity system since it took control of the VFTPC, and the function it serves as a systems operator is not independent (Pickering, 2010). The publication of the ISMO Bill on 13 May 2011 would introduce competition by creating a level playing field for all ESI participants. A new state-owned entity, which would take over necessary Eskom assets, would buy electricity from generators to sell to customers, showing them prices from which they could choose. The Bill came under a significant amount of criticism for focusing too closely on encouraging investment in generation to overcome power outages, without adequately addressing fundamental issues.
The Bill never made it to Parliament; Minister of Energy Ben Martins subsequently admitted to blocking it. Market commentators speculated that Eskom influenced this action and finally succeeded in killing the Bill. This hypothesis is both plausible and probable. Citing the fragile status of Eskom, government officially withdrew the ISMO Bill to allow Eskom the time and space to stabilise its power plants.
The ISMO Bill in its current format is off the table. There will be a new bill that will be developed that is fit for the current situation and not create any instability within the electricity supply … (Dr Wolsey Barnard: acting director general, DoE, 17 February 2015)
No pronouncements on a new Bill had been made by the DoE by the end of 2017.
5.5.4 Democracy and the Evolution of the AMEU (1994–2012)
Unless stated otherwise, this section is a summary of AMEU meeting and conference minutes and internal documents, providing an internal view of the MEUs’ response to national government’s attempt to implement REDs, and it focuses on the recommendations made by PwC.
Note: Where a month and a year are given followed by a colon, (e.g., ‘July 2001:’) this denotes an AMEU meeting. External meetings are noted as such.
In June 2000, PwC released the eagerly awaited ESI restructuring report.[21] Mr Howard Whitehead, an honorary member of the AMEU who was also on SALGA’s ESI technical working group, presented a paper titled Restructuring of the Electricity Distribution Industry at the 2000 AMEU proceedings. He noted that significant progress had been made to narrow the gaps that existed between the preferred approaches of Eskom and SALGA, but that “the ultimate decisions lie in the hands of the politicians both at national and local level or sphere”. His paper articulated SALGA’s position by explaining each of the 15 (of the 58) recommendations that the Association found to be contentious. The most pertinent are summarised, followed by SALGA’s response (for the full list and a detailed explanation, refer to Whitehead [2000]):
- Recommendation 6: National government would hold a “golden share” in each of the REDs. Local government was questioning this recommendation, as it gave national government certain rights, most notably that REDs could not sell shares (to whoever would be interested in buying them) without national government approval. SALGA did not object to the principle of a golden share, but to how this authority would be exercised. Given that local government is mandated by the Constitution to reticulate electricity, it would follow that the golden share reside with them.
- Recommendation 19: Retail competition needed to be introduced as a priority. SALGA did not object to competition, but MEUs would need time to adjust to the new operating environment.
- Recommendation 30: Tariffs to low-income households would need to be below the cost-reflective rate. SALGA’s view was that although necessary, this was a welfare issue and needed a political solution and to be dealt with via a national policy focusing on the indigent. The purpose of the restructuring was to reduce and even eliminate cross-subsidisation.
- Recommendation 56: Licences, agreements and other legal instruments necessary for the establishment of the REDs should be drafted under the co-ordination of the transitional structure. SALGA’s view was that a single service-delivery agreement for all municipalities within the REDs would be unworkable, as each municipality’s needs would be different and the result would be that the large municipalities would dominate.
July 2001: SALGA, under increasing pressure to protect the financial interests of its members, wrote to the minister of energy to suspend the programme until the financial-impact study had been completed. Municipalities were also calling for greater transparency from Eskom and wanted the utility to charge its distribution areas the same transmission tariff as it did municipalities.
February 2002: The update from the technical committee noted:
- Eskom had still not signed the voluntary co-operation agreements with the MEUs and would not do so until its conditions were met;
- The DME believed that restructuring could still occur without a constitutional amendment;
- SALGA was against moving electricity distribution from Schedule 4B to 4A of the Constitution, as this had the potential to degrade the security basis for bank loans;
- SALGA’s financial-impact study estimated that municipalities would need to be compensated by R4.3 billion for the loss of income resulting from the restructuring of the EDI, and would need a further R2.2 billion to ring-fence their departments;
- Municipalities would need to retain the right to levy a surcharge on electricity distribution; and
- On the basis of the PwC model, municipalities would become the minority shareholders in all REDs.
In light of the above, the AMEU resolved to advise its members that in preparing for REDs, all MEUs needed to “corporatise” and ring-fence their operations.
April 2003: The technical committee confirmed that Eskom had restructured its divisions to match the proposed REDs boundaries.
March 2004: The introduction of the Municipal Financial Management Act (MFMA) removed many of the perceived advantages of the EDI, and the EDI Bill had not shown any signs of progress.
October 2006: As a result of the failure to launch RED1 in Cape Town, the AMEU reconsidered its position, as follows:
- REDs would need to be municipal or public entities;
- The Association confirmed its support for the six-REDs model;
- A firm legislative framework was needed to ensure an orderly and equitable transition;
- All stakeholders would need to tacitly acknowledge that reticulation and distribution meant the same thing, and to confirm their acceptance of a 132 kV supply cut-off;[22]
- All REDs would have to be regulated by NERSA; and
- All customers would need to be included in the REDs scheme, and Eskom could not supply customers privately or separately.
October 2008: The AMEU discussed at length an announcement by government that it had decided to change the Constitution to allow for REDs.
October 2010: EDI Holdings advised the AMEU that energy security had overtaken EDI restructuring as a national priority, and that the latter was not expected to be resolved before 2017.[23] Dr de Beer however encouraged municipalities to continue consolidating their MEUs’ operations based on long-term concession agreements.
At the 2011 AMEU conference on the EDI restructuring programme, Dr de Beer delivered a frank post-mortem presentation in which he lamented the lost opportunity (De Beer & Waters, 2011) . The state of the distribution network, bar a few pockets of excellence, had been neglected, and the longer this continued, the more expensive it would be and the greater the economic and political consequences would be. It was the smaller municipalities, the very ones that EDI restructuring was supposed to benefit, who had received the short end of the stick. The need for a constitutional amendment was undoubtedly the elephant in the room, however there were other issues which led to the failure of REDs:
- Political will: The DoE always publicly stated its commitment to the process, but contradicted this by reducing the funding allocations to a level which made meaningful progress unattainable;
- Legislation: The required enabling legislation, which could have been leveraged from national policy objectives, was not created;
- Enforcement: NERSA had repeatedly failed to hold municipalities to account. However, in the view of McDonald (2009, p.50), the biggest failure was to perpetuate and entrench the apartheid practice of a pricing scheme that subsidised industry and the middle class, while charging low-income households higher absolute tariffs. This resulted in reduced consumption, or the use of alternative, often more dangerous forms of energy.
5.5.5 Non-Payment of Municipal Services, and Funding Shortfalls
The phenomenon of non-payment of municipal services has a long history dating back to the 1980s, having successfully been used as an effective protest tool against an illegitimate minority government. This practice continued after the 1994 elections, however, and by all accounts has become endemic and of serious concern.
Ascertaining the reasons for continued non-payment has thus spurred significant research from all sectors – government, NGOs and academia (see McDonald, 2002; Mavhungu, 2011; Peters, 2012; Fjeldstad, 2004; Ringane, 2013; NT, 2001 & 2011). Non-payment happens due to a combination of factors and cannot be reduced to a single issue, as some argue. These factors include:
- Unwillingness to pay;
- Inability to pay;
- Entitlement;
- Inability of municipalities to collect (no metering system, broken meters, no billing system);
- Dissatisfaction with the service or associated services;
- An ingrained culture of non-payment (“Others don’t pay, so I won’t …”); and
- A lack of trust in local government to use the funds received effectively – together with non-payment remaining an indirect form of protest against national government, as the electorate is unable or unwilling to vote for any other political party, and therefore voices its dissent through non-participation.
Regardless of the reasons, the effect of non-payment for services on municipal finances is devastating and greatly impedes municipalities’ ability to deliver on their constitutional mandate of developmental local government. For the period 1994 to 2003, municipalities accumulated a total of R24.3 billion in consumer debt due to non-payment (Fjeldstad, 2004). This grew to R108 billion in 2016, 66% of which was owed by households (NT, 2016b). In a presentation to Parliament in August 2016, the CEO of Eskom reported that municipalities owed the utility R6 billion, which excluded R1.4 billion written off in 2004, and stressed the need to recover these funds. In early 2016, and again in 2017, Eskom went as far as threatening to disconnect the top-20 defaulting municipalities, who in early 2016 owed R3.68 billion (Whittles, n.d.).
Statistics South Africa (Stats SA) (Figure 5.11) found that 30% of municipal income was derived from electricity sales (in 2013) and that “the financial viability of many municipalities could be tenuous if they were no longer able to trade economic services, such as electricity”. The amount owed to Eskom by Soweto, which it supplies directly, and which is not included in the municipal debt, was R4.74 billion for the year ended 2016 (Eskom, 2016, p.41).
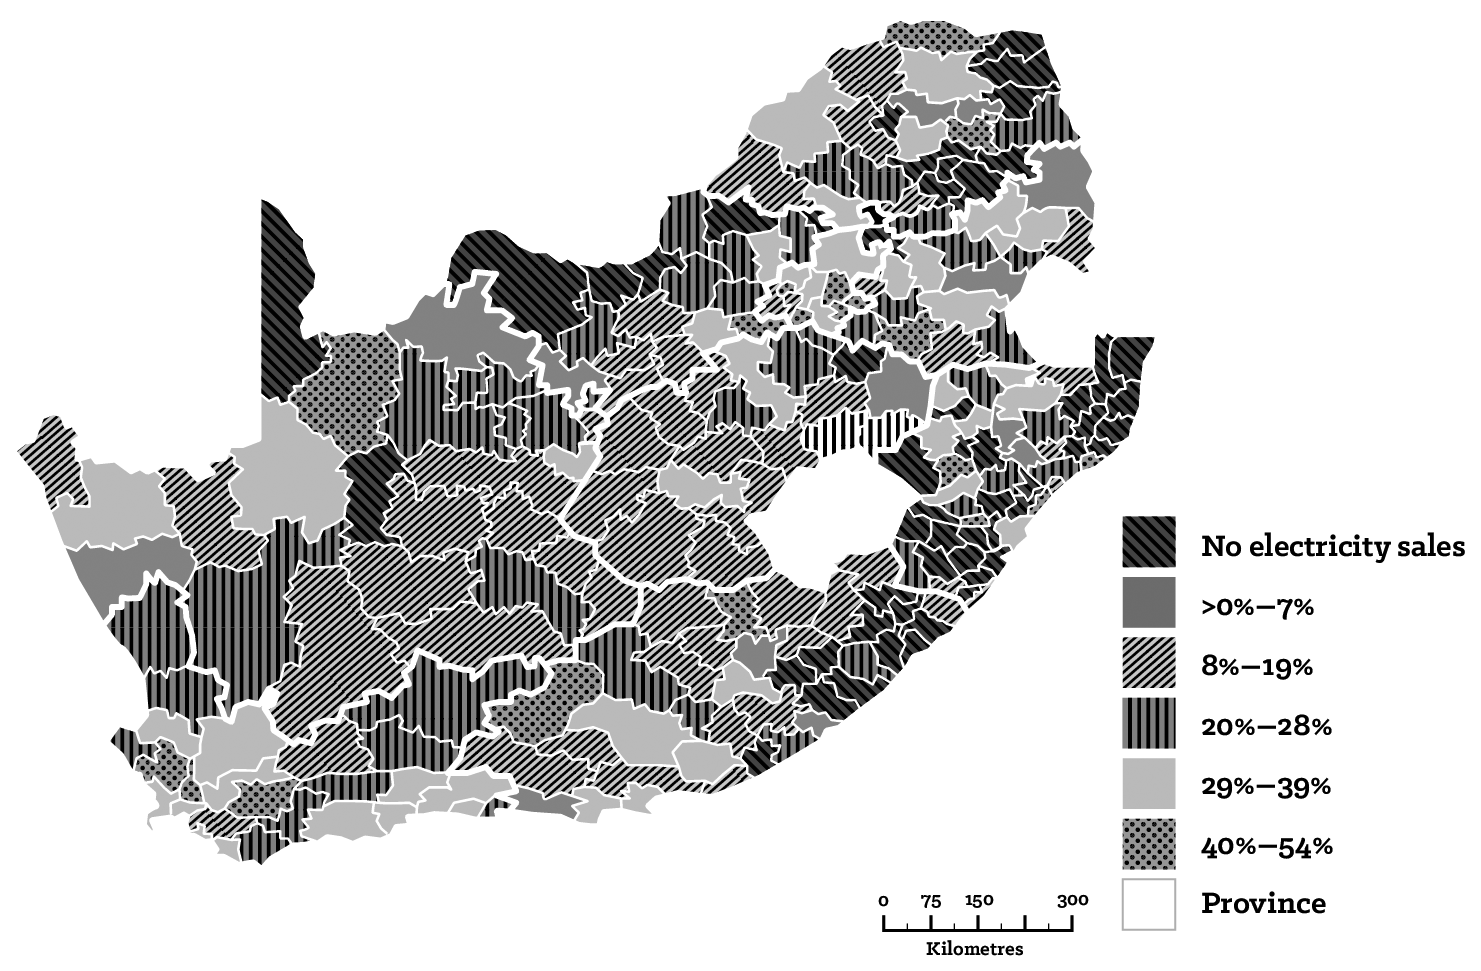
Source: Stats SA (2016)
Ultimately, municipal funding shortfalls must be covered in some way. The most expedient method is to divert funds, such as bulk-purchase payments to Eskom (PMG, 2016), but this practice only buys time and eventually the shortfall must be sourced. Municipalities thus turn to the two sources available to them. The first is gained by increasing property taxes and service tariffs on the existing resident base. This is problematic, though, as it penalises compliant residents who will thus resent it. Moreover, the added financial pressure on residents may lead to a greater percentage of non-payment. The second source is gained through national government transfers. This however immediately goes against the core principles of decentralisation. Decentralised government, the Constitution acknowledges, can only be achieved if local governments are largely financially self-sufficient, which is why the specific revenue-generating functions they perform and their “equitable” share of nationally collected revenue (skewed towards rural municipalities) are both protected by the Constitution.
By 2015, government grants were the largest contributor to municipal revenue, at 31%, followed by electricity sales, at 28.3%, and property rates, at 14.7% (Stats SA, 2016).
5.6 Case Study: JEU
5.6.1 Aligning to a New Political Structure and Extended Service Area (1995–2001)
In 1994, Johannesburg comprised 13 separate municipalities. These were divided along racial lines, and within this, ethnic or cultural lines.[24] The municipalities had differing capacities and in many instances overlapping functions and powers. After the 1995 local government elections, a two-tier system was introduced, whereby the municipalities were merged into four independent geographical sub-structures called Metropolitan Local Councils (MLCs), which were overseen by the Greater Johannesburg Metropolitan Council (GJMC). The consolidation proved more difficult than expected. Although each MLC and the GJMC had its own tax base and budget, it was treated as one.
Previously unserved black townships, populated almost entirely with low-income households, were now incorporated and could only be serviced by redirecting cross-subsidisation. Payments during this period fell throughout the city (Table 5.4) and dropped as low as 81% in 1997. The city’s 1998 financial statements reported that outstanding debt had increased to R2.9 billion, of which it was felt only R1.3 billion was recoverable. Reduced revenues did not deter the ANC-led municipality from continuing to focus on delivery. Budgets were expenditure-driven, with little thought as to how they would be funded[25] – all coming together to create a perfect storm (Lodge, 2003; Barchiesi, 2011; Amen et al., 2006; Kulkarni, 2012; Johannesburg Municipality, 1995). The newly elected councillors and politicians who held senior positions were new to a job which was complex and demanding, and they considerably underestimated the task at hand. As Schuster (1995) put it, these were
… inexperienced, third rate politicians representing the ANC at the local level. The problem is one that plagues the entire country, because most of the ANC’s seasoned leaders have gone to work in the upper echelons of government. … nowhere [are the deficiencies] better illustrated than in the tortuous gestation of the Greater Johannesburg Metropolitan Council.
The auditor general identified 14 major issues in the 1997 and 1998 financial statements, at the height of the crisis, when Johannesburg was technically bankrupt. These included the high number of vacancies in senior positions, a lack of accountability, weak IT controls, and insufficient staff training.
| Administrative area | 1996 | 1997 | 1998 |
| % | |||
| Orange Farm | 6 | 3 | |
| West Soweto | 14 | 23 | |
| Alexandra | 21 | 13 | |
| Dobsonville | 25 | 44 | |
| Soweto | 27 | 33 | |
| Ennerdale | 75 | 34 | 71 |
| Lenasia | 64 | 55 | 91 |
| Johannesburg East | 90 | 85 | 89 |
| Sandton | 97 | 87 | 91 |
| Johannesburg South and North | 90 | 93 | |
| Randburg | 100 | 94 | 90 |
| Roodepoort | 98 | 103[26] | |
Source: Johannesburg Municipality Archives
In mid-1997, the GJMC was unable to pay a R300-million bulk-electricity bill from Eskom (Matebese, 2013, p.11). National government finally intervened in 1998 when 10, and then 15, councillors were given control of the city. Known as the C15, they had executive authority to design and implement municipal-service policies, including the outsourcing or corporatisation of municipal functions. A city manager position was created in 1999 to hasten the transition. Mr Ketso Gordhan, a respected activist, was appointed, and he developed a three-year turnaround strategy which came to be known as “iGoli 2002”.
Egoli Gas and Rand Airport were sold, and most of the utilities were corporatised (ring-fenced), requiring them to operate as private-sector companies but still wholly owned by the City of Johannesburg (CoJ). From this process, City Power (CP) (electricity), Johannesburg Water, Pikitup (garbage removal), and the Johannesburg Roads Agency were created from 2000 onwards. The plan also included massive budget cuts; the budget dropped from R1.7 billion in 1995 to R500 million in 1999, unsurprisingly resulting in a deterioration in services and maintenance, and an exodus of skilled staff (Lodge, 2003; Barchiesi, 2011; Johannesburg Municipality, 1995). Although declining, the sale of electricity continued to provide a reliable revenue stream for the municipality (Figure 5.12).
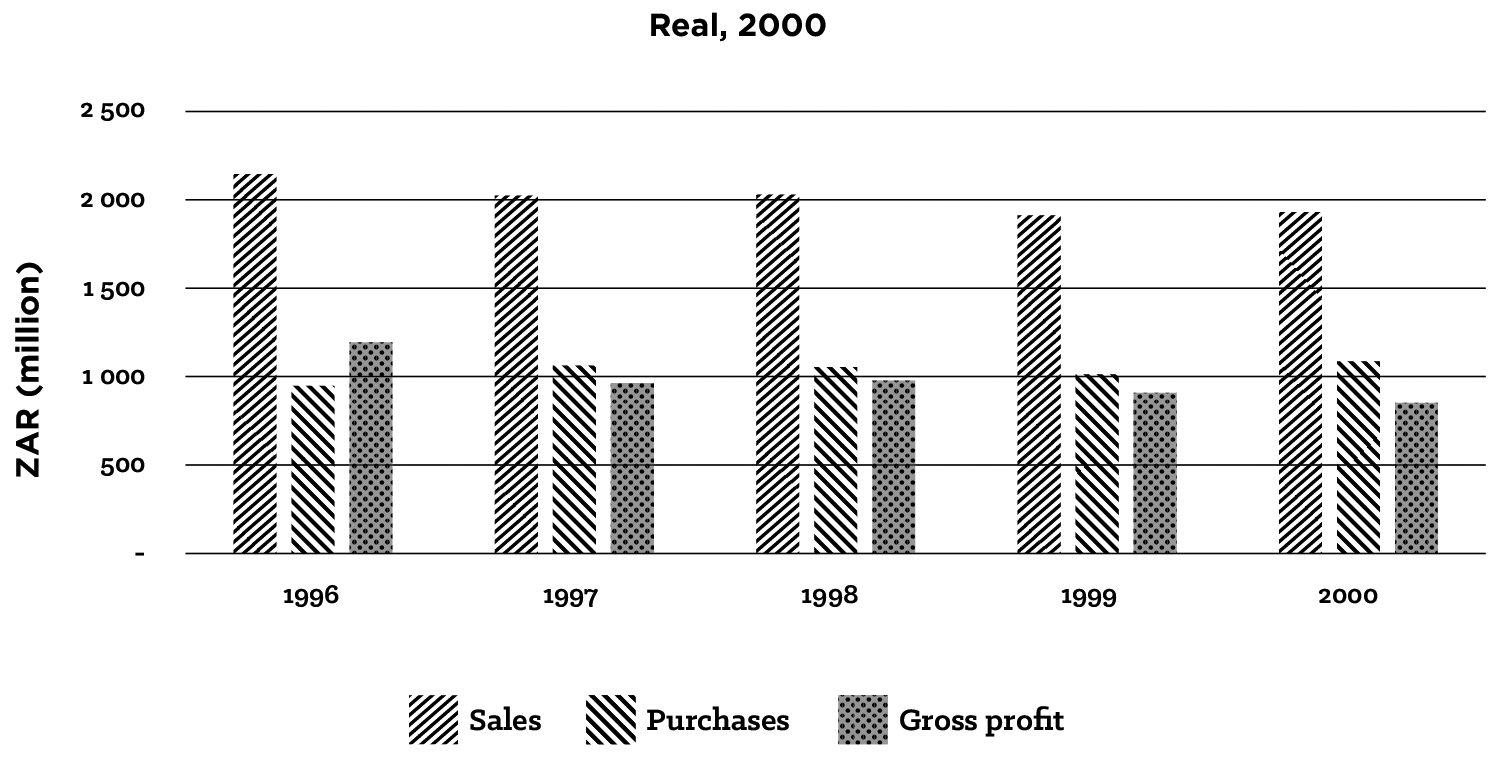
Source: JEU Annual Reports, 1995–2000
5.6.2 Corporatisation – The Establishment of City Power (2001–2017)
CP was established in terms of the Companies Act. Governance, regulatory and service agreements exist between CoJ and CP to ensure performance. CP’s mandate from its (only) shareholder is to buy electricity and sell it to the citizens of Johannesburg. In 2014, its two primary suppliers were Eskom (80%) and Kelvin Power Station (20%), which was privatised in 2001.
Surpluses Generated from Electricity
In its first year of operation, CP recorded a R385 million (R181 million 2015 real) loss, but this was less than 5% of the total R3.9 billion (R8.4 billion 2015 real) loss recorded by the Johannesburg Metro. Operations stabilised, and CP recorded a surplus in 2003, and has continued to do so ever since, except for 2008 when it was still profitable but high finance costs resulted in it posting a deficit. Trading surpluses from CP were the primary reason the Metro was able to achieve financial stability and operate profitably, especially from 2009 (Figure 5.13).
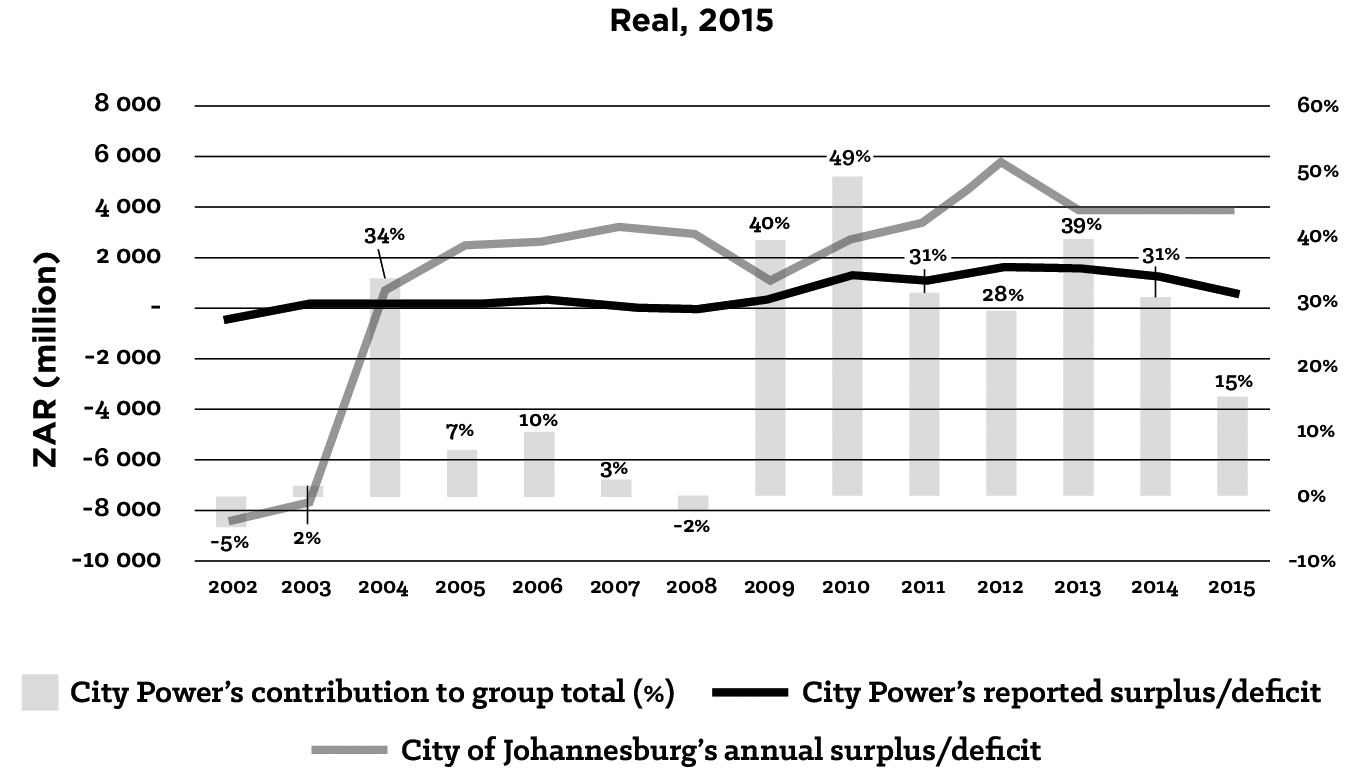
Source: Covary (2020)
This feat is more remarkable if bulk purchases and electricity revenue (Figure 5.14), and revenue from delivered electricity (Figure 5.15), are analysed. Figure 5.14 illustrates that the differential between bulk purchases and sales is relatively constant from 2002 until 2008, when the spread increases until 2012 and then stabilises again. Figure 5.15 shows that delivered electricity is flat from 2007 and declines markedly from 2010, however, this is not the case for bulk purchases, which remain constant and only start to decline from 2013 – implying that CP kept buying the same number of units but reselling fewer every year, i.e., there were losses in the system, but surpluses remained stable from 2009 to 2012.
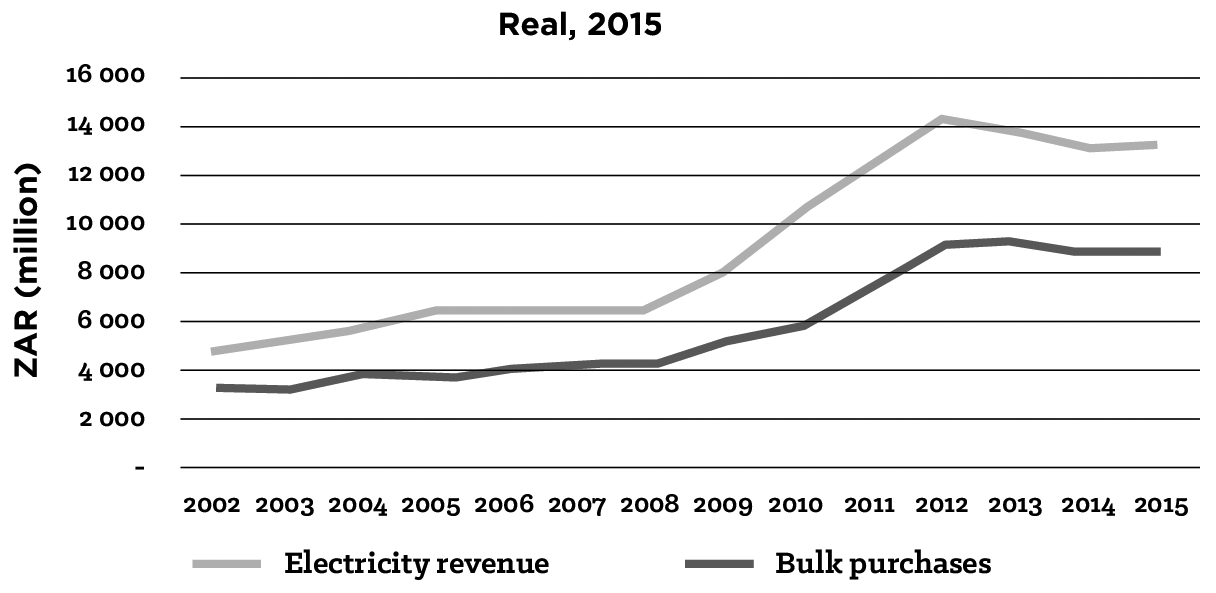
Source: Covary (2020)
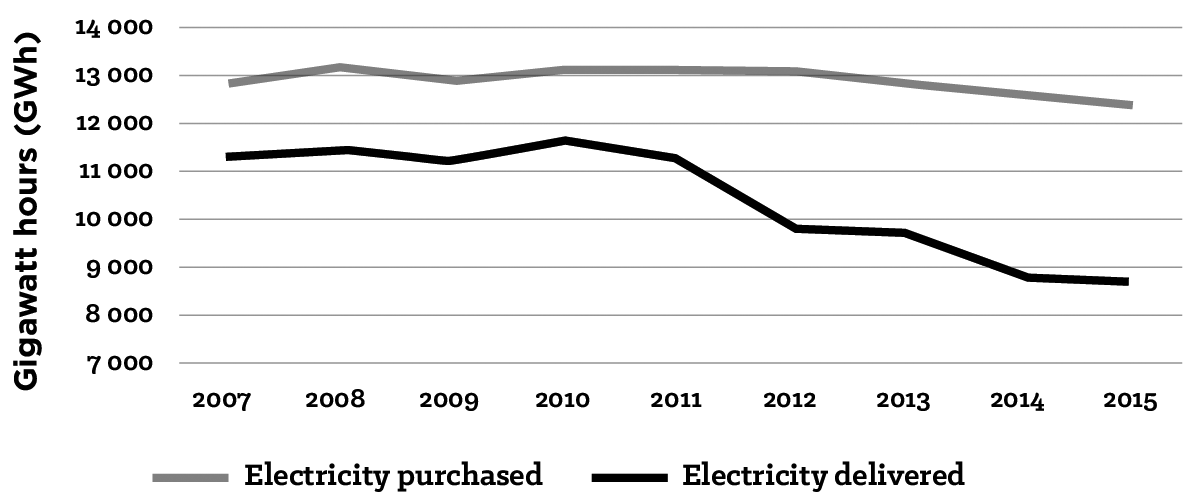
Source: Covary (2020)
The above demonstrates the extent to which Johannesburg was able to initially capitalise on the electricity crisis. Several reasons could account for this. The first is that the disproportionately high electricity tariffs rose from a very low base (until 2007 South Africa had amongst the lowest electricity tariffs in the world) – meaning a considerable lag effect before consumers were affected badly enough to respond through a change in their usage of the service and/or through adopting new technologies that would reduce their consumption. The second is that South Africa, to start, weathered the 2008 global financial crisis relatively well, but from 2010 entered a long period of low economic growth that was punctuated by recession and a stubbornly high unemployment rate, where it continues to languish in 2017. A third reason is that by levying a tariff increase commensurate to that of Eskom, CP created a greater return, as it gained the additional benefit from the difference between Eskom’s bulk-supply rate and its own retail rate. CP’s tariff increases were often greater than those of Eskom. For example, in 2010, Eskom increased tariffs by 24.8%, while CP’s increase was larger, at 29%; and in 2011, Eskom’s increase was 25.8%, whereas CP’s was 31%. Thus, Eskom’s tariff increases were by no means passed directly through CP, without alteration, on to CP’s customers. Figure 5.16 shows how all six metros benefitted from increased revenue from 2008 to 2012.
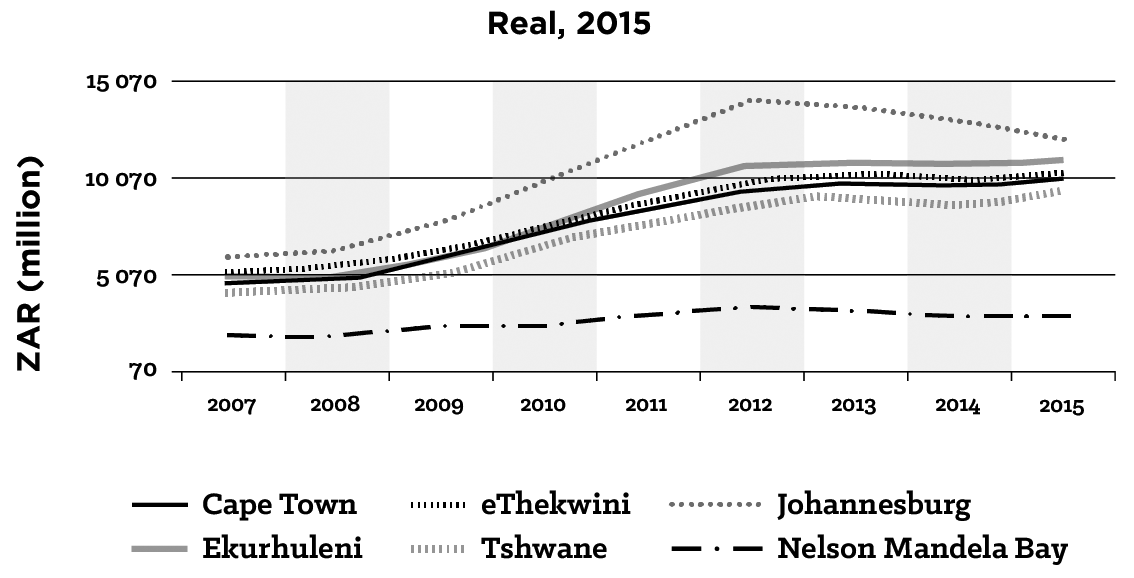
Source: Eberhard (2015)
These short-term gains were always going to come at a price, and many within CP knew it, but were largely powerless to do anything about it, as it was CoJ, and not CP, who decided on the annual surplus to be generated from electricity sales. Taking this one step further, CoJ develops the following year’s budget knowing that shortfalls can be covered from electricity, and to a lesser extent, other trading surpluses. In other words, the electricity tariff increases are derived primarily on municipal funding requirements and not economic principles or regulatory requirements.[27] Eskom’s sharp tariff increases from 2007 affected all electricity consumers and ultimately, and understandably, led to consumer resistance and reduced demand. Indeed, this was predicted from 2009. See Inglesi & Pouris (2010), Inglesi-Lotz & Pouris (2012) and Inglesi-Lotz (2011 & 2014), whose research forecast that the magnitude and frequency of the tariff increases would first result in decreased consumption, and then lead to long-term stagnation of electricity demand – until at least 2025. This can be seen in CP’s declining trend in total demand from 2008/09 (Table 5.5), which CP attributes to “slow economic recovery, energy efficiency improvement, technology conversion to exploit alternative energy sources, reduced consumption base, and a variety of other factors”, which it expected to persist until 2019.
Source: CP (2016)
Additionally, the CP funding model is controlled almost exclusively by CoJ. Annually, CP submits its budget requirement to CoJ, which then allocates an amount. A consequence of this approach is that CoJ is always more likely to defer CP capital investment for repairs and maintenance (see Table 5.6) to fund its own priority projects, thus exacerbating the under-investment in CP’s infrastructure. Finally, CP has no direct financial control of its business, as consumers pay their accounts directly to CoJ.
CP and NERSA
In 2014, NERSA issued benchmarks to help guide distributors. Table 5.6 compares these benchmarks against CP’s 2013 to 2015 figures from their annual financial statements. It is important to note that 2011 was the last year that CP published a debt-collection percentage (91%).
Source: Covary (2020)
The Relationship Between Tariffs and Electricity Losses
Higher tariffs led to reduced consumption and increased non-technical losses,[28] and this can be attributed to two factors:
- The inability of consumers to pay – an ever-present reality in a society with such high levels of inequality, made worse during weaker economic conditions and a 300% increase in electricity tariffs for the period 2007 to 2012, leading to late payment, bad debt and/or theft; and
- An already inefficient and error-prone administrative department being immobilised when the transition to a new computer system in 2010 was mismanaged.
The now-notorious Johannesburg billing crisis led to the formation of the Joburg Advocacy Group.[29] However, the billing problem is not limited to a sub-par ICT system; it is far greater and across the board.[30] This is caused by:
- Poorly skilled and/or tardy and/or corrupt administrative staff capturing incorrect information;
- Field workers, for the same reasons, reading meters inaccurately or estimating readings; and
- New connections not being registered on the system, erroneously or for illegal gain, resulting in the provision of free electricity – this is especially prevalent in large residential estates or office parks where there is a lot of sub-metering, and although it is not quantified, it could account for as much as 4 to 6% of the energy dispatched.
A contributing factor is the difficult relationship that exists between CP and CoJ, largely the result of the operational framework described above, and made worse by the fact that the two entities have not operated from the same location for over 15 years; this has led to weak institutional linkages, impersonal relationships, and ineffective communication.
In 2010, municipal electricity mark-ups averaged 57.5%; this figure was 50.2% in 2011 (Jordaan & Dekenah, 2013, p.7). The authors cautioned that the practice of consistently above-inflation increases presents a cash-flow risk, as users respond by shifting to a more elastic state by switching to alternative energy and/or by taking additional measures to reduce consumption. This is indeed reflected by the fact that CP’s energy delivered dropped from 11 723 GWh in 2011 to 8 736 GWh in 2015, while losses increased materially (see Figure 5.17 on page 178). CP’s 2012 annual business plan estimated the cost of non-technical losses to be R3.8 billion, by any account a massive amount. Under the heading “Key Revenue Related Challenges”, it states: “The R3.8bn losses indicated below are made up of R1.9bn administrative losses and R1.9bn of non-technical losses. The causes listed are unbilled customers, tampering, illegal connections, incorrect billing and estimates” (CP, 2012, p.33).
If one considers that the non-technical losses “challenge” was more than double the increase in turnover (R1.6 billion) – which in monetary value was greater than 30% of turnover (R12.6 billion); and, in energy terms, represented 24% of GWh delivered – then it is nothing less than an unmitigated disaster and a major business risk. The question that naturally arises is: How did it come to this?
In seeking an explanation, we start with technical losses. Discussions with industry professionals corroborate the guidelines of NERSA, who have set 6 to 7% as the benchmark for distribution losses. CP reported technical losses of 6% until 2002; the following year, the figure was increased to 9%, where it has remained. The basis for this was an internal report which identified a few remote outlying areas within the network with losses of 9%; this higher figure was used to reflect the state of the entire network, allowing for the re-categorisation of up to 3% of non-technical losses. Indeed, the 2012 annual plan suggests as much: “[Technical losses have] been assumed to be 9%. Tests are currently underway to validate this figure, and initial results indicate that this figure may be 7%” (CP, 2012, p.36). These test results were never made public or referred to again and the losses have remained at 9% in the subsequent plans (2013 to 2017).
With regards to non-technical losses, these were generally within the NERSA guidelines of up to 5% for the period 2005 to 2011, but exploded from 2012 (Figure 5.17). Three reasons account for the underlying causes leading to theft and administrative errors:
- The new billing system;
- The delayed effect of the tariff increases; and
- The decline in the economy.
What is abundantly clear from the annual business plans during this period is that although the losses are recognised as high-priority, there are only loosely described action items to address them, such as:
Non-technical losses continue to be a challenge, due to increased theft and vandalism. (Annual Business Plan, 2014, p.70)
Meter readers must face penalties for poor data capturing. (Annual Business Plan, 2015, p.51)
Electricity losses, technical and non-technical, are too high at 30% and this requires urgent attention. (Annual Business Plan, 2016, p.79)
Many more statements could be cited, but the point is that having identified and interrogated the causes of non-technical losses in some detail, two things remain constant: their high levels persist, as does the strong commitment to reduce them. In short, little progress is being made.
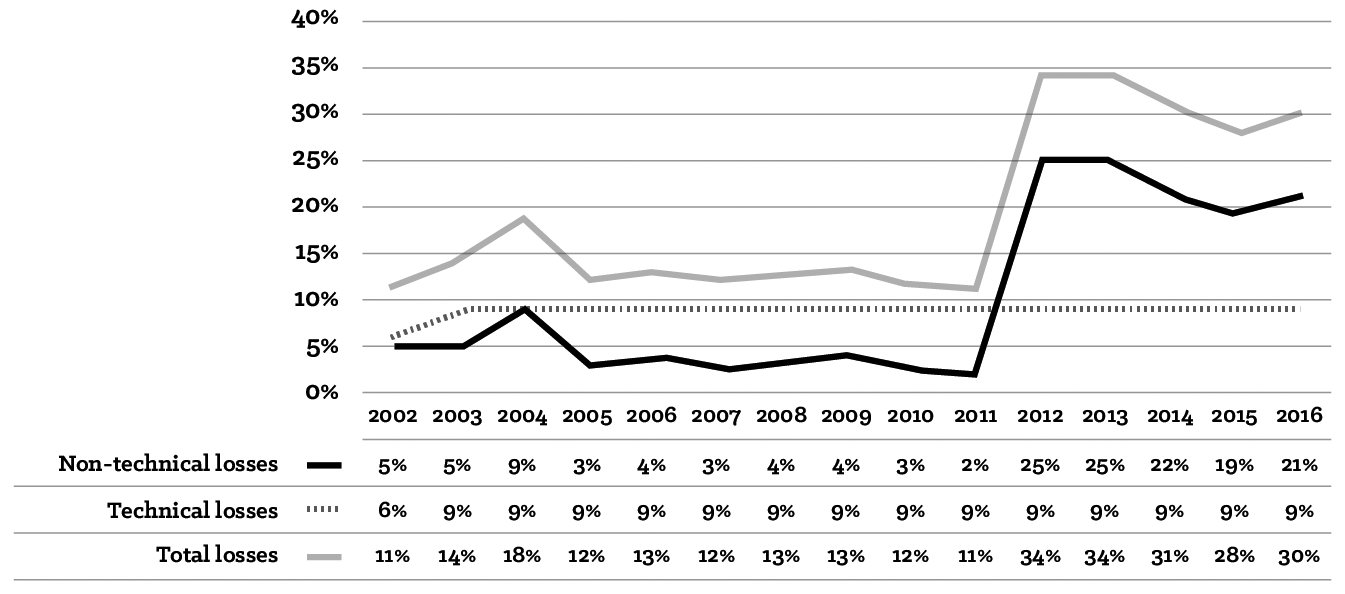
The 2015 Annual Business Plan (p.50), states that non-technical losses may be considered to be revenue losses. Which indeed they are. But to what extent? Figure 5.18 illustrates two things. The first, represented by the line graphs, is the consequence (delayed) of high annual tariff increases on non-technical losses, which have remained at 9%. Tariff increases of 22% (2007), 31% (2008), 29% (2009) and 30% (2010) were followed by a more than ten-fold increase in losses (2% to 25% in 2011 – Figure 5.17). It is true that losses cannot be attributed solely to high tariffs, and the stabilisation and slight improvement from 2013 could be attributed to more accurate meter readings and billing. The second thing that Figure 5.18 illustrates, through the bars, is the impact that reduced consumption and high losses have had on surpluses. Using the NERSA guideline of 10% (mean) for total system losses as the cap, the value of lost revenue in excess of 10% is quantified. At 2015 real prices, system losses over 10% for the ten-year period 2006 to 2015 amounted to over R8.4 billion.
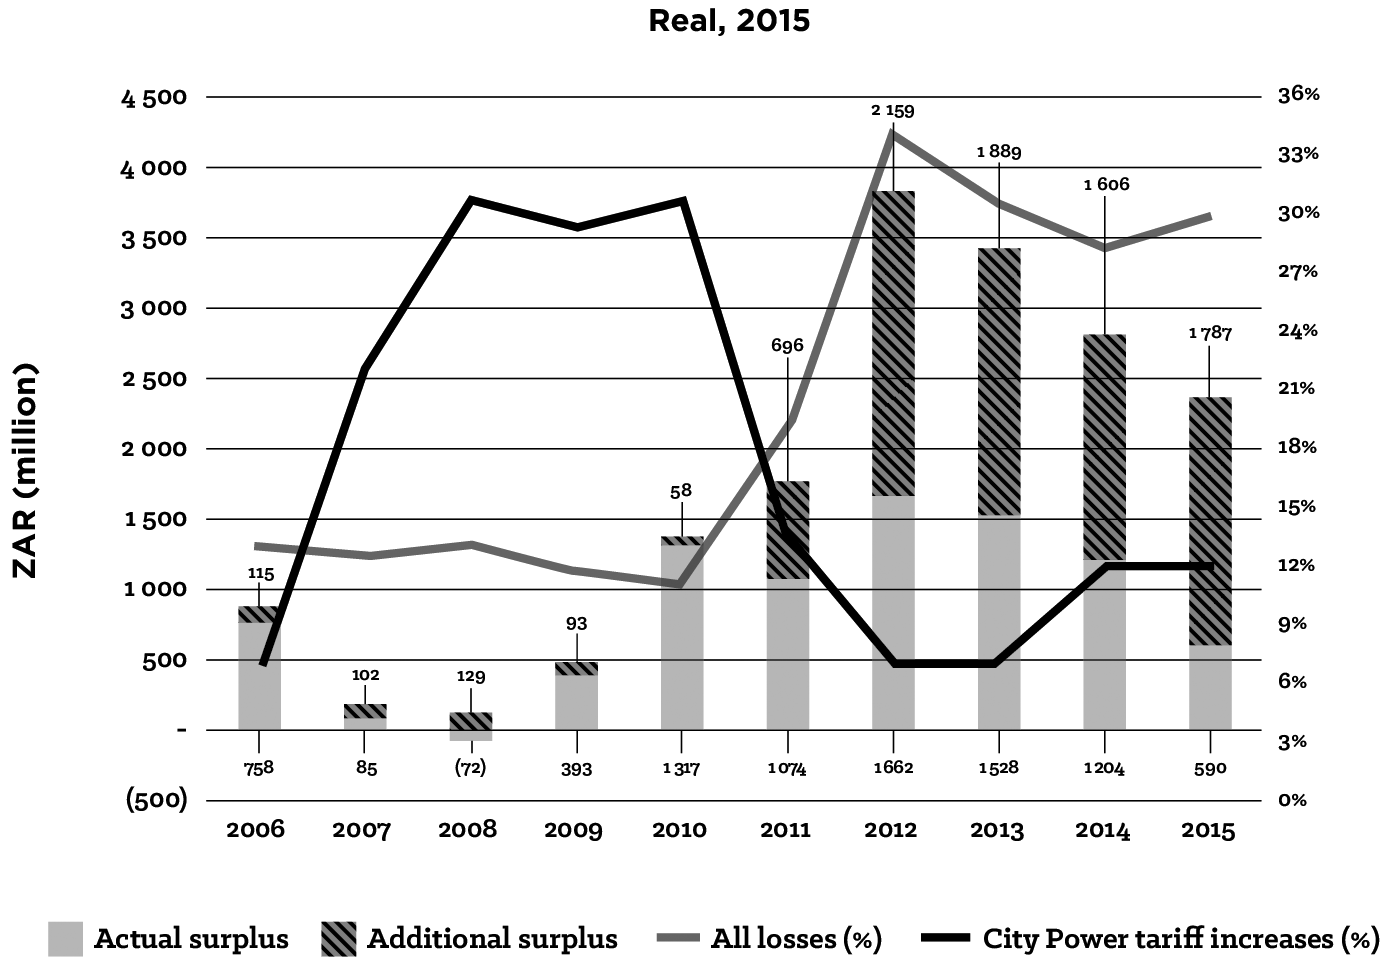
Business Model Conflicts Faced by CP Management
Competing priorities are a reality for every business and perhaps more so for government, which has the additional dynamics of having to service and satisfy its constituency, of needing to align with broader government policies and objectives, of dealing with institutional rivalries, and of adjusting to the presiding economic environment. In addition to the tariff-setting constraints detailed above, MEUs operate under a framework that imposes major conflicts. The most relevant of these are each discussed in their own section below.
National Energy Efficiency and Renewable Energy Targets (NEES)
The NEES of 2005 set an overall voluntary target of 12% by 2015, using 2000 as the baseline year.[31] The residential and commercial voluntary target was set at 15%. The post-2015 NEES[32] found that energy intensity improved by 23.7%, significantly more than the 15% target. However, the post-2015 strategy does not distinguish between the individual contributions of autonomous change (changes in structure of the economy), technological advancements, and deliberate policy interventions – where the first two would take place irrespectively, and thus this figure merely serves as a proxy to efficiency improvements and not as a like-for-like comparison.[33] The dilemma faced by CP, and by all municipal distributors, is one of split incentives. On the one hand, under the constitutional requirement of co-operative governance between the three spheres of government, CP (as are all MEUs) is obliged to implement national policy, which targets reduced electricity consumption. The implication thereof is a reduction in revenues. On the other hand, CP’s sole shareholder, who sets annual tariff increases, relies upon the electricity trading surpluses to fund its operations. Clearly, there is little incentive for CoJ or CP to actively pursue a nationally set voluntary target. The only area of congruence, where CP has an incentive to promote energy efficiency amongst smaller users, is in those they subsidise or who have a high percentage of bad debt. If the 2008 supply shortages are thrown into the mix, the CP strategy is understandable – a combination of measures for low-income programmes, which also satisfies social-welfare objectives, and load shifting over a total net reduction.
If a consumer is using [an] outdated and very inefficient lamp at night, when our Eskom tariff is the lowest, then that is not my problem. But if someone is using high-consumption, inefficient equipment in winter during peak periods, when I can only recover part of the tariff [selling at a loss] then I am going to do something about that.[34]
Single Supplier (Eskom) Means that CP is a Price-Taker
The legislative structure forces CP to buy from Eskom. A “very small contribution is sourced from Kelvin Power Station” (CP, 2016) and negligible amounts from IPPs. The existing legislative structure does not support municipal generation, and those in the private sector who would generate electricity must obtain a licence to do so from NERSA (with very few granted of any scale), or approval under a ministerial determination. This creates two issues, one direct and the other indirect, both with adverse consequences. The first, and direct effect, is that CP may not generate its own electricity, as it did very successfully in the past, and which is now viable with technological advances in RE. During the 1980s, when Orlando was operational, CP was able to negotiate discounts from Eskom. Conceivably, creating a competitive environment would result in a similar outcome. An added benefit would be improved energy security. The second, and indirect, effect is that Eskom continues to maximise its returns from the residential and commercial sectors, with a revenue-to-sales ratio of 1.56, while the same ratio for mining is 0.96, and 0.82 for the industrial sector (Thopil & Pouris, 2013) – effectively meaning that it will be selling electricity to these sectors at a discount. Coupled with the city’s requirement for high returns to fund other functions, the price of electricity in Johannesburg is the highest in the country (Table 5.7). Thus, the city continues to lose large users who are moving to surrounding areas that offer a lower rate. eThekwini, Tshwane and Ekurhuleni are nearby.
Source: Eberhard (2015)
Embedded Generation and the Death Spiral
Due to high electricity tariffs, supply shortages (blackouts), and increased environmental concerns, the residential sector has seen an increased uptake in photovoltaic systems – the price of which have also dropped – in households and small businesses. CP estimates that 30 MW has been installed in Johannesburg, and this figure is climbing.[35] This exacerbates the utility “death spiral”, which is an international phenomenon, and may spell the end for utilities, as embedded generation (self-generation; the most common form of which is through using photovoltaic panels) results in revenue erosion, declining profits, rising costs and weakening credit metrics. This prompted studies (see Janisch, 2013) and internal modelling by municipal distributors. The industry called for NERSA to pronounce guidelines and regulations, but after issuing a discussion document in 2015 followed by guidelines, these were withdrawn and were to be included in the DoE’s new licencing requirements for all generators. CP has implemented a policy of paying only 40c/kWh for electricity generated, way below the over R1.50/kWh it charges for supply. Very few are enticed by the offer, and opt to install outside the structure. CP acknowledges this is a problem, but as with their demand-side management programmes, has not acted.
5.7 Conclusion
In the more than two decades following the 1994 elections, two diverging realities appear to have been at play: policy and practice. Recognising that the existing ESI model, which had been in place for decades, had outlived its usefulness, government’s objective of reform was to address policy and practices that had become unsuitable or defective. Certainly, at face value, reform was necessary to deal with challenges that included:
- There being far too many MEUs, each of which had their own tariff structures;
- Non-cost-reflective tariffs;
- Many smaller- and medium-sized MEUs operating at a loss;
- A lack of capital investments to maintain and service the ageing and neglected EDI infrastructure;
- The inability of smaller- and medium-sized MEUs to hire and retain competent staff; and
- Efforts to reverse the practice of non-payment and theft of electricity failing, with the situation only worsening.
In seeking a solution, national government’s approach was certainly not haphazard – as has been shown. Looking back, more than anything, the period prior to and after 1994 was one that touted wholesale reform to improve service delivery. The review, however, has shown that little has come to pass, other than the licenced municipal distributors halving in number (400 to about 187). Electricity distribution, though, remains a primary contributor to municipal revenue, as it always has. Indeed, the self-reinforcing path-dependent phenomenon of increasing returns has not only seen warnings about its unsustainability dating as far back as 1930 go unheeded, but has also been significantly ratcheted up since 1994, despite national government policy to chart a new path.
- White women gained the right to vote in national elections on 19 May 1930. ↵
- Based on an interview with Richard Frantz, ex-CEO and director of MM, whose father was a municipal manager in Cape Town in the 1940s and 1950s. ↵
- Although the majority of the delegates at the conventions were electrical engineers, councillors and mayors were well represented and initially stayed for the full conference. These delegates represented different constituencies which mostly, but not always, led to the voicing of differing views. By the 1960s, as travel became more accessible and other issues were of greater priority, fewer mayors and councillors attended, and they generally only stayed for the keynote addresses. ↵
- The Ordinance was postponed due to an objection by the City of Cape Town. It never came into effect. ↵
- Town electrical engineer of Johannesburg, B. Sankey, in Municipal Magazine (1927). Sourced from Maud (1938). ↵
- The ECB was established under the Electricity Act of 1922 to regulate holders of licences, excluding local authorities, government departments, the former South African Republic, or self-producers not selling electricity. Marquard (2006, p.133) notes that the ECB had almost no capacity (with three to five board members and one staff member), finding no records prior to 1978. It appeared that the ECB’s time was taken up playing a mediating and facilitative role in resolving disputes of rights of supply and addressing consumer grievances. ↵
- The conditions are not stated in the minutes, but based on the tone and language, it is assumed that they were one-sided and favoured Escom. ↵
- A copy of the letter is not attached. The contents are derived based on the responses from the meeting minutes. ↵
- The author could not find meeting minutes in the archives, but references in the AMEU minutes make it clear that UME, AMEU, Escom and ECB were present. It is also likely that national government was represented, but this is not certain. ↵
- This information was gleaned during a meeting the author had with Stan Bridgens on 5 September 2016. ↵
- These included: Chamber of Mines, ANC, National Union of Mineworkers (NUM), National Union of Metal Workers of South Africa (NUMSA), Department of Mineral and Energy Affairs, Eskom, organised business, South African National Civic Organisation (SANCO), South African Agricultural Union (SAAU), UME, and the Energy Development Research Centre. ↵
- The terms “regionalisation” and “rationalisation” are used interchangeably in the various reports. The research quotes the term used based on the report being sourced. ↵
- NELF was formed in 1993, at which Eskom came to an agreement with the ANC that it would electrify 2.5 million homes between 1994 and 1999 (see “Phase IV: Regeneration (1985–1994)” on page 104). ↵
- Martin Pomeroy joined the municipality in 1959 and moved to the electricity undertaking in 1979. He was the city electrical engineer from 1992 to 1994 and the GM from 1995 to 1996. The author interviewed him on 27 January 2017. ↵
- The financial statements reflect the increase but provide no further explanation. The annual increase in the property tariff rose marginally from 3.97 cents to 4.1 cents in the rand, providing little insight. ↵
- Randburg was staunchly Afrikaans and an NP stronghold; giving it autonomy would entrench NP support. This was not the case in Sandton, and the NP’s motive here was to split the vote in a manner that would weaken the opposition’s chances of taking control of the Johannesburg municipality. ↵
- From a meeting on 5 September 2016 between the author and Stan Bridgens, former director of technical services of JEU. Bridgens was employed at JEU from 1958 to 1995. ↵
- It was concluded in the ERIC process that using provincial boundaries for REDs was not appropriate, as nine would be too many and some would not be financially viable (Conradie & Messerschmidt, 2000, p.317). ↵
- SALGA replaced the UME. ↵
- MEUs are subject to the Municipal Systems Act and the Municipal Financial Management Act (MFMA), whereas Eskom is a public entity and subject to the Public Finance Management Act (PFMA). The PFMA and MFMA are not consistent with each other. ↵
- The report, on the whole, was adopted by the DME in February 2001 as the strategy and blueprint to reform the sector. ↵
- All users taking supply at under 132 kV fell under REDs, while users above the threshold were supplied directly by Eskom. ↵
- Two months later, in December 2010, the government formally announced that Cabinet had taken the decision to terminate EDI restructuring. ↵
- The white population of South Africa primarily descended from British or Dutch nationals who, following the Anglo-Boer Wars, were distrustful of each other. However, the country attracted many migrants from Europe (Portuguese, Greek, Italian, Jewish and others) who tended to stick together. ↵
- In 1996, Martin Pomeroy, JEU’s GM, took early retirement, citing continual political interference. Budget allocated for capital expenditure or other previously agreed areas would be taken on short notice to pay for other municipal activities, resulting in an under-maintained network and low employee morale. The author gleaned this from an interview with Pomeroy on 27 January 2017. ↵
- This figure is not erroneous and represents an over-recovery. ↵
- One of the CP interviewees confirmed this practice to the author. The interviewee stated that 2015/16 was the first year that the CP tariff adhered to the NERSA-prescribed methodology, which derives the tariff from a weighted average: 70% of the increase is made up by Eskom’s tariff increase, and the remaining 30% of it is made up by an increase based on the Consumer Price Index (CPI). ↵
- Non-technical losses are made up of administrative issues (billing using estimates instead of actual readings, unread meters, incorrect billing, etc.) and non-administrative issues (illegal connections, theft, meter tampering, etc.). ↵
- See http://www.joburgadvocacy.org/ (accessed 17 February 2021). ↵
- The author gleaned this from interviews with employees of and consultants to CP. ↵
- Since the first NEES was published, this metric has always been uncertain, primarily because of the paucity of the available data and DoE’s inability to provide clear guidance. ↵
- As at the end of 2017, this has been circulated for public comment and finalised, but as yet it has not been adopted by Parliament. ↵
- Declines in energy intensity are a proxy for efficiency improvements, provided: a) energy intensity is represented at an appropriate level of disaggregation to provide meaningful interpretation, and b) other explanatory and behavioural factors are isolated and accounted for. See https://energy.gov/eere/analysis/energy-intensity-indicators-efficiency-vs-intensity (accessed 17 February 2021). ↵
- Interview with Paul Vermeulen, head of demand-side management at CP, 12 August 2016. ↵
- A workshop held in February 2020 heard from the South African Photovoltaic Industry Association that embedded generation was estimated at over 2 GW. This figure was validated by the Eskom representative. ↵
