1 Graphic Organizers: A Versatile Tool for Science Teaching
Content Outline
Graphic Organizers in Science Teaching
Matching Graphic Organizers to Science Content
Strategic Use of Graphic Organizers in Science Teaching
Use of a Single Graphic Organiser at Different Stages of Science Teaching
Digital Tools for Teachers in the Creation of Graphic Organizers in Science
Learning Outcomes
After completion of this chapter, we will be able to:
- elaborate on the meaning and types of graphic organizers in the context of science education.
- explain Gagne’s stages of teaching and detail how graphic organizers can be integrated into each stage to enhance science learning and engagement.
- illustrate the application of a single graphic organizer at different stages of science teaching to improve specific learning outcomes and engagement metrics.
- highlight the significance of various graphic organizers in promoting critical thinking and problem-solving skills among science learners, providing specific examples.
- propose innovative ways to create Open Educational Resources (OERs) that align graphic organizers with different stages of science teaching, specifying how these resources enhance effectiveness and accessibility.
1. Introduction
Alex and Anny, both experienced teachers passionate about innovative teaching strategies, are discussing their thoughts on graphic organizers. Let’s go through their conversation!
Alex: Hey Anny, have you ever tried using graphic organizers in your classroom?
Anny: Yes, I have! I think graphic organizers are such a fantastic tool.
Alex: Oh, absolutely! They really help create a visual structure to display internal thinking externally. Plus, they provide a platform for comparing information.
Anny: Exactly. They’re visual thinking tools that organize information and ideas in a way that’s so easy to understand and internalize.
Alex: And they do a great job of demonstrating relationships between facts, concepts, or ideas. It’s like they guide your thinking as you create and design a map or diagram.
Anny: They’re particularly helpful for students who struggle with arranging information. I’ve also read that they’re beneficial for people with cognitive challenges or neuro diversities.
Alex: Yes, definitely and there are so many different forms of graphic organizers, as concepts maps, flowcharts, Venn diagrams and timelines, each with its unique way of organizing and displaying specific pieces of information.
Anny: It’s fascinating how versatile they are. You can really tailor them to fit any kind of information you need to organize.
You might have ever tried graphic organizers in your classroom!
What are Graphic organizers?
Graphic organizers are visual thinking tools that help organize information and ideas in a way that is easy to comprehend and internalize.
Just Recall!
https://innoovativesciencepedagogy.h5p.com/content/1292337773347626297
2. Graphic Organizers in Science Teaching
Graphic organizers do more than just present information—they turn learning into a dynamic adventure. Picture your students creating vibrant concept maps that link together the stages of the water cycle or designing detailed diagrams that break down the intricacies of cellular processes. These activities not only clarify difficult subjects but also ignite the creative spark in learners, making science both fun and memorable.
So, why stick to traditional teaching methods when we can turn science lessons into a colorful, engaging, and interactive experience? With graphic organizers, we are not just teaching science—we are inspiring the next generation of creative thinkers and problem solvers!
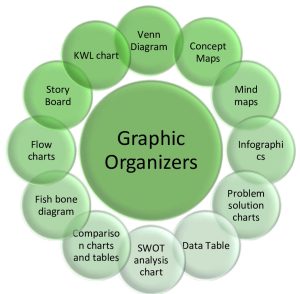
Fig 1: Some of the Graphic Organizers
Graphic organizers revolutionize science teaching by transforming complex concepts into visually engaging materials like infographics, concept maps, and diagrams. This not only simplifies learning but also makes it interactive and enjoyable for students. With various types of graphic organizers available (a few of which are depicted in Figure 1), teachers can cater to different stages of instruction, enhancing organization and structure in the classroom. These tools enable students to interact with science in a structured manner, promoting understanding and retention of scientific concepts. By integrating graphic organizers throughout teaching, teachers effectively scaffold students’ learning and facilitate the transfer of knowledge.
Imagine you are in a dynamic classroom where every element, from the subject matter to the age of the students, influences the choice of graphic organizers. Envision yourself navigating through various options, considering how each organizer aligns with your teaching expertise and the educational goals you have set. In this interactive setting, the “appropriateness” of graphic organizers is not just about ticking boxes; it is about meeting specific criteria and seamlessly integrating them into your teaching approach. Think about the impact of selecting the perfect graphic organizer- it is like adding a splash of colour to a canvas, enhancing the learning journey and sparking curiosity. So, let us explore together how these tools can elevate our teaching style, captivate our students’ attention, and create a truly engaging educational experience.
Web Quest: Additional Sources
- https://science-education-research.com/teaching-science/constructivist-pedagogy/concept-mapping/
- http://www.csun.edu/science/books/sourcebook/chapters/9-graphic-organizers/files/venn.html
- https://www.lucidchart.com/pages/tutorial/venn-diagram
- https://www.geeksforgeeks.org/what-is-a-flowchart-and-its-types/
- https://slickplan.com/diagram/what-is-a-flow-diagram
- https://www.readwritethink.org/classroom-resources/printouts/chart-0
- https://www.coursehero.com/file/91448453/Unit-7-what-is-photosynthesis-KWL-chartpdf/
Recommended Resources: Must-Watch Links
Reflect on This?
- Which graphic organizers have you used most often, and why?
3.Matching Graphic Organizers to Science Content:
Graphic organizers are invaluable tools for enhancing science learning However, choosing the right organizer for the specific type of scientific content is crucial for maximizing their effectiveness. Let’s explore some graphic organizers that are particularly well suited to different types of scientific content.
1.Flow charts: are best for Illustrating sequences, processes, cycles, or procedures.
Science example: Steps of the Scientific Method, Photosynthesis, Cellular Respiration, Rock Cycles, Food Chains, Food Web etc. In which each box represents a steps/inputs/outputs and arrows shows the progression in a direction.
2. Concept Maps: are best when objective is to represent relationship between concepts, showing hierarchy and connecting ideas.
Science examples: Classification of Living Things, Parts of Cell, Function of Cells, Newtons Laws of Motion, Structure of Atom etc. In which a central concept branches out into sub concepts and depict relationship, hierarchy and connect ideas among different concepts.
3. T-Charts: are best for when we want to compare and contrast two things, listing advantages and disadvantages or examine pros and cons.
Science examples: Mitosis Vs Meiosis, Renewable Non-Renewable Resources, Plant Vs Animal Cells etc.
4. Venn Diagrams: are best when objective is to show overlapping characteristics or shared and unique features between two or three concepts.
Science examples: Compare/Contrast Elements, Compound, Mixtures, Types of Rocks, Plant and Animal Adaptation etc. In which overlapping sections show shared characteristics common to both concepts.
5. Cycle Diagrams (or Circular Flow Diagrams): are best for the processes that are continuous and repeating.
Science examples: Water Cycle, Carbon Cycle, Nitrogen Cycle etc.
6. Timelines: are best for showing events in chronological order, illustrating historical developments, or outlining stages of a process over time.
Science examples: Geological Time Scale, Evolution of a Species, Stages of Star Formation etc.
The best use of graphic organizers is always depending upon the specific learning objectives and the nature of the content being taught.
Recommended Resources: Must-Watch Links
Just Recall!
Matching graphic organizers to science content – H5P.com
https://innoovativesciencepedagogy.h5p.com/content/1292338745652859757
Reflect on This?
- Would you like to try using a different graphic organizer instead of your previous choice? Why or why not?
4.Strategic Use of Graphic Organizers in Science Teaching
Like other subjects, science teaching employs various strategies for effective learning, with one standout approach drawing from Robert Gagne’s instructional design theory. This method emphasizes a hierarchical organization of instruction, where each stage builds upon the last. By aligning graphic organizers with Gagne’s Nine Events of Instruction, teachers can make science teaching more accessible and engaging for students. Introducing graphic organizers at different stages not only facilitates learning but also sparks curiosity among learners. With this in mind, let’s explore how integrating graphic organizers can enhance teaching and learning of science.
Let Us Know!
Robert Gagné was an American educational psychologist renowned for his work in instructional design. He made significant contributions to the science of learning and education, proposing a series of nine steps to ensure effective learning. Gagné’s theories are widely used in both traditional and e-learning environments to create structured and effective instructional experiences.
i. Gaining Attention
The foremost and most important task for any teacher is to grab the students’ attention. A science teacher can adopt a graphic organizer as an icebreaker to visually present a problem or introducing a concept that immediately engages learners.
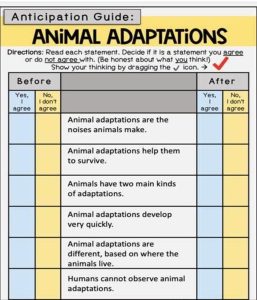
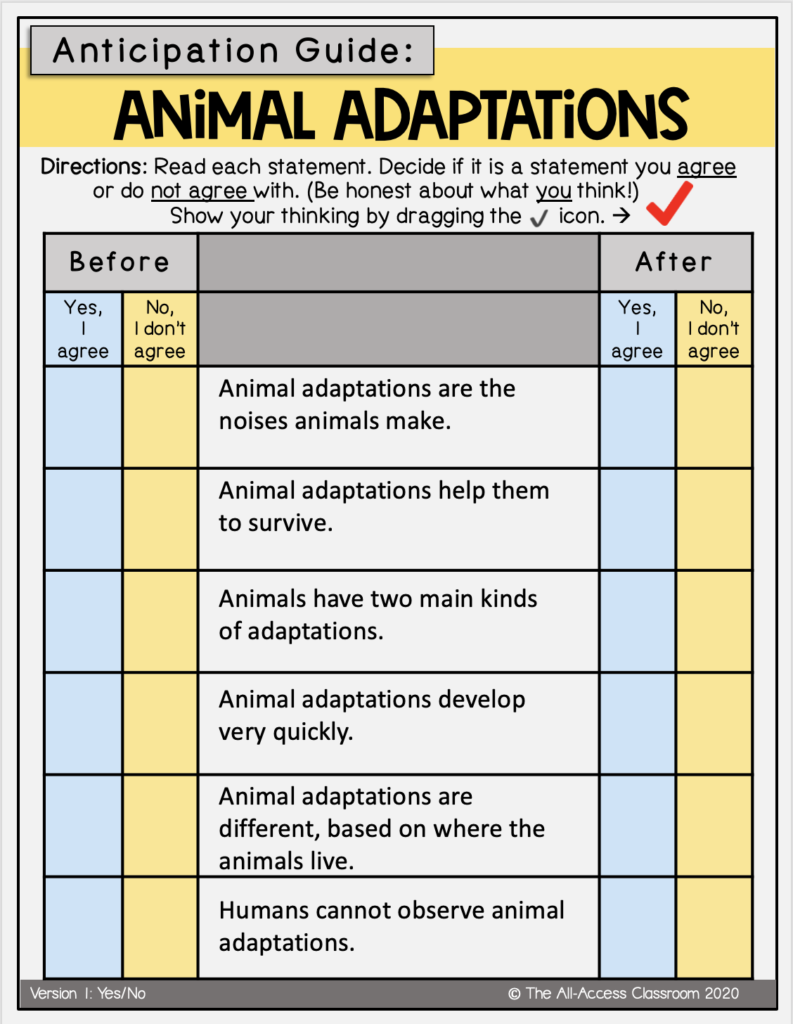
For instance, using an Anticipation Guide can be highly effective. This tool presents intriguing statements that pique students’ interest and provoke thought about the upcoming topic.
Example: If a science teacher wants to introduce animal adaptation, s/he can use an Anticipation Guide to activate prior knowledge about adaptations. This not only stimulates curiosity but also helps students make connections to new concepts. By engaging students right from the start, graphic organizers can set the stage for a dynamic and interactive learning experience.
A science teacher can spark curiosity and tap into students’ prior knowledge using graphic organizers like concept maps or KWL charts.
Imagine kicking off a lesson on photosynthesis by having students fill out a KWL chart. They can jot down what they already know (K), what they want to know (W), and, after the lesson, what they have learned (L) about this vital process. This not only activates their existing knowledge but also engages their curiosity, making the learning journey more interactive and meaningful. Graphic organizers transform the classroom into a lively space where students are actively involved and eager to explore new concepts.
Reflect on This?
- How do you capture your students’ attention as you embark on your teaching adventure?
- Which type of graphic organizer would you choose to ignite their curiosity and why?
ii. Inform Learners of Objectives
Teaching is a meaningful activity that is purposeful and based on objectives. If learners are acquainted with the “what” and “how” aspects of the lesson in advance—meaning what they will gain after completing the lesson and how they will gain it—their learning becomes meaningful. They can work actively with both mind and body. The teaching-learning process will no longer be limited to rote memorization but will focus on active learning. Hands-on experience and mind-on experience will go hand in hand.
To inform learners about the objectives of the upcoming content, a science teacher can create a roadmap or flowchart that outlines the learning objectives and what learners can expect to achieve. Graphic organizers can play an important role here as well. For instance, a Goal-Setting Chart can help learners understand and visualize these learning objectives.
Example: A science teacher might present a roadmap about cellular respiration, illustrating its different stages and the key concepts that students will understand by the end of the lesson.
Reflect on This?
- What type of graphic organizer do you find most effective for outlining the roadmap of a lesson to students?
- How do you use graphic organizers to communicate what students will learn after completing a lesson?
iii. Stimulate Recall of Prior Learning
Teaching is based on certain prerequisites, one of which is students’ previous experiences. New learning can only take place when the teacher is well acquainted with what previous knowledge their students have. Therefore, stimulating prior knowledge helps anchor the new learning. Graphic organizers can play an important role in this process. For instance, a science teacher can use a KWL chart (Know, Want to Know, Learned) to help learners connect new information with what they already know. This tool helps the teacher activate the learners’ prior knowledge and set the stage for new learning.
A science teacher can use a KWL chart to teach a new scientific concept such as the water cycle. Students list what they know, what they want to learn, and what they have learned through research and experimentation.
 Figure 2: KWL chart
A science teacher can use graphic organizers like mind maps or Venn diagrams to help students recall and connect their prior knowledge to the current topic.
For example, before studying genetics, students might create a mind map of what they know about heredity and traits.
Reflect on This?
- What type of graphic organizer would you choose to help students recall and connect their prior knowledge to the new topic you plan to teach, and what makes this organizer particularly effective for your teaching strategy?
iv. Present Stimulus Material
Graphic organizers are effective tools for presenting new stimuli to learners. Examples such as concept maps or mind maps are valuable for teachers to introduce new science concepts. They aid in organizing information and visually representing relationships between ideas, thereby making complex topics more understandable for students. Concept maps serve both instructional and assessment purposes and can be used on various platforms, including blackboards, notebooks, or digitally.
For example, when teaching about the human body, a science teacher can create a concept map detailing major anatomical concepts and their related sub-concepts. This visual tool enables the teacher to effectively illustrate and clarify the lesson content for students.
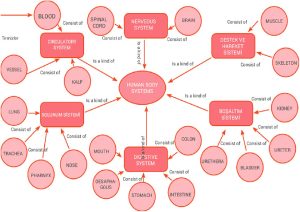
Source: Sozbilir, M.& NEACŞU, I. (2014). Alternative assessment and evaluation methods: A practical guidebook for teachers.
Not limited to concept maps and Venn diagrams, teachers have a variety of graphic organizers at their disposal to present stimuli, depending on the teaching context and factors such as teachers’ expertise, etc. For presenting the stimulus, science teachers can incorporate tools like flowcharts or sequence diagrams to explain content, aiding students in visualizing the steps or processes inherent in the scientific concepts being taught.
For example, when teaching about the water cycle, a science teacher might utilize a flowchart to illustrate the sequence of events involved.
Reflect on This?
- Why is it important for teachers to choose the appropriate graphic organizer when presenting new science concepts?
v. Provide Learning Guidance
Graphic organizers also serve as valuable tools for guiding learning. For instance, organizers like Venn diagrams or T-charts help learners effectively compare and contrast concepts. A science teacher can use a Venn diagram to visually illustrate relationships between different sets or groups of science concepts. Venn diagrams are particularly useful for highlighting comparisons, relationships, and intersections between diverse entities and ideas.
For example, consider a Venn diagram comparing plant cells and animal cells in terms of their structures. This diagram features overlapping circles or shapes, where each circle represents either plants or animals, and the overlapping area indicates shared characteristics. The non-overlapping sections highlight unique traits specific to each category.
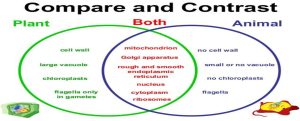
Source:https://wickedbiology.wordpress.com/wp-content/uploads/2016/01/compare-contrast-cells.jpg
A science teacher can also use concept grids or cause-and-effect diagrams to aid in organizing and structuring new information.
For instance, when teaching about ecosystems, a science teacher might provide students with a concept grid to categorize different components such as producers, consumers, and decomposers.
Reflect on This?
- Which type of graphic organizer would you choose to provide learning guidance, and why?
vi. Elicit Performance
Graphic organizers like Sequence Charts or Flowcharts are particularly effective in eliciting performances from learners. These tools allow students to fill in the steps or processes as they practice new skills or apply new knowledge. For example, in a science classroom, a teacher can use a Sequence Chart or Flowchart to guide students through the steps involved in an experiment or hands-on learning activity. This not only helps in reinforcing procedural knowledge but also in assessing students’ ability to apply scientific methods effectively.
Graphic organizers such as Concept Maps or Graphic Outlines further support students in organizing their thoughts and showcasing their understanding of a topic.
For example, a science teacher might provide students with a Concept Map to illustrate how different ecological concepts relate to each other. This visual representation not only aids in clarifying complex relationships but also enables students to demonstrate their grasp of ecological principles in a structured format.
Reflect on This?
- How can Sequence Charts and Flowcharts be used to enhance student performance and understanding during hands-on science activities?
vii. Provide Feedback
Graphic organizers can also serve as tools for providing feedback. A science teacher can utilize checklist or rubric graphic organizers to give structured feedback on learners’ performance. These Feedback Organizers help organize responses to student work, highlighting both areas of strength and areas for improvement.
Example: Imagine a science classroom where students have completed concept maps to demonstrate their understanding of ecological concepts. The teacher collects these concept maps and uses a rubric graphic organizer to assess each map for accuracy, completeness, and clarity of connections between concepts. During a class discussion, the teacher provides constructive feedback, praising accurate representations of relationships while suggesting improvements in connecting certain concepts more clearly. This process not only helps students refine their understanding but also encourages reflective learning and growth.
Reflect on This?
- How do checklist graphic organizers aid in delivering structured feedback on student performance in science experiments?
- Could you provide an example of using a graphic organizer to give feedback to students on any science topic?
viii. Assess Performance
Graphic organizers can serve as assessment tools themselves, allowing teachers to evaluate students’ understanding and mastery of the material. For instance, a science teacher may assign students to independently create or complete graphic organizer, such as concept map, to showcase their comprehension of a complex scientific concept.
Example: In a biology class, after learning about the process of photosynthesis, a teacher assigns students to create a concept map illustrating the key stages, inputs, and outputs involved. The concept map serves as an assessment tool by requiring students to accurately depict their understanding of photosynthesis. The teacher assesses the concept maps based on criteria such as accuracy of information, completeness of stages, and clarity of connections between concepts. This assessment not only evaluates students’ knowledge but also their ability to organize and communicate scientific information effectively using a graphic organizer. It provides valuable insights into individual learning outcomes and helps guide further instruction based on students’ strengths and areas needing improvement. Thus, graphic organizers like concept maps facilitate both formative and summative assessment in science education.
Reflect on This?
- Which graphic organizer do you most often use for assessing students, and why?
ix. Enhance Retention and Transfer
Teaching must facilitate learning, and learning becomes meaningful when it can be applied to new contexts. Proper organization and retrieval of content are essential for this purpose. The retention of information in a meaningful way should be the goal of every science teacher. Graphic organizers serve this purpose by facilitating retention. To enhance retention and transfer of knowledge, a science teacher can encourage learners to use graphic organizers such as mind maps or summary charts to review and apply what they have learned to new situations.
For instance, a science teacher might ask students to create a summary concept map or graphic organizer to help them review the key concepts covered in a unit on astronomy.
Reflect on This?
- In what ways can teachers effectively integrate graphic organizers into their teaching of scientific concepts to facilitate meaningful learning and comprehension in subjects like physics, chemistry or biology?
- How do graphic organizers contribute to enhancing students’ ability to transfer knowledge of scientific principles from one context, like classroom experiments, to another, such as real-world environmental issues?
5.Use of a Single Graphic Organizer at Different Stages of Science Teaching
A single graphic organizer such as mind map can be used at different stages of teaching, Mind map is a visual tool used to organize and represent information in a hierarchical and interconnected manner. It typically starts with a central idea or topic and branches out into subtopics or related concepts. Mind maps use colours, images, and keywords to enhance memory and understanding. They are often used to brainstorm ideas, summarize information, or outline complex topics in a clear and structured format. A single graphic organizer, such as a mind map, can be effectively applied at different stages of science teaching. For example, let’s explore how a mind map can be utilized at various teaching stages:
Let’s Explore Mind Maps !
For induction: A science teacher can assess learners’ prior knowledge and introduce new information or content using mind maps. For example, if a science teacher wants to teach students about the process of photosynthesis, she can use a mind map to evaluate their previous understanding of plants, including types of plants, leaf colours, and sources of food. She can then introduce the upcoming session’s content with a mind map.
For presentation: A science teacher can effectively present new content using mind maps. For instance, she can explain the process of photosynthesis, emphasizing that it occurs in plant leaves due to chlorophyll pigment. Plants produce their own food using carbon dioxide and water in the presence of sunlight.
For discussion: A science teacher can encourage students to create mind maps and discuss their understanding of the topic.
For assessment: Mind maps can serve as valuable tools for formative and summative assessments in science education. For example, a science teacher can ask students to create a mind map illustrating the process of photosynthesis as a form of assessment.
For summarization: Mind maps are also useful for summarizing topics after they have been taught. For instance, after completing a lesson on photosynthesis, a science teacher can create a mind map summarizing the process in plants.
Just Recall!
The Versatile Graphic Organizer – H5P.com
https://innoovativesciencepedagogy.h5p.com/content/1292339553321392327
7.Digital Tools for Teachers in the Creation of Graphic Organizers in Science
Gone are the days when teaching methods were supposed to be little dynamic. Over the past decade, education has undergone a significant transformation, evolving to meet the demands of our tech-savvy world. Today’s teachers are no longer just dispensers of knowledge; they are digital maestros, seamlessly integrating technology into their classrooms.
In this new educational landscape, being a digitally savvy teacher is not just an advantage—it is a necessity. Staying updated with the latest technological advancements is an integral part of the teaching profession. One tool that has stood the test of time, yet adapted to the digital age, is the graphic organizer.
While the concept of graphic organizers is not new, the ways in which they are utilized today have evolved dramatically. Modern teachers leverage digital tools to create and implement graphic organizers that are not only engaging but also highly effective in enhancing student learning.
We recommend a few selections of digital tools and techniques that are perfect for creating graphic organizers. Some of these tools are free, while others might require a subscription, but all are invaluable in crafting interactive and dynamic educational resources. Take a look at Figure 2 for a visual guide to these tools.
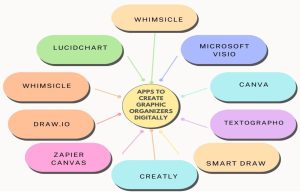
Figure 3: Some Digital tools for the creation of graphic organizers in science
These digital tools showcase the versatility of graphic organizers in science education. They help students:
Organize Information: Break down complex scientific concepts into manageable parts, making challenging scientific ideas more accessible.
Make Connections: Link different ideas and understand relationships between them, encouraging students to think critically and make connections.
Analyze Data: Visualize and interpret scientific data effectively.
Enhance Understanding: Gain a deeper comprehension of scientific principles through structured visual aids, aiding in the retention of information.
By integrating modern tools and techniques, we can prepare our students for the challenges and opportunities of tomorrow. So, dive into these tools, experiment with new techniques, and watch your classroom transform into a hub of digital learning and discovery. So, empower your students with the skills they need to thrive in an increasingly digital world and inspire a love of lifelong learning.
More to explore!
The list of digital tools and techniques for creating graphic organizers is ever-growing. Don’t stop at just our suggestions—there are countless more out there waiting to be discovered. Keep exploring to quench your thirst for innovation and creativity! Dive in and uncover new tools every day!
Must Read
- https://www.researchgate.net/publication/270847050_Usage_of_Graphic_Organizers_in_Science_and_Tecnology_Lessons
- https://www.researchgate.net/publication/44745163_Using_Concept_Maps_to_improve_Scientific_Communications/download?_tp=eyJjb250ZXh0Ijp7ImZpcnN0UGFnZSI6Il9kaXJlY3QiLCJwYWdlIjoiX2RpcmVjdCJ9fQ
- https://www.semanticscholar.org/paper/Concept-Mapping-in-Science-Class%3A-A-Case-Study-of-Asan/761741316489753c1e6599deccb3d08d4b63e3de
- https://www.researchgate.net/publication/333403936_A_Novel_Method_for_Teaching_the_Difference_and_Relationship_Between_Theories_and_Laws_to_High_School_Students
- https://sciencesforce.com/index.php/hsse/article/view/102 An Instructional Strategy to Introduce Pedagogical Content Knowledge Using Venn Diagrams
- https://www.tandfonline.com/doi/full/10.1007/s10972-012-9272-5 Pedagogical Content Knowledge Development in Experienced Biology Teachers in Their First Attempts at Teaching a New Topic
- https://link.springer.com/chapter/10.1007/978-981-10-5149-4_14 THE EXAMPLES OF PHYSICS CONCEPTS FORMATION BY THE USE OF KWL STRATEGY
- https://dergipark.org.tr/tr/download/article-file/334000 The impact of using the modified Know-Want-Learn strategy in physics teaching on students’ metacognition.
- Https://www.sajournalofeducation.co.za/index.php/saje/article/view/2096/1233
