4
Learning Objectives
After reading this section, you’ll be able to:
- Apply popular strategies for reading and comprehending to digital and online materials
- Use online tools to create visualizations of readings and course materials
Strategies have existed for years to help students (and professionals) better remember and understand what they’ve learned. To use these for online or digital media takes a little adaptation. Below, you can read a summary of a few popular strategies and find references to others.
SQ3R
One popular reading strategy is SQ3R (or sometimes SQ4R). Here are the steps for SQ3R, adapted to include videos or audio content:
Survey:
Before you start reading or watching, flip through the entire reading (or look at the site where the video appears). Look for headings, pictures, links, or other information that gives you an idea of what you’re about to encounter. Sometimes, this means looking for information the instructor provided about where a resource came from. It might also involve briefly searching online for information about the author or presentation.
Question:
Using that information you just scanned, come up with a few questions you have about this reading or video, and write them down.
Read (or Watch):
Now, go through the materials. Focus your reading or viewing on answering the questions you came up with, almost as though you’re on a hunt for this information.
- If you’re reading, go one section at a time. If you see an answer to one of your initial questions, jot it down, along with a page number (where possible) of where the answer was found. If a new question pops up, write it down, too. Otherwise, focus just on reading and understanding what’s in that short section.
- If you’re watching or listening to materials, go through one short time-span at a time. Start with 5-7 minute blocks, but don’t be afraid to reduce to 3-5 minute blocks if you’re having trouble staying focused. Jot down or make notes about answers to any of your initial questions, and mark down the time in the video where the answer was found.
Recite
With the reading closed or the video paused, try to remember what the main point of what you’ve just seen was. Write that main point down, along with any lingering questions or notes.
- This step traditionally involved actually saying the main point out loud. This is a great practice, and modern technology offers us new ways to do it. If you’d like to experiment with recalling ideas with audio, try recording yourself at the end of each chapter using a mobile phone app, or make quick videos of yourself recalling chapter contents.
- Feel like paper is more comfortable? Write section notes, or use Post-It notes or notecards at the end of each section to keep notes organized.
Review
- After you’ve completed the reading or viewing, review your notes. Recite the main point of the entire thing and the major sub points. If you can’t remember what they were, refresh your memory by using your notes or recorded recitations.
Other reading and note-taking strategies can be used with a variety of materials. Here are a few others to explore:
- Cornell Notes
- KWL (Know, Want to Know, Learned) charts
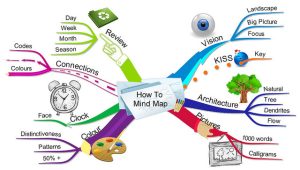
Concept Maps or Mind Maps:
(This section was adapted from “Assignment Type: Concept Maps” by Kent State Online and released under a CC-BY 4.0 License. See the original document here).
What is it?
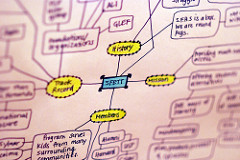 A concept map is a visual organizer that can enrich your understanding of a new concept. Concept maps are visual diagrams that outline the relationship between
ideas and concepts. They include:
- a focus question
- topics or concepts in boxes or circles, and
- linking words to connect concepts.
They usually include concepts enclosed in a circle or box, cross-linked to show relationships with other concepts. The cross-links include linking words or phrases to describe the relationship between the two concepts. Most concept maps organize concepts in hierarchical order, with the most general or over-reaching concepts near the top, and more specific concepts subsumed near the bottom. This type of concept map is frequently used to organize knowledge by showing the relationship between concepts.
However, there are many types of concept maps lending themselves to a variety of applications. They can include (closed-loop) feedback systems, continuum scales, flowcharts or process flow diagrams, and hierarchical tree diagrams.
Why use it
Concept maps help us organize new information by allowing us to make meaningful connections between main ideas and other information. Instead of writing notes, which can feel like an unconnected list, maps force us to draw connections between ideas. They help us deepen understanding and comprehension. Concept maps have been used to communicate complex ideas, stimulate creativity, capture knowledge, and to increase meaningful deep learning.
Concept maps build on existing knowledge and allow us to explore relationships between ideas. Concept mapping is also often used for group brainstorming, collaborative, or cooperative learning activities.
How to use it
A concept map is a great way of summarizing what you’ve read, listened to, or watched. You can draw one by hand or use software to construct one. First, though, you need the information to do it. Most concept maps include the following steps:
-
Identify the major ideas or concepts presented in a selection of text as you read.
- This can happen by highlighting major ideas, jotting them down in a list, or by starting to map ideas as you read by drawing them out in circles.
- Organize the ideas into categories.
- As points come up in the reading, add them into categories or start to rank them in importance. For example, I might watch a video where someone tries to convince me about an idea, and then I might categorize their points as “statistics” or “emotional.” If I’m reading a textbook, I might list the section headings and rank them from most to least important.
- Don’t worry about getting this right the first time: Your organization may change as you continue to read and add more information.
- Construct the map from the notes you’ve taken:
- Place the main idea(s) or question at the center.
- Draw subpoints around it in other shapes (circles, squares, etc.). The lower the “rank” of the idea, the further from the center it will be.
- Use lines or arrows on the map to represent how ideas are connected to one another, a particular category, and/or the main concept.
- Limit the amount of information on the map to avoid frustration.
- Write in the connections you see between ideas on the lines that connect the concepts.
There are many concept mapping programs available. Many programs offer a 30-day free trial, but others are free to download and utilize. In addition, many have tutorials built into the website to help you get started. You can also find mapping tools in popular writing programs, listed in the flowchart section.
Once you’ve created a map, make sure you return to it when you need to recall information. If you draw by hand, consider taking a picture with your smartphone so that you can review it on the go (and so you have a back up copy).
Sketchnotes
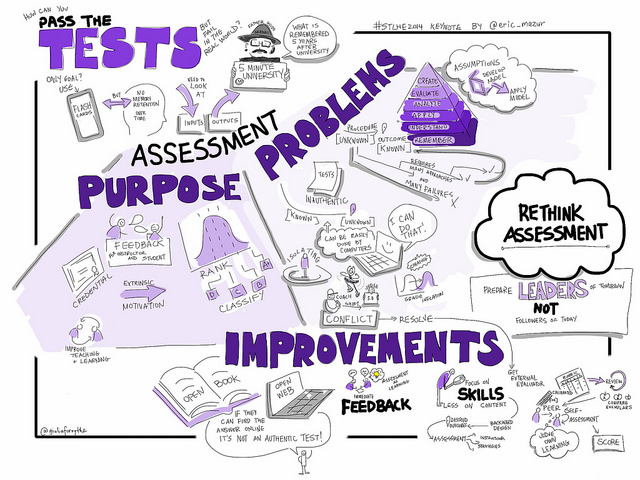
A small but dedicated online community has sprung up around the concept of “sketchnotes,” which is a method of drawing out ideas from lectures or videos in a visually appealing way. These can be drawn by hand or digitally on a tablet, and they can be multicolor or black-and-white.
In general, sketchnotes can be simple sketches created while listening to materials, or they can be more complicated drawings put together from beginning notes or sketches taken during a talk, video, or reading. The basic steps for sketchnotes are loosely:
- Create a title to get started. This can be the title of the lecture or work, or it can be the question you’re trying to answer by watching/reading.
- As the talk/video/reading gets going, listen closely to what’s happening. Don’t try to take word-for-word notes.
- Sketch out (both in words and small pictures) the major points you encounter.
- At the end or as you have time, fill in connections or larger pictures around each of the main points.
Sketchnotes (or doodling with a purpose during a lecture/video) help the mind process what’s being said into an engaging visual medium. It can also provide a way to draw connections between ideas. In addition, the visual appeal of the notes would make them something that’s more fun to return to than the standard list-and-numbers note-taking method.
The Sketchnote Army blog maintained by the designer, Mike Rohde, who coined the term and process for Sketchnotes has plenty of examples: Here’s one from a college, where students developed their note-taking skills over a term. It even includes example illustrated notes from math classes.
