11
The most recent updated version of this chapter is at: https://opentext.ku.edu/teams/chapter/gantt-chart/
From Wikipedia, the free encyclopedia
Introduction
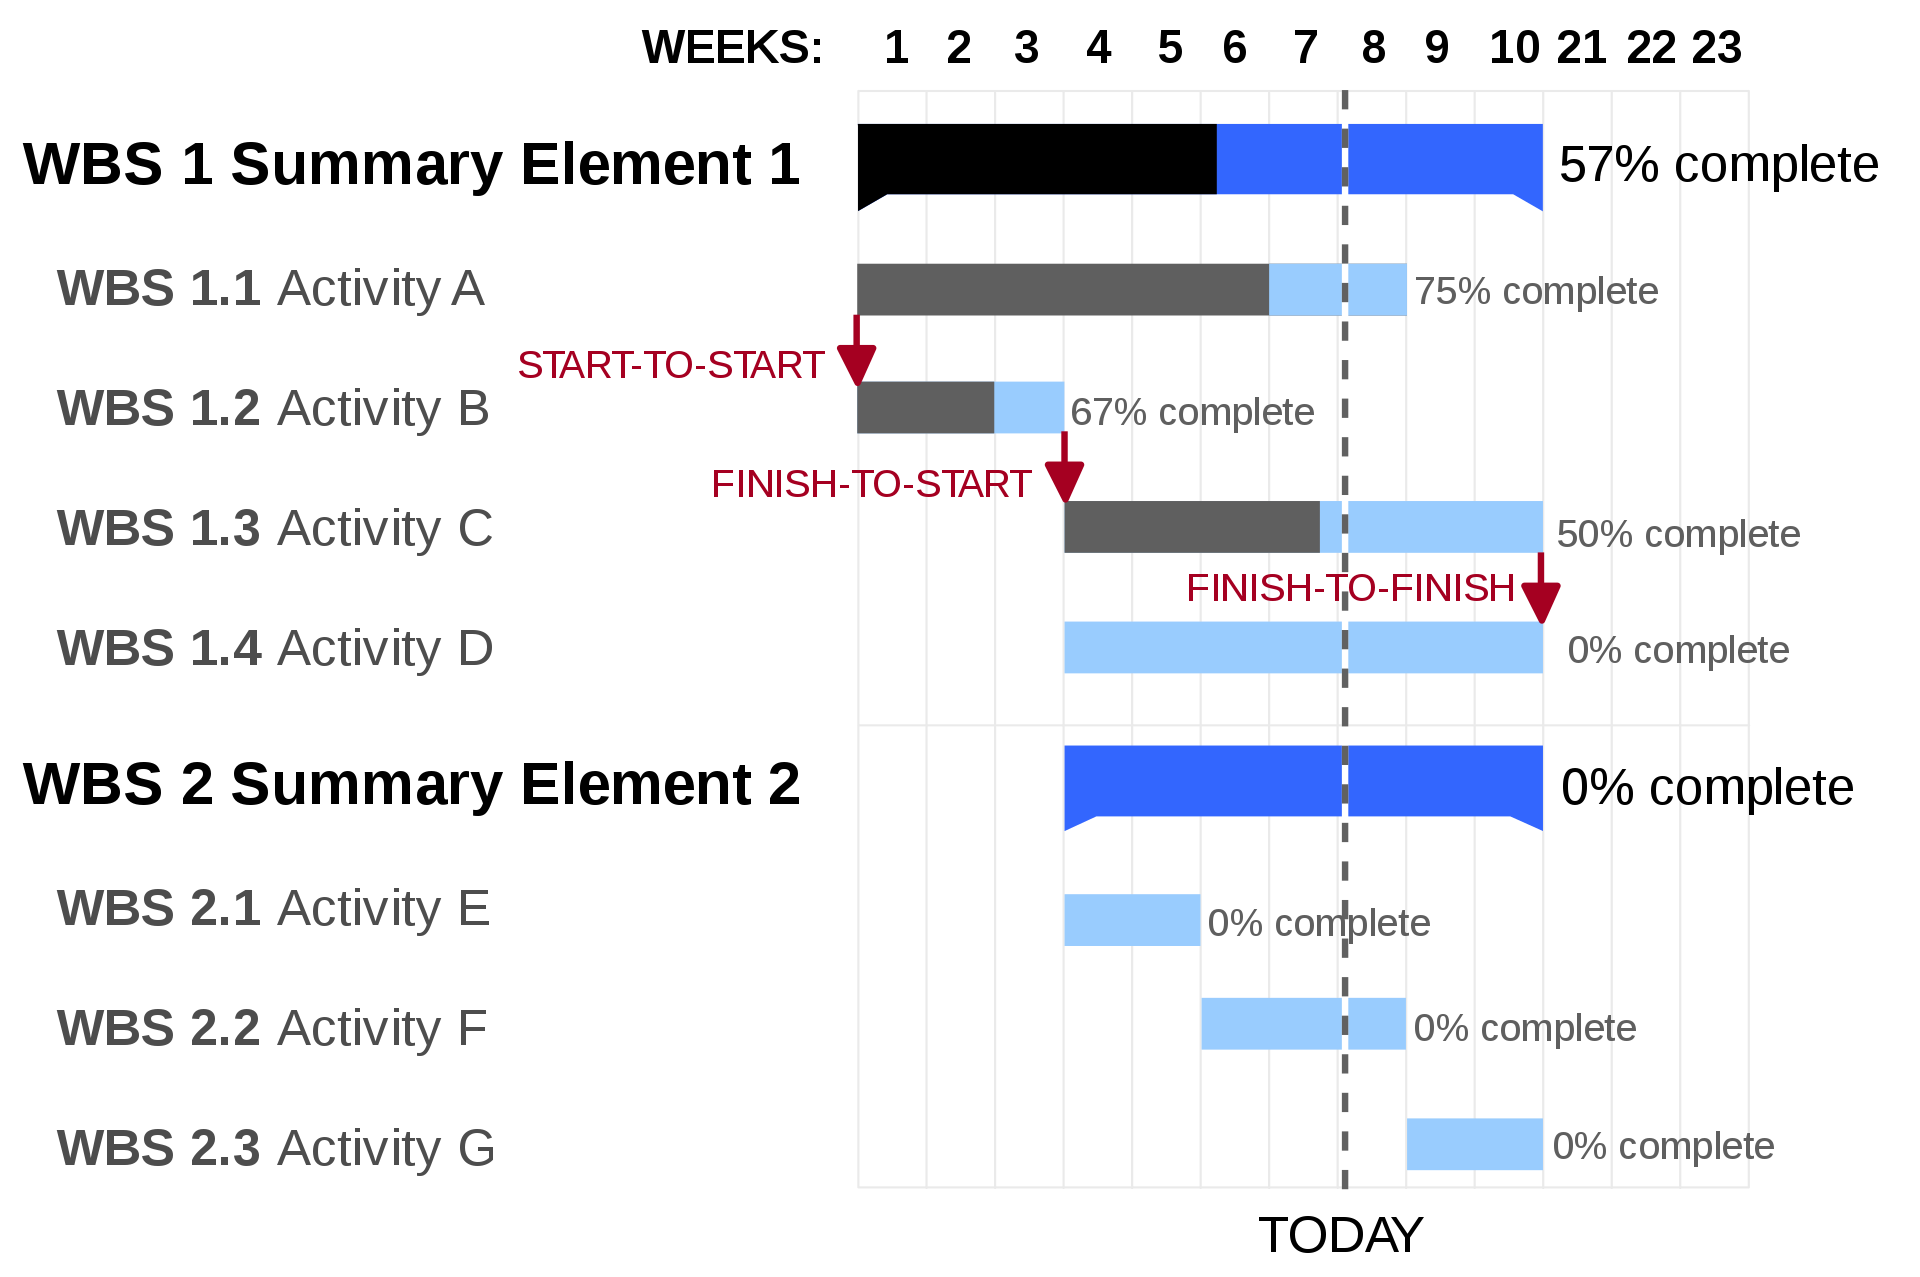
A Gantt chart is a type of bar chart[3][4] that illustrates a project schedule.[5] This chart lists the tasks to be performed on the vertical axis, and time intervals on the horizontal axis.[3][6] The width of the horizontal bars in the graph shows the duration of each activity.[6][7] Gantt charts illustrate the start and finish dates of the terminal elements and summary elements of a project. Terminal elements and summary elements constitute the work breakdown structure of the project. Modern Gantt charts also show the dependency (i.e., precedence network) relationships between activities. Gantt charts can be used to show current schedule status using percent-complete shadings and a vertical “TODAY” line as shown here.
Gantt charts are usually created initially using an early start time approach, where each task is scheduled to start immediately when its prerequisites are complete. This method maximizes the float time available for all tasks. In 1999, Gantt charts were identified as “one of the most widely used management tools for project scheduling and control”.[3]
Example
In the following table there are seven tasks, labeled a through g. Some tasks can be done concurrently (a and b) while others cannot be done until their predecessor task is complete (c and d cannot begin until a is complete). Additionally, each task has three time estimates: the optimistic time estimate (O), the most likely or normal time estimate (M), and the pessimistic time estimate (P). The expected time (TE) is estimated.
| Activity | Predecessor | Time estimates | Expected time (TE) | ||
|---|---|---|---|---|---|
| Opt. (O) | Normal (M) | Pess. (P) | |||
| a | — | 2 | 4 | 6 | 4.00 |
| b | — | 3 | 5 | 9 | 5.33 |
| c | a | 4 | 5 | 7 | 5.17 |
| d | a | 4 | 6 | 10 | 6.33 |
| e | b, c | 4 | 5 | 7 | 5.17 |
| f | d | 3 | 4 | 8 | 4.50 |
| g | e | 3 | 5 | 8 | 5.17 |
Once this step is complete, one can draw a Gantt chart or a network diagram.
-
 A Gantt chart created using Microsoft Project (MSP). Note (1) the critical path is in red, (2) the slack is the black lines connected to non-critical activities, (3) since Saturday and Sunday are not work days and are thus excluded from the schedule, some bars on the Gantt chart are longer if they cut through a weekend.See this tutorial from Microsoft Office for a step-by-step guide to creating a Gantt chart in excel. If you’re reading the text version of this book, visit support.microsoft.com and search for Gantt Chart.

Using Gantt Charts – Exelon Development (a Tech Company):
Progress Gantt charts
In a progress Gantt chart, tasks are shaded in proportion to the degree of their completion: a task that is 60% complete would be 60% shaded, starting from the left. A vertical line is drawn at the time index when the progress Gantt chart is created, and this line can then be compared with shaded tasks. If everything is on schedule, all task portions left of the line will be shaded, and all task portions right of the line will not be shaded. This provides a visual representation of how the project and its tasks are ahead or behind schedule.[20]
A Gantt chart is essentially a tool for project management. According to an article on Asanda.com (a company specializing in project management software), the Gantt Chart typically includes the following pieces of information:
- When the project is due
- When to start and finish each task
- How long each task takes
- Who is responsible for each task
- Which tasks depend on others
- How each task is categorized or grouped
Citations
- ^ Jump up to:ab Gantt 1910.
- ^ Jump up to:ab Morris 1997, p. 7.
- ^ Jump up to:abcdef Klein 1999, p. 49.
- ^ Richman 2002, pp. 97, 117, 276.
- ^ Kumar, Pankaja Pradeep (2005). “Effective Use of Gantt Chart for Managing Large Scale Projects”. Cost Engineering. Morgantown, WV: American Association of Cost Engineers. 47 (7): 13–21. ISSN0274-9696. OCLC209778284.
- ^ Jump up to:ab Richman 2002, pp. 117, 276.
- ^ Jump up to:ab Selig 2008, p. 235.
- ^ Jump up to:ab Flouris & Lock 2012, p. 236, Chapter 12.
- ^ Wilson 2003.
- ^ Marsh 1974, p. 32.
- ^ Weaver 2012a, pp. 5–6.
- ^ Weaver 2012b, pp. 4–6.
- ^ Weaver 2017, pp. 6–7.
- ^ Weaver 2017, p. 7.
- ^ Weaver 2017, p. 6.
- ^ Clark 1922.
- ^ Jump up to:ab Flouris & Lock 2012, p. 281, Chapter 14.
- ^ Kelly, D. J. (2004) “Marxist Manager Amidst the Progressives: Walter N. Polakov and the Taylor Society“, Journal of Industrial History, 6(2), November 2004, 61-75
- ^ Olson, Richard G. (2015). Scientism and Technocracy in the Twentieth Century: The Legacy of Scientific Management. Lexington Books. ISBN9781498525718. Retrieved 25 September 2018.
- ^ Klein 1999, pp. 56–57.
- ^ Flouris & Lock 2012, p. 239, Chapter 12.
References
- Asanda.com (n.d.) New to Gantt charts? Start here. Retrieved from https://asana.com/resources/gantt-chart-basics
- Clark, Wallace (1922). The Gantt Chart: A Working Tool of Management. New York, NY: Ronald Press.
- Flouris, Triant G.; Lock, Dennis (2012). Managing Aviation Projects from Concept to Completion. Ashgate Publishing Limited. ISBN978-1-4094-8613-8.
- Gantt, H.L. (1910). “Work, Wages and Profit”. Engineering Magazine. New York.; republished as Work, Wages and Profits. Easton, Pennsylvania: Hive Publishing Company. 1974. ISBN0-87960-048-9.
- HEUSSER, M. (2020, MARCH, 17) WHAT’S THE PURPOSE OF A GANNT CHART FOR LARGE SCALE PROJECTS? ACCESSED AT https://searchsoftwarequality.techtarget.com/tip/Whats-the-purpose-of-a-Gantt-chart-for-large-scale-projects
- Klein, R. (1999). Scheduling of Resource-Constrained Projects. Operations Research/Computer Science Interfaces Series. Springer US. ISBN978-0-7923-8637-7.
- Marsh, Edward R. (1974). “The Harmonogram of Karol Adamiecki”. Academy of Management Proceedings: 32. doi:10.5465/ambpp.1974.17530521. ISSN0065-0668.
- Morris, Peter W. G. (1997) [1994]. The Management of Projects. Thomas Telford. ISBN978-0-7277-2593-6.
- Richman, L. (2002). Project Management Step-by-step. Amacom. ISBN978-0-8144-2657-9.
- Selig, Gad J. (2008). Implementing IT Governance: A Practical Guide to Global Best Practices in IT Management. Van Haren Publishing. ISBN978-90-8753-774-6.
- Weaver, Patrick (2012a). “Henry L Gantt, 1861–1919: A retrospective view of his work”(PDF). PM World Journal. Retrieved 29 January 2018. (It is unclear when this was last modified. The PDF metadata indicates 2015, and a note in the text says “Augmented with additional materials received since publication”.)
- Weaver, Patrick (2012b). “Henry L Gantt, 1861–1919: Debunking the myths, a retrospective view of his work”(PDF). 1 (5). Retrieved 29 January 2018.
- Weaver, Patrick (2017). “A Brief History of Scheduling: Back to the Future”(PDF). Retrieved 29 January 2018. Adapted from “A Brief History of Scheduling: Back to the Future”(PDF). PM World Journal. 3 (8). 2014. Adapted from an even earlier 2006 presentation.
- Wilson, James M. (2003). “Gantt charts: A centenary appreciation”(PDF). European Journal of Operational Research. 149 (2): 430–437. doi:10.1016/S0377-2217(02)00769-5. Archived from the original(PDF) on 26 November 2013. Retrieved 28 July 2013.
