1
Brian R MacIntosh1, Michael Tschakovsky2 and Jared R Fletcher3
1Faculty of Kinesiology, University of Calgary
2 School of Kinesiology and Health Studies
3Dept Kinesiology, Mount Royal University

Photo 3-1
Mountain Bike Launch. Like launching a study of the physiological response to exercise, mountain biking can be an exploration into unknown territory.
Source: https://pixabay.com/en/utah-mountain-biking-bike-biking-95032/ no attribution required.
Learning Objectives
After reading this Chapter, you will be able to:
- Describe the scope of topics covered in this textbook.
- Understand how to interpret some general graphic representations of data.
- Understand some fundamental concepts important for learning exercise physiology.
- Describe how statistical evaluation allows interpretation of data.
- Understand the concepts of validity and reliability.
- Find additional information on exercise physiology, from reliable sources.
Key Terms
research, Canadian Society for Exercise Physiology, exercise intensity, exercise physiology, graphs, half-time, exercise intensity, inferential statistics, kinetics, moderate to vigorous exercise, rate of oxygen uptake (O2), partial pressure, proportionality constant, skinned fibre, time-constant, variance
Introduction
In this chapter, important information that will help you learn exercise physiology is provided and the range of topics to be covered in this textbook is introduced. Some fundamental concepts of exercise physiology are presented and some general hints and tips that will serve to enhance your learning of exercise physiology are provided. It is recognized that there is a unique language of exercise physiology and you will be introduced to the Glossary that will help you understand this language. You will be introduced to some normal values for physiological measurements that are commonly made during exercise. This chapter also provides some background on the science behind the study of exercise physiology and some basic information about National and International organizations that promote the work of professional and academic exercise physiologists.
Using the Glossary
There is a good reason that there is an extensive Glossary with this textbook (see Glossary). As you begin to read this textbook, you will notice that exercise physiology seems to have a language all to itself. To master an understanding of exercise physiology it is very important that you understand the meaning of the terms that are unique to this field of study. Language is the way we communicate concepts and ideas, so it is incredibly important that you learn the language (jargon) of exercise physiology. The Glossary can help you learn this language.
Rather than spend a few hours now, learning what is in the Glossary, it would be advisable to learn the new terms and expressions as you make your way through the textbook. To help you with this learning, important terms that are in the Glossary are presented in bold and purple type when used in a given chapter. When you come across a term that is bolded and purple, make sure you understand the meaning of the term before you progress further through the textbook. This is a digital textbook so it provides a direct link between the term in the text and the Glossary. Make use of the Glossary whenever you are in doubt of the meaning of one of these bolded terms. If you come across other terms you are not familiar with, be sure to look up the meaning before you continue reading. If you believe others would benefit from having a definition for a term that is not currently defined, feel free to contact the Editor.
Learning the Meaning of a Word from the Context
It is an important and valuable skill to be able to learn the meaning of a word from the context of its use. This is not always possible, but when it is, you might be able to detect subtle differences in the way some authors use a given term. It is useful to be able to do this, and something that you should watch out for, as you read. A good example of a term that can have different meaning with different authors is “anaerobic threshold”. This is a key term for exercise physiologists, and it is important that you have a good understanding of its meaning. When you get to this topic in the textbook (the term appears in several chapters), you might want to have a look at a review (Svedahl & MacIntosh, 2003) to gain more insight into this complex concept, and the common misrepresentations associated with it. Poole and colleagues have recently published a comprehensive review of the topic (Poole, Rossiter, Brooks, & Gladden, 2020).
In research articles dealing with exercise physiology, the terms that are used are often defined by the author or implied by the way in which something is measured. For example, it has become customary to define muscle fatigue as a decrease in maximal isometric force. This is a very restricted definition of fatigue. It means that fatigue can only be detected when effort or nerve stimulation allow maximal activation of a muscle or muscle group. It also means that length change cannot occur, so the contraction to evaluate fatigue must be isometric. With this definition of muscle fatigue, decreased performance while cycling on an ergometer cannot necessarily be attributed to fatigue. In cases like this, the definition is not very useful, beyond the scope of the research article. It is important to realize that the concept of fatigue probably does exist beyond the scope of some limiting definitions (MacIntosh & Rassier, 2002).
A Comment about www and Wikipedia
The world-wide web (www, also known as the internet) is a potentially valuable source of information, but in many cases, there is no guideline to tell you what you should accept and what you should take with a grain (or more) of salt. Believe it or not, not everything you find on the web is true! Anybody can say anything on the web. Your ability to critically evaluate the information you are presented with, is a valuable skill.
Wikipedia is an open online dictionary. Anyone can contribute a definition, and the rules of contribution encourage methods of verification; (About Wikipedia). However, mistakes do occur, and when you consult Wikipedia for the definition of a term, you should be cautious. Nevertheless, Wikipedia is improving with time, so our Glossary provides links to additional information, often from Wikipedia. However, in some cases we decided that the definition provided in Wikipedia was not specific enough to exercise physiology and the use of that definition is not encouraged. In these cases, no link to Wikipedia is given.
A Few Key Concepts in Exercise Physiology
Exercise is a systematic use of skeletal muscles to move the body. These skeletal muscles need energy to contract and generate heat in addition to force development and movement. Muscle contraction results in changes in ion distribution across the membranes of our muscle cells and increased use of fuel and O2 and production of CO2. These changes result in a disturbance to homeostasis; a disruption to the environment inside and outside the cells of the body. For example, the activation of nerve and muscle cells during exercise will result in a decrease in intracellular potassium concentration [K+] and an increase in extracellular potassium concentration. These changes in [K+] represent disturbance to the neutral environment that we maintain for the benefit of our cells. Control mechanisms are in place to recognize this disturbance, and make adjustments to the movement of K+ across membranes throughout the body including in the kidneys to help return the plasma and extracellular fluid concentration of K+ to the normal level. Similarly, we all maintain our arterial blood pressure within narrow limits. Our body has regulatory mechanisms that allow this control of arterial blood pressure in the face of changes in our external environment: posture, physical activity, or changes within our body such as blood volume, and vascular resistance. There are many other physiological parameters that require similar control as part of homeostasis, from such things as ion concentrations both within cells and in the space between cells, or body temperature.
Exercise represents a considerable challenge to homeostasis. For skeletal muscle to maintain contractile activity, it requires the maintenance of an appropriate environment surrounding the muscle fibres. This environment is the interstitial space. It also requires the maintenance of an appropriate environment within each skeletal muscle fibre (the intracellular space) and the replenishment of adenosine triphosphate (ATP), which is the “energy currency” of the body, at a rate that matches its consumption. As you will learn in subsequent chapters, the many processes involved in muscle contraction use a number of substances and produce a number of other substances, and heat. If homeostasis is the maintenance of relatively stable conditions, then you can appreciate that muscle contractions add some and remove other substances both within and between muscle cells and are therefore disrupting homeostasis. Minimizing such disruption requires mechanisms that balance the removal or addition of these substances. Exercise physiology is essentially about the mechanisms in skeletal muscle that create muscle contraction force (Chapter 5) and use energy, and the myriad of mechanisms in muscle cells and other physiological systems that act to offset the disturbance to homeostasis that results from skeletal muscle contractions (Chapters 7, 8, 9, 10 and 11).
The fluid between the muscle fibres changes with respect to a number of ions, substrates (glucose and fatty acids) and gas composition. These changes extend into the blood flowing through the muscles and the blood flow transmits these changes through-out the body. In order to minimize the disturbance to homeostasis and to return to that state following exercise, sensors must detect the disturbance to homeostasis and changes must be made to restore the composition of extracellular and cellular spaces. This restoration is accomplished by control and regulation. The concept of control and regulation is described below, but first, an example of some of the physiological changes associated with exercise will be presented.
Jill is a middle-aged working mom of three. When lunch break comes she tells her colleagues that she is “going out to get some exercise!” It is a beautiful summer day and she starts off on a brisk walk. It is quite hot at this time of the day. As Jill begins her walk, we would notice that her breathing increased, and if Jill felt her pulse she would be able to confirm that her heart rate has increased to a level (115 beats per min) well above the rate when she was sitting at her desk (75 beats per min). After a while, Jill also begins to sweat. If we could take a blood sample, we could measure changes in concentration of several things in her blood. Venous oxygen content decreases and carbon dioxide increases. Plasma [K+] increases but just a little bit because her exercise is of a moderate intensity. Concentration of glucose will not likely change in the arterial blood, but might be decreased in venous blood. When she finishes her walk and returns to her work space her breathing and heart rate would eventually decrease to where they were prior to the walk and she would eventually stop sweating. Other changes would also change towards the preexercise values.
So, why and how do these (and a myriad of other) familiar physiological responses to exercise occur? Will Jill eventually be able to walk/jog faster and for longer if she regularly exercises? What physiological changes occur and why? How do these changes allow her to exercise with less disturbance to homeostasis? The chapters in this textbook address these questions. But first, in this introductory section we will establish an understanding of key concepts and principles that govern all physiological function. There are many physiological systems with countless “parts” and complexity that are involved in meeting the challenge of exercise. These key concepts and principles are universal in dictating how the body systems interact to achieve the required integrated physiological response necessary to support exercise. Understanding these principles and learning to recognize their components in physiological systems will allow you to not just know facts about exercise physiology, but to be an exercise physiology problem solver. In other words, strive to understand how and why the body responds the way it does during exercise.
Control and Regulation
In order to survive, the volume, temperature and composition of the extracellular fluid must be controlled very carefully. A parameter that is controlled is something that is kept as constant as possible. For example, the following parameters are controlled: blood pressure, plasma [K+], [Na+], [H+] and body temperature. Control means there is a set point, or target value for the parameter being controlled, a means to detect the current value and effectors to regulate or bring the current value back close to the set point. Sensor(s) detect the current value, and inform the controller (usually the brain) so it can compare the detected value with the set-point. If a difference is detected, the controller will regulate effectors that allow changes to keep the parameter within a narrow range of values. If blood pressure falls, baroreceptors detect the change and inform the brain of the current value. The brain regulates effectors like the heart and blood vessel smooth muscles to modulate the pressure back to the desired level. If blood pressure falls below the set-point, like it might when you stand up too quickly, the brain will send a message to the arterioles to constrict, increasing blood pressure. The brain would also send a message to the heart to increase cardiac output, contributing to the restoration of blood pressure. This kind of control system is referred to as feed-back control (see below for another example).
Our body is organized in such a way that the concentration of various substances, processes and physical parameters are controlled as carefully as possible, so disturbance to homeostasis can be minimized. Our body accomplishes this objective by regulating the movement of ions through ion channels and pumps, mobilizing or sequestering substrates and activating or inhibiting smooth muscle. Even total body water is controlled. Fluid loss by sweating is a mechanism to lose heat from the body, but fluid content of the body is controlled, so loss of fluid from the body results in a regulated decrease in loss of fluid by the kidneys, and initiating a thirst mechanism to increase fluid intake.
There are two key principles of physiological function that allow us to understand the processes that disturb homeostasis and the mechanisms that act to minimize such disturbance. These principles are universal to all the physiological processes involved in all of the physiological systems addressed in this textbook on exercise physiology. The first is the principle of mass balance, and the second is the principle governing the movement of a substance, or its conversion from one form to another as occurs in metabolism. We will call all such movement and conversion “flow”, so this is the principle of flow.
Mass Balance Principle
If homeostasis is the tendency to maintain a specific environment within acceptable limits, mass balance represents the fundamental components of such a process. First, there is the “mass”. In this context, mass refers to any substance or quantity of energy in the form of heat, in a given compartment. Your body is a compartment and body temperature would be the mass of heat in that compartment. Your circulation is a compartment and blood volume would be a mass in that compartment. Your muscle cell is a compartment and ATP would be a mass in that compartment.
Next is the movement of a given mass into a compartment (we will call this “inflow”) and out of a compartment (we will call this outflow). There may be a number of inflows and outflows. For the mass of heat in the body, metabolic processes that produce heat would represent an inflow. Evaporation of sweat which releases heat into the environment would represent an outflow. Absorption of water into the blood at the small intestine would be an inflow for the mass of fluid in the circulation. Removal of water from the blood by the kidneys would be an outflow for the mass of blood in the circulation. Splitting of ATP into adenosine diphosphate (ADP) and inorganic phosphate (Pi), a metabolic process, would be the outflow for ATP. Production of ATP through the metabolic pathway of glycolysis would be an inflow for ATP.
The above examples are analogous to a lake with one or more rivers flowing into it and one or more rivers flowing out. If the inflow rivers have the same total flow as the outflow rivers, then the volume of the lake remains constant. If it rains upstream and more water enters the inflow rivers, the inflow to the lake will increase relative to the outflow and the water level of the lake will rise until it increases the flow in the outflow rivers enough to match that of the inflow rivers. With no further rain, the inflow will gradually return to that before the rain, the lake level will decrease and ultimately so will the outflow until we are once again at the original lake level with the original inflow and outflow balance.
Figure 1-1 illustrates mass balance where the compartment is a cell. Each of the substances illustrated has inflow and outflow, and the concentration of a substance (think of this as a mass of the substance) in the cell is determined by the balance between the inflow and outflow for that mass. A disturbance to the stability of the masses in the cell would have to disrupt the balance between the inflow and outflow for that mass, and physiological mechanisms would have to counteract this disruption by having an opposing effect on the balance of inflow and outflow. This dynamic is illustrated in Figure 1-2. As you read the chapters in this textbook, try to define every substance as a mass and identify the compartment within which that mass exists. Then identify what the inflows and outflows for that compartment mass are. Not all of those masses are “homeostatic”. In other words, not all need to be kept in narrow limits, but rather some may be changed in order to achieve an important physiological function.
Based on the above, it now makes sense to ask what determines a flow, given that changing inflow relative to outflow is the fundamental process of mass balance. This brings us to the key principle of Flow.
Flow Principle:
So, what creates flow? And what determines the magnitude of flow? The flow of any mass requires an energy gradient. If we consider in Figure 1A the inflow of oxygen into the cell, that gradient would be represented by the amount of oxygen outside the cell relative to the amount inside. The more oxygen there is outside relative to inside the cell, the larger the gradient from outside to inside the cell. In this case the energy gradient is a concentration gradient. The type of “flow” here is diffusion, whereby random movement of molecules means that if there are more molecules of oxygen outside the cell, the number of molecules moving into the cell will be greater than the number of molecules moving out, such that there is a “net” flow of oxygen into the cell. There are other types of energy gradients and you will come across them as you read the chapters of this textbook. What is important to recognize is that the flow created by an energy gradient will increase as the gradient increases, and decrease as the gradient decreases.
Figure 1-2 illustrates the concept of an energy gradient in the form of two individuals on either side of a table on wheels. Energy is in the form of the force each is exerting on the table. If the force exerted is equal, there is no energy gradient and the table will not move (“flow”). However, if the person on the right decreases the force they are applying, there is now a greater force from left to right and the table will move at a rate that is proportional to the difference in force applied by the two individuals. If the individual on the left now increases their force, this difference will increase and the table “flow” will increase further.
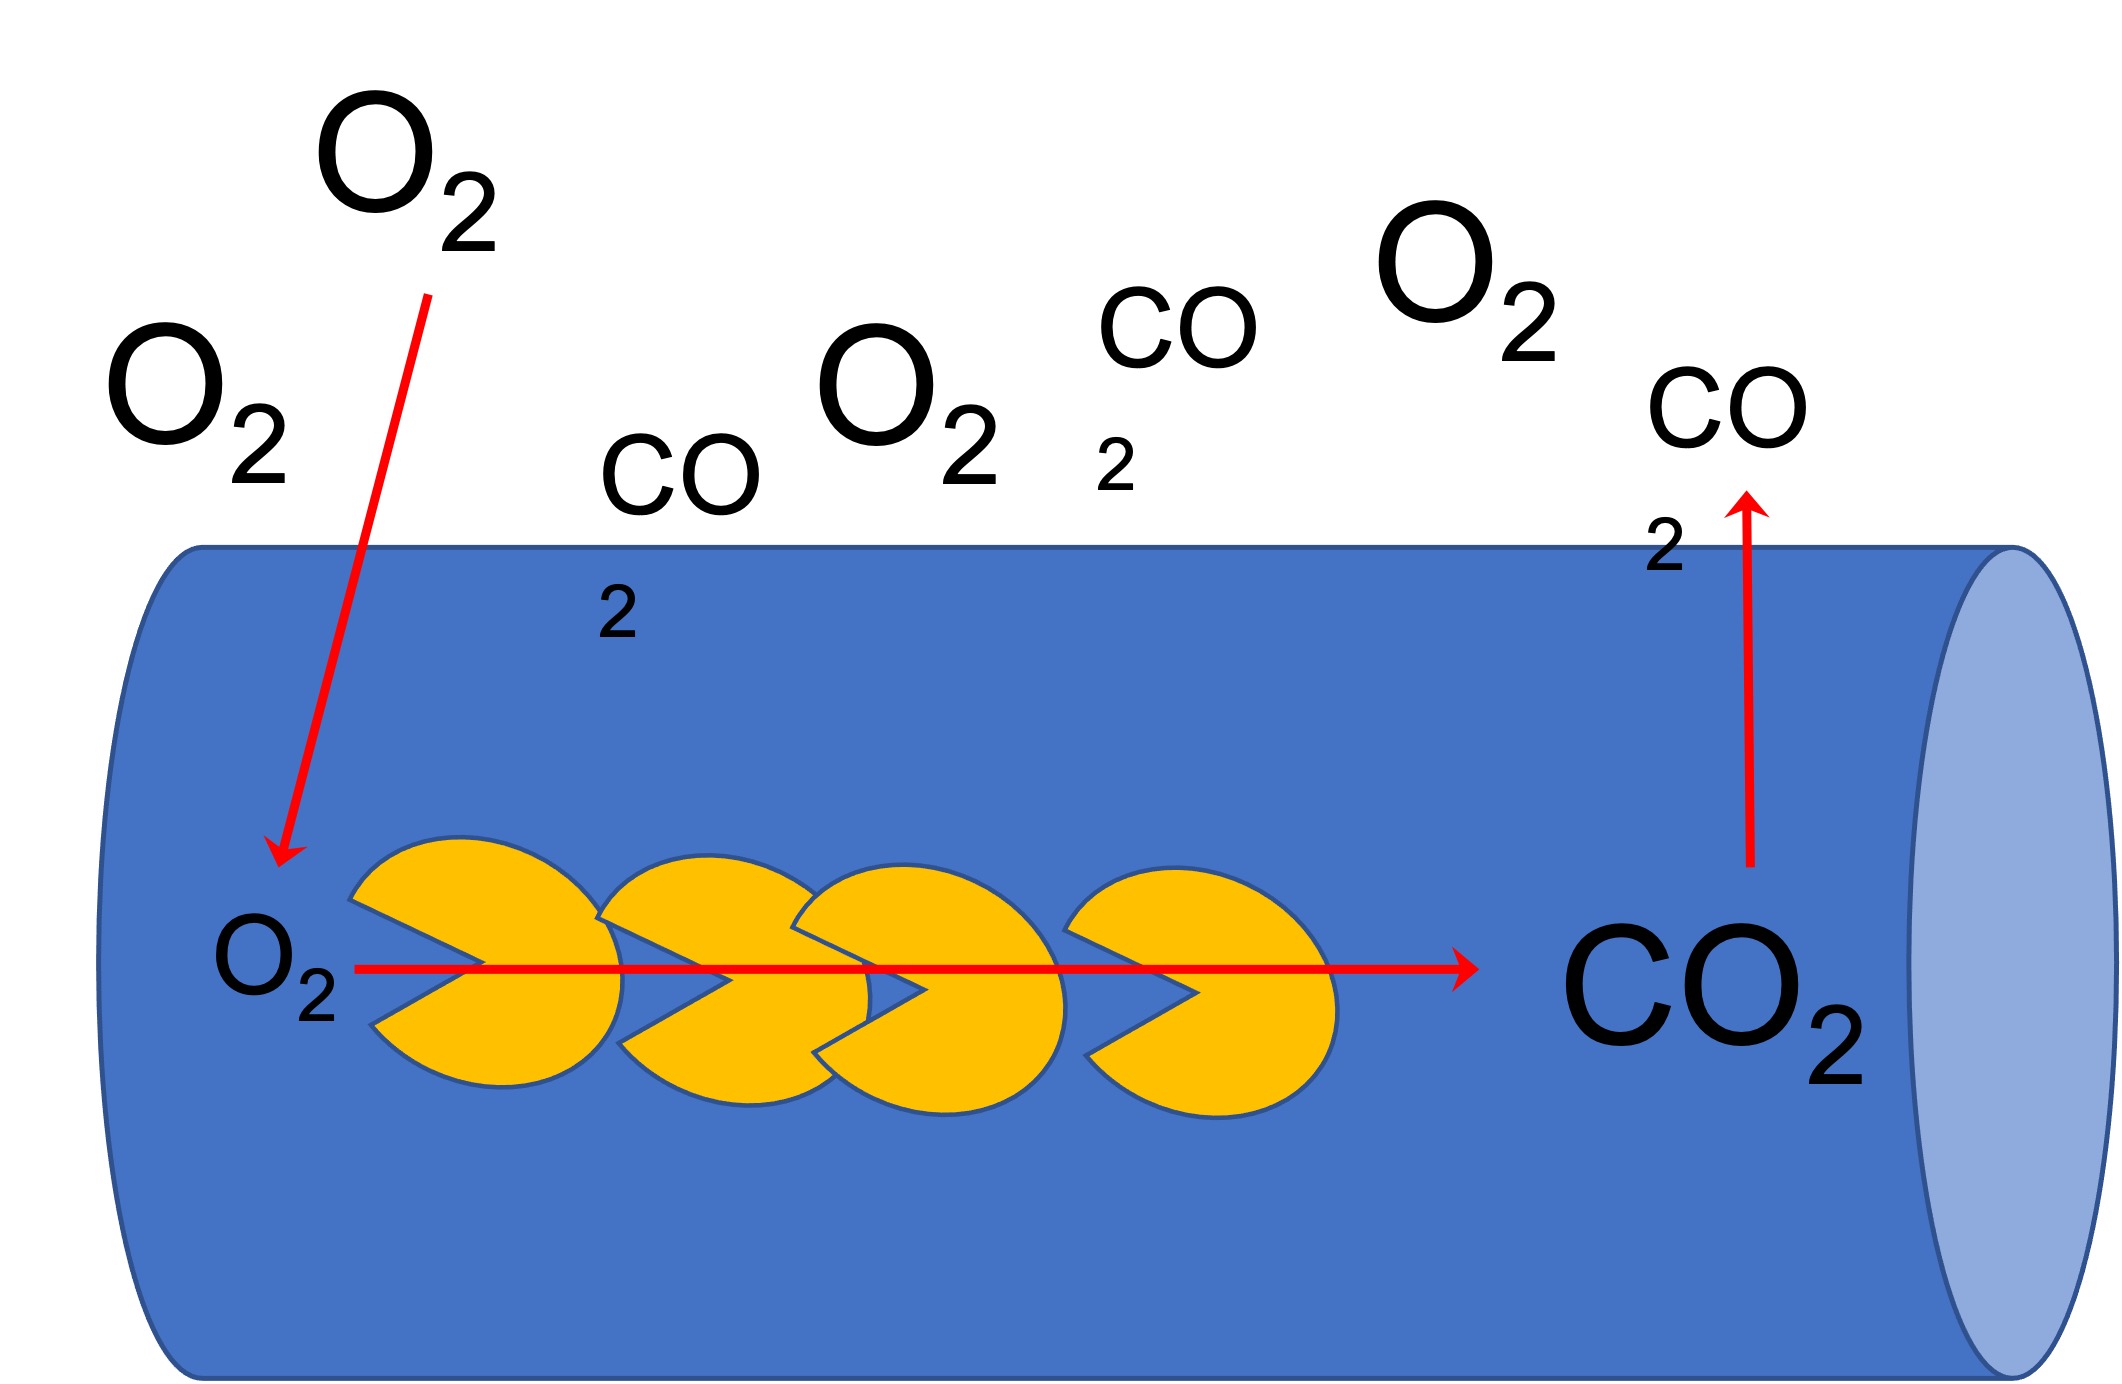
The use of oxygen in metabolism represents an outflow of O2 from the cell. The corresponding production of CO2 represents an inflow. To keep mass of O2 and CO2 constant, there must be an inflow of O2 and an outflow of CO2. A concentration gradient (difference in partial pressure) is needed for the flow of O2 into the cell to maintain total cell content of O2. Similarly, there must be a partial pressure gradient for CO2 to move out of the cell. In Figure 1-1, the size of the gas molecule represents the concentration and the red arrows show the flow of O2 and CO2. These concentration gradients are maintained by blood flow and the diffusion of O2 out of the capillaries and CO2 into the capillaries as the blood flows past the cell.

There is another factor that determines flow which we will call “conductance”. Conductance refers to the “ease” with which flow can occur for a given energy gradient. The greater the conductance, the greater the flow. In physiological systems there are structures and characteristics of structures that determine conductance for the flow of a substance. If we take the example in Figure 1-2, you can well imagine that if the table is on a smooth floor it is easily moving from left to right in proportion to the difference in force (i.e. the gradient) applied by the two individuals. However, if the table were to move onto a carpet, it would slow down with the same force gradient. We can think of the “conductance” for movement of the table on wheels to be lower on carpet than on a smooth floor. The inverse of conductance is resistance. It refers to the same thing but rather than describing the ease with which flow can occur it describes the opposition to flow. So the carpet would have less conductance for, but more resistance to, the movement of the table on carpet than the smooth floor. In this textbook you may find places where resistance is the term used and others where conductance is the term used. Just remember they refer to the same characteristic as just described.
So FLOW = Energy Gradient x Conductance
or, FLOW = (High Energy – Low Energy) x Conductance
Now let us return to the mass balance model in Figure 1-1 where disturbances change inflow relative to outflow of a mass in a compartment, and physiological mechanisms can counteract that via opposite effects on inflow/outflow balance. Based on the flow principle, you should now recognize that there are only two factors that can be manipulated in order to affect inflow/outflow balance and thereby virtually all the physiological processes you will learn about in this textbook on exercise physiology! Either disturbances and physiological mechanisms can affect either a gradient or a conductance. That’s it!
So, as you read the chapters in this textbook, try to identify flows and the gradient which creates flow and the conductance which allows flow. Recognize that when flows change in the body, it is because either a gradient or a conductance for that flow has been changed.
Given the above, the next question you might ask is, “how are flows controlled in order to determine mass balance?” This is where the concepts of feed-forward and feed-back control are helpful to understand.
Feed-forward control:
When a parameter is regulated in anticipation of a change in mass, and the regulation reduces or prevents disturbance to homeostasis, this is called feed-forward control. For example, ventilation increases at the instant that exercise begins, before any change in oxygen content of the blood can be detected. This increase in ventilation prevents or minimizes the decrease in oxygen content of the arterial blood.
Feed-back control:
When something is controlled within narrow limits by detection of that something to inform a control mechanism of the current value and that control system can effect change to bring that something back towards the controlled value, then the system is referred to as feed-back control.
The nature of the human body is that from minute to minute the size and general composition of intracellular and extracellular fluid is preserved. Consider the possibility that exercise results in increased use of glucose as a metabolic substrate. Increased uptake of glucose by muscle cells will result in a decrease in blood glucose concentration. Blood glucose concentration is regulated by a feedback control mechanism. Blood glucose concentration is continuously monitored by cells in the pancreas. When the blood coming to the pancreas has lower concentration of glucose, the cells of the pancreas will secrete glucagon. Glucagon is a hormone that mobilizes glucose from the liver by accelerating glycogenolysis. This is an example of a feed-back control system that does not require the brain to compare sensor input and respond by changing or regulating some effector in the body. The brain is bypassed by the cells in the pancreas that respond directly to the change in blood glucose concentration.
Elastic Recoil
Elastic recoil is another universal concept in physiology. Many tissues in the body have a tendency to return to their original size by elastic recoil. This is true for individual cells, organs and tissues. A good example of this elastic recoil is seen on observation of the lungs. When we breathe in, the lungs are expanded but when we relax the inspiratory muscles (primarily the diaphragm), the lungs have a natural tendency to return to their natural relaxed size. Exhaling is a passive process during resting ventilation. Blood vessels and airways have a natural elasticity as well. Even individual cells have an elastic recoil when they are temporarily expanded by fluid moving into them.
Sources of Additional Information
Access and Type of Information
It is almost certain that you will find several topics presented in this textbook, for which you will want additional information. This is a general textbook on exercise physiology, in which it is impossible to cover all topics that are relevant to this broad and expanding field of study, and for which most topics can only be covered at a superficial level. Advanced study on any topic, or clarification of the information presented here can be obtained from a number of sources, including: advanced and specialized textbooks, the internet, journal articles, the Gatorade Sport Science Institute, and conferences and seminars. Each of these sources will be described briefly here.
Internet
The internet brings a wealth of information, and misinformation, to your fingertips with the simple typing of a few search terms. The ease with which this information is made available brings with it a serious concern. Do you know who put that information there? In most cases, the answer is no, and in all cases, it is important to consider this information with some degree of skepticism. The “value” of information you find on the internet depends on how it got there and when it got there. Keep in mind that much of what is presented on the internet is the opinion of the writer. Another writer might very well have a different opinion.
Listed in Table 1.1 are several internet sources, and an associated crude index of certainty for the value of the information there. This index represents the personal opinion of the author and is an arbitrary scale where 0 means ‘no certainty’ and 9 represents ‘maximum certainty’ for the value of the information presented.
Table 1.1
Internet Sources of Information
| Source | Organization | Value (Certainty)* |
| Peer-Refereed Journals | Society or Publisher | 5-9 |
| Gatorade Sport Science Institute | GSSI | 7-9 |
| Textbooks | Publishers | 6-9 |
| Wikipedia
Newspapers Specialty Magazines |
Wikimedia Foundation
News publishers Publishers/experts |
4-9
2-9 1-9 |
| Blogs | Individuals | 0-9 |
| Health | Medical Organizations | 5-8 |
| Facebook/Twitter | Individuals | 0-9 |
* Certainty, here, is a purely subjective assessment of the apparent quality of the information available from the designated source. When the number is low, the information may be biased, misleading or absolutely incorrect. When the number is high, the information is informative and correct. Note that for most sources, the range is from low to high quality.
Two very valuable sources of information on the internet are peer-refereed journals and the Gatorade Sport Science Institute. These are further described below.
Peer-Refereed Journal Articles
Research is the source of all knowledge in the field of exercise physiology, and that research is typically published in peer-refereed journals. Some of the more relevant journals for exercise physiology are listed in Table 1.2. Your library probably has a subscription to these journals, so the content will be free to you. Much of it is accessible on the internet
Table 1.2
Peer-Refereed Journals in Exercise Physiology
| Journal Name*
|
Publisher |
| Applied Physiology, Nutrition and Metabolism** | Canadian Science Publishing |
| Journal of Applied Physiology | American Physiological Society
|
| Medicine and Science in Sports and Exercise | American College of Sports Medicine |
| European Journal of Applied Physiology | Springer |
| European Journal of Sport Science | Taylor & Francis |
| Sports Medicine | Adis International Ltd |
| International Journal of Sports Medicine | Thieme |
| Scandinavian Journal of Medicine and Science in Sports | Wiley-Blackwell |
| Exercise and Sport Science Reviews | American College of Sports Medicine |
*Note: this is not an exclusive list. Other journals do publish excellent articles in exercise physiology. This list encompasses the most common journals for good articles in the field of exercise physiology.
**Applied Physiology, Nutrition and Metabolism is the official journal of the Canadian Society for Exercise Physiology.
The Peer-Referee Process
The journals listed in Table 1.2 all have a peer referee process. This means that when a scientist submits an article for publication, the Editor of the journal will either reject the paper without review, or assign the article to an Associate Editor, who sends that manuscript to (usually) two individuals with expertise on the topic to review the paper for quality of the research and accuracy of the information presented. Typically, the referees will submit a report, offering an opinion on whether or not the manuscript should be accepted for publication, and often this recommendation will include specific requests for revision. The Editor chooses whether or not to accept the article, or alternatively will reserve judgement and will delay that decision until suitable revisions have been made to address the concerns raised by the referee.
Many journals have rejection rates as high as 60%. This means that they accept for publication only 40% of the manuscripts submitted for publication, and this is only after 2-3 rounds of revision and assessment. The peer-referee process serves to enhance the quality of what is published, and hopefully prevent the publication of research that should not be published: poorly designed and unconvincing research. However, it accomplishes this with some delay in the publication. The peer referee process typically takes several months. Often there is further delay from the time an article is accepted until it is published. Many journals offset this extra delay by publishing articles on-line as soon as they are accepted for publication.
In spite of the peer referee process, errors and omissions or misrepresentations do persist in some of the articles that reach publication. Ultimately this is the fault of the authors, but referees must accept some of this blame. It is truly unfortunate, but the old adage: “don’t believe everything you read” still holds true in peer-refereed published work. In general, journals publishing within a field of study can be ranked from best to lowest quality. Scientists will attempt to publish their work in the best journal that will accept it. Although errors still exist in the research literature, it is still the most valuable source of information and knowledge. A concept or idea can only be fully understood when several papers demonstrate consistent data related to the concept. Ultimately, journal articles have provided the information for this textbook.
Conferences and Seminars
If you want to hear the latest research on a given topic, consider attending a conference or seminar. You might be surprised to hear how affordable this can be! The Canadian Society for Exercise Physiology (CSEP) hosts a conference each year, in some part of Canada. Check their web-site (CSEP.ca) for the location of the next meeting (see below). CSEP also hosts more casual regional meetings each year.
Your university or college might also have a series of seminars, usually on a weekly basis, presenting the most recent research that is happening on campus. These seminars are often presented by graduate students, and sometimes by local faculty members. Occasionally, the speakers may be national or international experts, and these experts may be local or invited from out of town. If regular events such as this are not occurring at your Institution, you can be a catalyst to try to make it happen, by talking with graduate students and faculty members about instituting a “journal club” or regular seminar series. A recent development is the online availability of seminars and conferences. Covid has resulted in a lot of “work from home” situations, and seminars and conferences have taken to using Zoom or other online platforms to broadcast the presentations.
Gatorade Sport Science Institute
I am sure you know what Gatorade® is. Yes, Gatorade® is a sports drink; the first of its kind. Gatorade® was scientifically formulated as a fluid replacement beverage to help the University of Florida Gators football team! A renal physiologist, Dr. Robert Cade, led a team of physicians in developing this beverage. The success of the football team became a resounding endorsement of the beverage. The rest, as they say, is history.
Gatorade® began with science, and in addition to its commercial success, the company that makes, markets, and sells Gatorade® maintains a strong connection to science; not only through their labs and sponsored research, but through the Gatorade Sport Science Institute (www.GSSIweb.com). It would be worthwhile for you to go to this web-site to see what they present there. They have an extensive library of sports and exercise physiology articles, written by experts in their field. Of course, there is a focus on hydration and exercise in the heat, but articles on athlete training and performance are also available, as are articles on injuries, health, and nutrition. Although Gatorade® is now owned by PepsiCo, the University of Florida receives millions of dollars each year from the profits of Gatorade® sales.
Importance of Critical Appraisal
Wherever you find your information, you need to evaluate it critically. The ability to evaluate critically involves familiarity with the topic, identifying differences of opinion, and trying to resolve why there is a difference. Sometimes the difference exists because the information was obtained in different studies with different methodology, and sometimes the difference represents a difference of opinion. Heaven forbid that one source might actually be wrong! This is a possibility, even for peer refereed journal articles. The peer referee process is the strongest way we have of assuring quality of published work, but mistakes are still made.
As you learn, you will formulate a paradigm of how you believe things (like exercise physiology) work. When you read something that does not fit your paradigm, you need to consider whether or not it is appropriate to shift your paradigm or refuse to believe the new information. Alternatively, you might want to consider the possibility that the new information is correct but may only apply in certain circumstances. This possibility addresses the issue of external validity that is further discussed below. Before we get to that topic, we will comment on a problem that needs to be avoided in your written work.
Plagiarism
When you present information, you have gathered from a source other than your own mind, without acknowledging where the information came from, it is called plagiarism. When you gather information from various sources to write an essay for a course, you are gathering information from others and it is appropriate to give credit to the source of information. This is true whether the information was published in print form or on the internet or broadcast by radio/TV or podcast. Even public broadcast, notes of fellow students and lecture material should be acknowledged as sources (though in the case of lectures, you need to be careful because the information could be considered hear-say). Giving credit to the source means presenting a reference stating where the information came from; usually the instructor for the course will provide you with guidelines for the format of such referencing. If you use the direct words of the source, this is a quote and it is necessary to use quotation marks. If you translate the message into your own words, you still need to acknowledge where the information came from. You should make it clear what information was obtained from the cited source and what are your own thoughts on the topic. There are often strict penalties for plagiarism, so be careful when borrowing information from others.
The Contents of this Textbook
This textbook is unique among exercise physiology textbooks. First of all, it is unique that it is Canadian. The Canadian content is present in several ways: the authors of the individual chapters are Canadian, Chapter 2 provides a summary of the history of exercise physiology in Canada. Canadians have contributed substantially to the global growth of knowledge in the field of exercise physiology, and will most certainly contribute further over the next decades. Other countries have also contributed substantially to the high rate of growth of knowledge in exercise physiology.
Another unique feature of this textbook is the use of a cast of fictional characters throughout the textbook to present the measurements relevant to exercise physiology. You will meet some of these characters in this chapter, but others will appear as you make your way through the textbook. There is a brief description of these characters in Appendix C where you can find out a little about them, including values for some of the basic measurements that exercise physiologists are concerned with. You will have to read the individual chapters to find out more details about these interesting fictional characters. Please note that any similarity between these characters and anyone you may know is simply coincidence.
One of the advantages of presenting fictional characters to describe the fundamentals of exercise physiology is that you will learn that there is considerable variation from the “normal”. Some of that variability relates to differences in size and body composition, but some relates to sedentary living or training effects related to the amount and intensity of physical activity regularly obtained. A third but substantial factor contributing to this variability, is genetics. Just to give an example of variability in exercise physiology, consider the measurement of maximal oxygen uptake (V̇O2max). V̇O2max is the highest rate at which the body can use oxygen for aerobic metabolism. V̇O2 is typically measured by quantifying the amount of oxygen breathed in over a period of time and the amount of oxygen breathed out in the same time. The difference (O2 in minus O2 out) is the oxygen uptake used for mitochondrial metabolism. If these measures are done while exercise intensity continuously increases to exhaustion, a peak value can be obtained. The term V̇O2peak is often used to describe the highest value for oxygen uptake reached in an incremental test. If exercise intensity increases but oxygen uptake does not, then you have achieved a plateau in oxygen uptake. This plateau indicates you have reached maximal oxygen uptake for that exercise. Values for maximal oxygen uptake can be as low as 10 ml•kg-1•min-1 or as high as 95 ml•kg-1•min-1. Note that the units here follow SI convention (Systeme Internationale). This format will be followed through-out the Online Textbook of Exercise Physiology. The dot at mid-height (•) indicates multiplication and the superscript (-1) indicates “raised to the power of”. When the power is negative, the units indicate divided by, so ml•kg-1•min-1 is similar to ml/kg/min.
For a given individual, maximal oxygen uptake will depend on the exercise used in the graded exercise test. Cycling will typically result in a lower maximal oxygen uptake than will running on a treadmill. This is thought to occur because of the difference in muscle mass used in the task. However, it is interesting that cyclists will achieve a higher maximal oxygen uptake while cycling than while running.
Note on Units for Oxygen Uptake
When the units for any measure are given relative to another measure, like per min or per kg, there are two ways these can be presented: 1) ml•kg-1•min-1 like above, or 2) ml/kg/min. This book will use the former convention. The dot between units signifies multiplication and the superscript -1 indicates the equivalent of the inverse (1 over x). If the superscript was -2, it would be the equivalent of 1 over x squared. You will notice that the units for oxygen uptake presented above are given per kg of body mass. This is conventional for exercise that is body weight dependent, like running or walking. When the exercise is not body mass dependent, like swimming or cycling, it is conventional to express oxygen uptake as litres•min-1.
It is important to recognize, in a quantitative way, how physiological capacities contribute to limitations in physical performance. It is also important to recognize that these capacities can be represented by a broad range of values, and that factors like: genetics, training, inactivity, and disease can influence many of these values. Body size, sex, and body composition can also influence some of these values. It is simply misleading to expect every normal person to have a maximal cardiac output of 25 litres•min-1, a value that is often given for a “normal” cardiac output during intense exercise. It is also more reasonable to express the maximum cardiac output relative to body size, similar to the idea that we have a blood volume that is the equivalent of about 8% of body mass. To extrapolate this to maximal cardiac output, it is reasonable to expect a healthy person to have a maximal cardiac output of about 4-6 blood volumes per min. This would equate to a blood flow from the heart of about 350 ml×kg-1×min-1. As you read through the chapters in this book, pay close attention to the units associated with values presented. It is not enough to know the number, you must also know the units associated with that number. A table of normal values is presented in Appendix A.
You will have noticed that “%” has been used in the above paragraph. Expression of many parameters of exercise physiology in % can be useful. However, it is important to keep in mind what the values representing 100% is. It is also relevant to identify whether the value presented is % change or % of a standard value. This seemingly small difference can be a huge difference in reality. Consider the example of a measure of change in V̇O2max over a period of inactivity. The change might have been a decrease in 10%. This would be a large change if the initial value was high, like 75 ml•kg-1•min-1, but small change if initial value was 20 ml×kg-1×min-1. It is also quite different to say the change was 10% or the change was to 10%.
Conventions in Exercise Physiology
As mentioned above, the language of exercise physiologists includes a lot of jargon and several conventions. One of the important conventions is the use of the dot over a letter to indicate rate. For example, Q is a blood volume (ml), and Q̇ is a rate of flow (ml×min-1). Similarly, VO2 is a volume of oxygen uptake (litres) and V̇O2 is a rate of oxygen uptake (litres×min-1). Another convention is that when the energy cost is proportional to body mass, as it is for weight-bearing exercise, the V̇O2 is expressed relative to body mass (ml×kg-1×min-1), but when the energy cost is independent of body mass, the V̇O2 is expressed as ml×min-1.
Now, the topics that will be covered in the remaining chapters of this textbook will be presented. Following this brief introduction to the chapter contents, some information on interpreting graphs and statistics will be presented. This information will help you understand the knowledge presented in the following chapters.
An Overview of the Contents of this Textbook
Chapter 2: History of Exercise Physiology in Canada
As indicated above, Canadians have contributed substantially to the growth of knowledge in exercise physiology. This contribution probably resulted primarily from the early establishment of doctoral programs in physical education at the University of Toronto and the University of Alberta. This pioneering spirit was also responsible for the establishment of the first two (in the world) programs in Kinesiology at Simon Fraser University and University of Waterloo. In Chapter 2 you will learn of some of the early scientists who helped establish exercise physiology as a strong Canadian discipline. Many of those identified in this chapter are still active in teaching and doing research today.
Chapter 3: Neural Control of Muscle Activation
Motor nerves control activation of our muscles. This can happen willingly, by motor pathways beginning in the brain and passing down the spinal column to the ventral horn where the cell bodies of the a motor neurons live, or involuntarily by spinal reflex. α motor neurons connect via the spinal nerve to individual muscles. Each muscle will have a collection of cell bodies in the ventral horn of the spinal cord and each of these cell bodies will have a single axon that branches multiple times to innervate a number of muscle cells. A single motor neuron and all the muscle fibres it innervates is called a motor unit. Any given motor unit can be activated by action potential generation and propagation, but in most cases, there is an orderly sequence of activation that relates closely to the fibre-type of the muscle fibres activated by a given motor neuron.
Chapter 4: Muscle Structure and Organization
I am sure you are aware of the amazing physical capabilities of your own skeletal muscles. What you might not realize is the intricate structural features of muscle tissue that allows this fantastic functional capability. Chapter 4 will present the structure of skeletal muscle, from the macro-organization to the submicroscopic level. Our muscles have an amazing repeating structure from whole muscle to sarcomeres. Connective tissue separates muscles from each other, surrounds bundles of muscle fibres, and envelopes each individual muscle cell (also called a fibre). Within each cell, long tubes called myofibrils contain the contractile proteins in repeating units called sarcomeres. All contractile properties can be explained at the sarcomere level, and sarcomeres along the length of the fibre will respond to activation in a similar manner. Recent advances have made substantial contributions to our understanding of how muscles are put together.
Chapter 5: Skeletal Muscle Contraction
The “Strong-Man” competitions that are often shown on television, illustrate a wide variety of ways that muscle can contract in extremely forceful ways. In contrast, muscle can also have tremendous endurance; repetitively contracting for hours through an ironman competition or ultra-marathon or simply during a shift at work in a physically demanding job. Remarkably, these same muscles can execute skilled micro-surgery, repairing structures in the body that we cannot even see without visual aids. The primary properties of muscle can be categorized as the following: force-length relationship, force-velocity relationship, force-frequency relationship, and force-calcium relationship. The broad range of functional capability of our muscles is presented in Chapter 5, where we will learn how muscles can be called upon through the day to perform routine tasks like climbing the stairs or carrying a laptop, in addition to the remarkable feats described above.
Chapter 6: Energy Supply for Muscle Contraction
In one of the “Back to the Future” movies, the time machine (modified DeLorean) is fueled by garbage. Our muscles can be fueled by junk food. However, I am sure you are aware that this should not be the case. In Chapter 6, you will learn how muscles transfer the chemical energy in the food we eat to a form that is readily available for the contractile functions described in the previous chapter. These processes have historically been divided into two systems: aerobic and non-aerobic. The aerobic system involves β-oxidation of fats, glycolysis of carbohydrates, as well as two paths common to both fat and carbohydrate metabolism called the citric acid cycle and oxidative phosphorylation. The non-aerobic system, also referred to as the anaerobic system, involves two sources of energy: 1) the high-energy phosphate compounds adenosine triphosphate and creatine phosphate and 2) glycolysis, leading to lactate formation.
Chapter 7: Pulmonary Function During Exercise: Gas Exchange Between Environment and Blood
One of the key functions of the circulatory system is to get oxygen to all of the cells of the body, and to remove carbon dioxide. We must breathe to remove the carbon dioxide from our blood, and to provide it with oxygen. The ventilatory system involves the lungs, ventilatory muscles, and airways. In Chapter 10, you will learn how this system is structured to optimize the transfer of gases from the atmosphere to the blood, and how in most cases this system is overbuilt; we have a capacity to breathe that most of us will never use.
Chapter 8: Circulatory Response: Delivering Substrates and Removing Metabolic Products
Single cell organisms do not need a circulatory system, but complex multicellular organisms, like mammals do. Our circulatory system serves to maintain the extracellular space around each cell in the body in a state that supports life for the cells in that vicinity. The circulatory system involves the heart, blood vessels, blood, and the lymphatic system. It is important to realize that the circulation is important not only for delivery of gases (oxygen and carbon dioxide) but also transportation of metabolic substrates, waste products, ions, amino acids, as well as hormones and cytokines. In order to keep the extracellular space around our muscle cells in a state that supports life, it is necessary to increase blood flow during exercise. This is achieved with a marvelous regulatory system that not only increases cardiac output by a factor of 2-8 fold, but also distributes most of this increase in cardiac output to the exercising muscles, while maintaining or even increasing the blood pressure. In Chapter 9 you will learn how this remarkable adjustment is achieved.
Chapter 9: Homeostasis and Disturbance of Homeostasis During Exercise
Exercise has the capacity to disturb the homeostatic condition that otherwise exists in the extracellular space, particularly that in the skeletal muscles. Each activation of a motor unit results in exchange of Na+ and K+ across muscle and nerve membranes, changing concentrations both inside and outside these cells. Blood composition changes during exercise: PO2 decreases in the venous blood while PCO2 increases and acidosis results from increase PCO2 and metabolic acid production. Note that the capital P here denotes partial pressure of the gas. Muscles begin using carbohydrates and fats at an increased rate, potentially decreasing their concentrations in plasma. Homeostatic regulation keeps the changes to the internal milieu to a minimum. These mechanisms of homeostatic regulation are presented in Chapter 9.
Chapter 10: Measuring Metabolic Responses and Capacities
The energy cost of performing a task can be quantified in a number of ways. Considering that aerobic metabolism can account for most tasks that we perform, the measurement of oxygen uptake is a reasonably easy, yet accurate way to quantify the energy cost of tasks that can be sustained at a reasonably low metabolic rate. In contrast with this, higher intensity tasks rely at least partly on non-aerobic metabolism, and this energy contribution is not as easily quantified. Muscle biopsy has been used to quantify the disappearance of high energy phosphate compounds: adenosine and creatine phosphate. A more expensive, but less invasive technique is to use magnetic resonance spectroscopy to monitor change in these non-aerobic sources of energy. Chapter 10 presents these measurement techniques, the value and limits of their use, and some values that illustrate how much or how fast this energy can be made available.
Chapter 11: Nutrition and Energy Balance in Active People
In spite of the reference to junk food above, a proper balance of nutritional foods is required for a healthy life. Chapter 11 provides the background to understand what is needed, what should be avoided and how these nutrients contribute to muscle metabolism, disease prevention, and athletic capabilities. The nutrients we require can be broadly classified as: fats, carbohydrates, proteins, water, minerals and vitamins. The frequency, type, and duration of exercise you engage in will affect how much of some of these you need on a daily basis.
Chapter 12: Body Composition: the Stuff we are Made of
The truth is that our bodies are composed of water, protein, fat, and minerals, but it is convenient to divide this collection of ions and molecules into two or three measurable components: fat mass and fat-free mass, with or without bone separated into its own category. Chapter 12 provides the information you need to understand the expected distribution between these compartments and how they relate to health and exercise. Measurement techniques including: hydrostatic weighing, bioelectric impedance, skinfolds, and dual energy X-ray absorptiometry (DEXA) are also addressed.
Chapter 13: Consequences of Repetitive Muscle Activation: Potentiation and Fatigue
When a muscle is repetitively activated, each activation can have an effect on subsequent contractile response. Initially, there is an effect that increases the Ca2+ sensitivity, resulting in stronger contractions per activating pulse when activation is submaximal. However, continued use of a muscle will result in fatigue; a decline in contractile response. Chapter 12 presents the circumstances surrounding these changes and the cellular mechanisms associated with these changes to the contractile response.
Chapter 14: Molecular Basis of Exercise Training: Adaptations in Skeletal Muscle
Gene expression dictates the actual sequence of amino acids that constitute a given protein. Over the past decade, tremendous advances have been made in understanding the complex signaling process that regulates which genes get expressed. In Chapter 14, these signaling pathways will be presented. Here, you will learn how packages of genes get turned on or off as a result of chronic training or inactivity. These signaling pathways typically involve extracellular cytokines, receptors, and intracellular response that include phosphorylation of enzymes and possibly altered ion movement.
Chapter 15: The Immune System Response to Acute and Chronic Exercise
Your immune system is incredibly important! Your body has several lines of defense against invading organisms, and exercise can increase your exposure to such invaders, but regular exercise promotes the defense mechanisms. In Chapter 15, you will learn about cell signaling mechanisms that trigger immune responses, the process of inflammation, and how exercise enhances your defenses against bacteria and viruses. You will also learn about polymorphonuclear lymphocytes and an array of cytokines.
Chapter 16: Determinants of Success in Athletic Performance
Chapter 16 guides you through a 10 km time-trial for a highly gifted athlete, Jake. To achieve international performance in the 10 km run, Jake must: have a high maximal oxygen uptake, be able to maintain a steady-state at a high fraction of his maximal oxygen uptake, and he must have a relatively low energy cost of running. An estimation of his physiological responses will be provided while he performs this feat, at a pace that approaches world record time. The pace that he holds for much of the time-trial is sufficient to just exceed his anaerobic threshold, so his blood lactate continues to climb slowly throughout the effort. His oxygen uptake also increases throughout the trial. This increase relates to what is called the slow component of oxygen uptake. Chapter 16 gives you a glimpse of phenomenal physiology at work.
Chapter 17: The Child: Responses and Adaptations to Physical Activity and Training
Although the physiology of a child works much like that of an adult, there are some special considerations that are deserved here, and are presented in Chapter 17. For example, children use the same heat dissipating mechanisms as adults, but the different surface area to body mass ratio affects the relative contribution of the different factors. It is also important to realize that physical activity patterns adopted during childhood are likely to persist through adulthood. Childhood is an important time to establish the habit of obtaining regular exercise.
Chapter 18: Aging and Exercise: Capabilities and Consequences
As we age, our physical capabilities deteriorate. Chapter 18 looks at the specific changes that occur during the aging process and identifies which are preventable with appropriate training practices. Many of the changes we associate with aging can be attributed to declining participation in high intensity exercise. More research is needed to further investigate these phenomena.
Chapter 19: What Are the Physiological and Health Benefits of Regular Physical Activity?
It has been known for decades, if not centuries, that regular exercise is an important lifestyle feature that is essential for optimal health. Several chronic diseases have “inactivity” or sedentary living as a major risk factor. This includes cardiovascular disease, diabetes, osteoporosis, and several kinds of cancer. The next big challenge of the health care systems will be to promote an active lifestyle and ensure that the majority of individuals are adopting an appropriate pattern of physical activity to minimize their risk for such conditions. Chapter 19 provides the evidence for regular physical activity as a strong measure for disease prevention.
Chapter 20: High Altitude Physiology: Climbing Earth’s Highest Peak
Our atmosphere contains nearly 21% oxygen. This is true whether you are in Vancouver at sea level, or on top of Canada’s highest mountain (Mount Logan at 5959 m). However, the barometric pressure changes, so the PO2 is greatly reduced at higher altitudes. Partial pressure difference is the primary factor that determines the rate of transfer of a gas by diffusion. This low partial pressure at high altitude can limit the arterial oxygen content and reduce your exercise capability. Chapter 20 reviews the impact of altitude on exercise capability and presents some ways that you can minimize this impact.
Additional Chapters Planned
Anaerobic Threshold and the Various Measures Estimating this Intensity of Exercise
Mild exercise is easy to persist at for hours. However, as the intensity of exercise increases, the duration that you can persist decreases. There are a variety of reasons for this relationship between intensity and duration of exercise. The anaerobic threshold is an important intensity that marks the boundary between exercise that can be sustained with entirely aerobic metabolism and exercise that requires persistent anaerobic metabolism. Above the anaerobic threshold, lactate will accumulate in the muscles and/or blood.
The Exercise Challenge for Astronauts
The human body has evolved in an environment that includes substantial gravity. Travel to space places this body, which has the capacity to adapt quickly to new physical demands (or lack thereof), in a situation where effort is minimized. The consequences of zero or no gravity and this minimized daily effort while in space has an impact on: muscles, bones, the cardiovascular system, and the nervous system. In this Chapter, the physiological consequences of space travel are presented, and various countermeasures and their effectiveness are reviewed.
Sex and Gender Issues in Exercise Physiology
Much of what we know about exercise physiology applies only to males. Females have not been studied nearly as extensively as males and may differ from males in their response to exercise. These differences may relate to hormonal differences or differences in body composition. Some of the key differences and similarities of response to exercise for males and females are presented in this chapter. There is an urgent need for the study of the physiological response of females to exercise.
Ergogenic Aids: Perceived and Real, Legal and Illegal
An ergogenic aid is an item, a substance, or a procedure that enhances physical performance. There are many examples to illustrate this concept: training, water, power gels, erythropoietin, blood doping, caffeine, and anabolic steroids, to name but a few. This chapter will identify several ergogenic aids and elaborate on a few of them, providing research evidence for or against their effectiveness and describing the understood mechanism of action.
Tools of the Exercise Physiologist
Researchers in exercise physiology have played an important role in identifying the relationship between sedentary living and chronic disease, and they will now play an important role in guiding the adoption of the appropriate intensity and frequency of exercise. A list of tools and the units of measurements obtained is presented in Table 1.3.
Table 1.3
Examples of Tools and Measurements in Exercise Physiology
| Instrument | Variable measured | Common Units |
| Metabolic Cart | Oxygen uptake | litres×min-1 or ml×min-1×kg-1 |
| Dynamometer | Moment about a joint | newton-meters |
| Respirometer | Ventilation | litres, ratios, litres×min-1 |
| Electrocardiogram | Electrical currents of the heart | millivolts, time parameters in milliseconds, heart rate in beats×min-1 |
| Heart rate monitor | Heart rate | beats×min-1 |
| Dual X-ray Absorptiometer | Body density | algorhythm calculates % fat and expression of bone density |
| Hydrostatic balance | Body density: % fat and fat-free mass | % and kg |
| Skinfold calipers | Skinfold thickness | mm |
| Bioelectric impedance | Relative water content | % fat |
| Pulse Oximeter | Oxygen saturation | % saturation |
| Magnetic resonance spectrometer | Chemical concentrations; typically phosphocreatine, ATP and inorganic phosphate | % change and ratios |
| Near-infrared spectroscopy | Oxyhaemoglobin and deoxyhaemoglobin | % saturation |
| Ultrasound imaging | Muscle or cardiac structure | mm and ratios |
| Magnetic resonance imaging | Tissue density | internal image |
| Microchip | Presence of messenger RNA | yes/no |
| Muscle biopsy | Muscle structure, biochemical content | Variety |
At this time, it is desirable to discuss some of the general ways that information is presented in a textbook of Exercise Physiology.
Key Skills for Learning Exercise Physiology
The topics covered in the study of exercise physiology are fascinating and intriguing. However, they can also be complex and confusing. There are some simple skills that you can master that will facilitate the learning of the content of this textbook, and these skills are described here. In addition to learning the new vocabulary referred to earlier in this chapter, there are two very important skills you can learn that will facilitate the comprehension of the topics presented in this textbook: understanding statistics and interpretation of graphs. Some valuable background on these topics is presented here.
Statistical Considerations
One of the important features of biology is the variability in the value for various measures that can be made. For example, we could weigh all members of a class and come up with a mean value. As exercise physiologists, we often use mean values to represent typical values that would be expected for a given measurement. It is important to realize that this value would not necessarily be expected for a given measurement of a single subject, but represents a value that is not too different from any one value.
However, when making any measurement, it is important to recognize how variable the measurements should be, so you can detect an error when it is made. It is just as important to recognize the units that are used for a given measurement. If you are recording measurements made by a classmate and he tells you that somebody’s height is 175 inches, would you faithfully write it down, or would you ask if that was supposed to be the height measured in cm?
Although it is beyond the scope of this textbook to provide lessons in statistics, it seems appropriate to review some fundamental concepts that will help the understanding of information presented throughout the textbook. Statistics can be described as a process to find the following:
· An equation to describe the relationship between two variables
· A measure of the strength of a relationship between two (or more) variables
· A description of the middle value and distribution of a measure of interest
· A measure of the confidence that two mean values are truly different
Descriptive statistics
Descriptive statistics are used to describe the quantity, distribution, and variability in a measure of interest. Probably the most common descriptive statistic used is the mean. The mean is a measure of central tendency, or an expression of the average value for a repeated measurement. Other measures of central tendency include the median and the mode. The median is the middle value if you rank all measurements from the lowest to the highest. There are just as many values above the median as there are below. However, the mean and the median can be different in value. The mode is, by definition, the most often represented value. For example, if the measurements of weight of your classmates resulted in 5 people with a weight of 65 kg, and no other weight had more people measured at that weight, then the mode would be 65 kg. Each of these measures of central tendency has advantages and disadvantages.
In all cases of measures of central tendency, it is informative to have a measure of dispersion. A measure of dispersion will inform the reader how close to the measure of central tendency most of the measurements were. variance, standard deviation, and standard error of the mean are examples of measures of dispersion. It is useful to recognize that when a given measurement is distributed normally (see Figure 1-3a) then 96% of the measurements will fall within 2 standard deviations of the mean value. Fortunately, (for statistical evaluation) many biological measures are distributed normally. However, there are some measures that have values that are skewed, so that more measurements occur near one of the extremes, rather than near the middle value. A skewed distribution is shown in Figure 1-3b. In this case, the mean and the median will be quite different, whereas with a normal distribution the mean and the median are the same.
Normal distribution
Many biological measures yield a normal distribution or bell-shaped frequency distribution curve. A frequency distribution curve is a plot of how many measurements at each value (or range of values). In Figure 1-3a, the black line represents the mean and the green lines are 1 standard deviation from the mean. The red lines are 2 standard deviations from the mean. There are more values close to the mean and fewer in a given range as you move away from the mean.


Inferential Statistics
Quite often, the purpose of a given research study is to determine if there is a difference between conditions or treatments. For example, it may be of interest to know if one type of warm-up is better than another. In this case, a researcher might have a group of athletes perform a competitive event like a 60 m sprint, with each of two warm-ups. Ideally, the two warm-ups are performed in random order, and data for each test are obtained on separate days. The dependent variable of interest is the performance (measured in seconds) after each warm-up.
Consider that this research has been done, and the results presented in Table 1.4 were found. The question now is: was performance different between these two trials? The inferential statistical test that is appropriate for this determination is the paired t-test. This test will tell us if the difference from one to the other of these trials is significant. Sometimes a difference between the means of two measures occurs simply due to chance. When we say the difference is significant, we are saying that we have confidence that the difference is not simply due to chance. More specifically we are saying that 95 times out of 100 trials we would likely see this difference. Factors that would make it difficult to detect a significant difference include the following:
· There is too much variability in the measure of interest
· The real difference is too small to detect, or does not exist
· The number of subjects was too few to allow detection of a significant difference
Table 1.4
Time for 60 m Run After Warm-up A (WU A) and Warm-up B (WU B)
| Subject | Time for 60 m (s)-WU A | Time for 60 m (s)-WU B | Fat free mass (kg) | Age of the participant |
| 1 | 9.81 | 9.75 | 44 | 8 |
| 2 | 8.47 | 8.49 | 53 | 12 |
| 3 | 9.05 | 9.00 | 51 | 10 |
| 4 | 9.75 | 9.78 | 48 | 9 |
| 5 | 8.43 | 8.55 | 58 | 11 |
| 6 | 9.25 | 9.10 | 60 | 14 |
| 7 | 8.75 | 8.62 | 56 | 13 |
| 8 | 8.68 | 8.69 | 57 | 12 |
| 9 | 8.42 | 8.40 | 62 | 14 |
| 10 | 7.85 | 7.85 | 58 | 15 |
| Mean | 8.85 | 8.82 | 54.7 | 11.8 |
| SD | 0.62 | 0.60 | 5.64 | 2.3 |
The results of a paired t-test on the data presented in Table 1.5 are shown in the following table:
Table 1.5
Statistical Results for Comparison Between Warm-ups
| Parameter | Trial Warm-up A | Trial Warm-up B |
| Mean | 8.85 s | 8.82 s |
| Variance | 0.39 | 0.36 |
| N | 10 | 10 |
| Correlation | 0.992 | |
| T-statistic | 0.919 | |
| Critical T (0.05) | 2.26 | |
| Probability significant (p) | 0.3822 |
The interpretation of these results would be that warm-up B is no better than warm-up A in preparing these athletes for a 60 m run. This interpretation is based on the observation that the T-statistic is not greater than the critical T. The value p represents the probability that you would make a type I error or be incorrect in declaring these means different. In general, we hope to keep type I error less than 5% (a<0.05), so when p>0.05, the conclusion is that the means are not different. A type II error occurs when you conclude that the conditions are not different when in fact they are. We are more willing to make a type II error than a type I error in most statistical comparisons. Keeping type I error (a) small means that type II error has a higher probability. The correlation indicates that these two measures shown in Figure 1-4 are highly related. When one is high, the other is also high; when one is low the other is also low. We use the letter “r” to represent correlation. The correlation can range from values = -1 to +1. Values close to zero indicate no relationship between the measures. When the correlation is negative, the slope of the relationship is also negative. This means that when one variable increases, the other one decreases.
External validity would restrict interpretation to this event, and for subjects of this description. This conclusion would not necessarily apply to warm-up for high jumping or shot put, and it may not apply to elite athletes or to adults. One important factor that limits the ability to find a significant difference in trials of this nature is variability. If the variability in the result of the time-trial is large even when circumstances prior to the event are similar, then warm-up procedures that might have a small effect may not be detectable by statistical analysis.
Recently, many sport scientists have developed and subsequently used a different statistical approach to make inferences about potential differences between trials in the case where traditional inferential statistics deemed these differences not significant. This approach is called magnitude-based inferences (MBI). Consider the case above: while not statistically significant, is it possible that the mean difference in 60 m time as a result of warm-up A and warm-up B is clinically significant or meaningful? Is the observed difference between warm-up A and warm-up B of 0.03 s meaningful? We could calculate the size of the effect, using a magnitude-based inference approach. The benefit of using this approach in exercise physiology is that, in many cases, we simply do not have a large enough sample size and/or the real effect is very small. Consider an athlete who wins an Olympic 100 m race by <0.03 s as a result of using warm-up B compared to warm-up A. While not statistically significant, statistical approaches like MBI or effect sizes allows the coach/athlete/sport scientist to make their own judgment along a continuum of a trial’s effectiveness based on the observed effect shown, rather than perhaps rejecting the use of warm-up B because it is not statistically significant.
Shapes of Relationships: Linear, Exponential, Quadratic, Sigmoid
Exercise Physiologists often use graphs to convey important information. Graphs are simply a pictorial way of conveying data that illustrate some concept. It is important to carefully look at the graphs in this textbook, to obtain as much information as possible from them. Most of the graphs in this textbook will be two-dimensional, but graphs can be three-dimensional. A two-dimensional graph plots the independent variable on the abscissa (also known as the x axis) and the dependent variable on the ordinate (also known as the y axis).
Graphs can convey information as simple as a frequency distribution or as complex as the relationship between load and mechanical work. Here, we will present a few graphs to illustrate some of the different concepts that are conveniently presented as graphs and show how these graphs should be interpreted. This information will help you interpret the graphs presented throughout the textbook.
Before I describe the typical relationships that are frequently depicted in graphs, it is worth considering a simple convention that makes interpretation of graphs more apparent. It is important to understand that variables can usually be considered either independent or dependent. The easiest way to think of these is that the independent variable is controlled by the experimenter and the dependent variable is measured at different levels of the independent variable. It is convention to plot the independent variable on the abscissa (x axis) and the dependent variable on the ordinate (y axis).
Linear Relationships
The linear relationship is the simplest and probably the most common relationship that can be demonstrated in a graph. Figure 1-4 illustrates a simple experiment, where heart rate (dependent variable) was measured while power output (independent variable) increased during an incremental test on the cycle ergometer. An equation can be used to describe the observed relationship between power and heart rate. This equation is shown in the graph, and has four important components, similar to the standard equation for a line (equation 1.1).
Equation 1.1
y = m × x + b
where y is the value on the ordinate, that corresponds to a value x on the abscissa, m is the slope or proportionality constant, and b is the intercept or offset.
The value of the information made available by the calculation of r is more obvious in Figure 1-5a. Here, the data do not fit as well to the line, and correlation ( r) = 0.5. In this case, there is still a significant correlation between the two variables, but the strength of the relationship is less than in Figure 1-5b. If the r was between -0.1 and 0.1, the presence of a line representing the data would be difficult to visualize. Another way of using the correlation coefficient is to take the square of the value (r2), which provides an estimate of the variability in the dependent variable that appears to be accounted for by variability in the independent variable. Thus, in our example for r = 0.5, calculating r2 (0.5 × 0.5) would equal 0.25, or only 25% of the variability in Y is explained by variability in X. This means that 75% of the variability of Y is unrelated to variability in X. This means that X is not a good predictor of Y, and vice versa.

Linear regression and Curve-fitting
Curve-fitting is a statistical procedure that is useful in finding an equation that describes the relationship between two variables. Consider the data presented in Figure 1-4. The first decision to make is to determine the shape of the relationship: is it linear, exponential or sigmoidal? These terms represent different shapes of relationships, and graphs presenting these shapes are shown later in this chapter. Clearly in this case, the data are linear. It might be argued that the exception to this linearity occurs at the resting heart rate and at the highest power output.
Linear regression uses a common equation for a straight line (y = mx + b; where y is the value on the ordinate and x is the value on the abscissa; m is the slope; rise over run of the relationship and b is the intercept or value of y when x = 0). This equation will find the values for the constants (m and b) representing a straight line that passes through the data with the least deviation between the line and the data. This approach is referred to as the least squares method. This approach finds the values for the constants that yield the lowest value for the sum of squares of the differences between predicted and actual values for the dependent variable. The iterative process finds the line that passes through the data with the smallest sum of squares of the differences between the data and the line. This is called the line of best fit.
The result of the linear regression of heart rate vs power output is presented in Figure 1-4. Here, linear regression was done without including the lowest (resting) and the highest (peak power) heart rates. The line fits the data quite well. Clearly the lowest and the highest heart rate have more deviation from the line than the values that were included in the regression. The closeness of fit of the line to the data can be quantified by calculating the correlation coefficient (r). The value of r can vary from -1 to plus 1.
When r is near zero, then there is little or no relationship between the variables. In these circumstances, it would be difficult to choose an appropriate line through the data. As the value for r approaches 1 or -1, the strength of the relationship improves, meaning the data appear to be arranged in a more linear fashion. The relevance of the negative sign is that when the values of the two variables change in the opposite direction (one increasing as the other decreases), the correlation will be negative. Note also that in this case, the slope of the relationship will be negative. When the two variables change in the same direction, one increases when the other increases, then the correlation is positive and so is the slope of the relationship. Further examples of curve-fitting are given later in this chapter, in the section dealing with graphical presentation of data.
Several software programs allow you to find appropriate constants for an equation you have entered. Even Microsoft Excel will permit curve-fitting to pre-selected equations including: linear, exponential, and polynomial
Note, resting heart rate and heart rate at highest power achieved were not included in the regression. The line represents the best fit across values for heart rate from the first exercise intensity (50 watts) to the penultimate exercise intensity (300 watts). This graph shows that the increase in heart rate is constant for any increase in power output. It is important to realize that each individual could be a little different, but in general a fairly good linear relationship is obtained when these two variables are plotted. However, the power output at which maximal heart rate is reached will vary considerably. Can you plot a similar graph for someone with pulmonary disease?
Curve-fitting is a valuable method to find the nature and the strength of the relationship between two variables. You will notice in Figures 1-5a and 1-5b that although the data follow the general trend of the lines, there is a random disparity between individual values for the dependent variable and the estimate of the value given by the equation for the line. It is important to realize that the equation representing the best fit through the data is typically obtained by finding values for the constants that minimize the disparity between the actual values and the values predicted by the equation. The process of finding appropriate values for the constants is called the least squares method.
Interpretation of Linear Relationships
A graph such as that shown in Figure 1-4 illustrates a relationship. It shows that the value of heart rate is proportional to the power output, and the proportionality constant or slope of the relationship is 0.4036. This tells you that for each unitary increase in value on the abscissa, the value on the ordinate increases by 0.4036. There appears to be an offset in the relationship such that at zero power output, the heart rate would be 74.3. This is the intercept of the relationship, obtained by least squares fitting an equation for a straight line to the data.
The fact that two variables change in a proportional way and are described by a linear relationship should be interpreted to indicate that the two values are related; this may be, but is not necessarily a cause and effect relationship. In the case of the power–heart rate relationship, it is clear that cycling at a given power output necessitates a given heart rate, so there is a cause and effect relationship. However, this could just as easily be interpreted as an indirect relationship. Cycling at a given power output requires a certain oxygen uptake by the active muscles. This oxygen is delivered by the cardiac output. The increased cardiac output requires an increased heart rate. In other words, the relationship between heart rate and power exists because these variables are related through a third variable, oxygen uptake.
Although linear relationships are quite common in exercise physiology, a straight line does not always fit well in describing the relationship between two variables. Two additional graphic presentations that are relevant in exercise physiology are described below: exponential relationships and sigmoidal relationship.

Linear relationship between fat-free body mass and time to complete a 60 m dash. As fat-free body mass increases, time to complete the 60 m decreases. This result would seem counterintuitive, but the reason becomes clear once you consider the way the results are presented in this Figure. Participants of this study ranged in age from 8 to 15.

Exponential Relationships
When the value of a variable changes in proportion to its current value, an exponential relationship exists. In this case, the slope is continuously changing. The standard exponential relationship is the decay curve for radioactivity. In this case, the rate of emitting radioactivity is dependent only on the amount of radioactive material left. When the amount of radioactive material has decreased, the slope or rate of emission of radioactivity will decline more slowly. A key feature of an exponential relationship is that a single determinant is the underlying cause of the changing slope of the relationship.
Relaxation from a muscle contraction is considered to be exponential. An example of a muscle contraction is shown in Figure 1-6a. It can be seen that once relaxation is well underway, the high initial value for force is associated with a steep rate of decline and as the force decreases, the slope or rate of force decline, decreases as well. This graph shows the whole contraction, but only the relaxation is considered exponential. In reality, only late relaxation (shown in Figure 1-6b) should be considered exponential.
One of the unique features of an exponential decline or exponential rise to a plateau is the notion of a half-time. The time for the value on the ordinate to change to half of any value is constant, if the property is truly exponential. In Figure 1-6a, the half-time is 18.5 ms. Pick any point on the decline of force, and note that exactly 18.5 ms later, the value is half of that initial value.


A time-constant can also be associated with exponential change. The Greek symbol τ is usually used to denote time-constant. To illustrate τ, we have plotted an increasing exponential relationship in Figure 1-7. Here, oxygen uptake rises quickly at first, then more slowly. This curve represents the change in oxygen uptake from the beginning of exercise at a moderate intensity for a relatively trained individual. The slope of the relationship decreases as the value approaches a steady-state (ss). A ss is a constant level of any variable measured in the body (oxygen uptake, temperature, concentration of an ion, etc.). By definition, the time-constant is the time for the value of a variable to change to (1-1×e-1) where e is the natural log. This approximates 63.2%, so the time-constant is the time needed for a change of 63.2%. The following equation can be used to represent the relationship between oxygen uptake and time, as oxygen uptake increases from the resting level to the ss.
O2t = O2r + O2ss × (1- e-t/τ) Equation 1.2
Where O2t is rate of oxygen uptake at time t; V ̇O2ss is the increase from resting to ss rate of oxygen uptake, and τ is the time-constant. Note that as t increases, the ratio of t×τ-1 increases. This ratio is a negative exponent, so as it increases in value, the expression (1- e-t/τ ) approaches one. Therefore, oxygen uptake approaches the sum of resting and ss difference. In this example, O2 reaches a ss by about 2 min. You will learn in Chapter 13 that τ changes (becomes shorter) with training. A well-trained individual will reach ss in 1 min or less. It is important to realize that it takes approximately 4 × τ to approach the ss. You will also learn that the exponential rise in oxygen uptake measured across the lungs does not begin at the instant that exercise begins. There is a delay due to the time required for venous blood exiting the muscles to get to the lungs.

As exercise begins, oxygen uptake increases at a rate that decreases exponentially, reaching a level that is considered ss. In this example, the time-constant is 0.3 min.
Sigmoidal Relationship
There are several important relationships in exercise physiology that are sigmoidal in shape. That is, at low values of the independent variable, the dependent variable changes very little. However, as the value of the independent variable increases, the rate of change of the dependent variable increases dramatically. Eventually at higher values for the independent variable, the dependent variable reaches a plateau where further increases in magnitude of the independent variable result in no change to the dependent variable.
An example of a sigmoidal relationship is the binding of oxygen to haemoglobin (Hb), shown in Figure 1.8. Here, it can be seen that at low partial PO2, there is virtually no O2 bound to Hb. As partial pressure increases, there is little change, until partial pressure exceeds x, then the curve becomes increasingly more steep with increasing saturation of Hb with oxygen. However, there is a maximum amount of O2 that can bind to Hb, so the rate of increase slows and a plateau occurs, where further increases in PO2 result in no further increase in oxygen saturation. You will learn more about this relationship in Chapter 9.

Normal Values for Physiological Measurements
Throughout this textbook, you will be presented with values for a variety of measurements that can be made on human subjects during exercise. Often these will be compared with resting values, or values at different intensities of exercise. It is useful to pay attention to these values, so you can recognize whether or not any measurements you might be making are yielding normal or abnormal results. For example, if you are measuring someone’s heart rate at rest, and you find that the rate is 95 beats·min-1, you might wonder why their heart rate is so high. Furthermore, it is useful when considering some of the factors that limit human physical performance capabilities to use a quantitative approach. Often, the difference between elite athletes and the rest of us can be expressed by the values of their physiological measurements. Pay close attention to the units of the measurements!
When considering normal values for physiological measurements, it is convenient to qualify the physical exercise in a relative sense (see Appendix A for a table of normal values). To do this, we use the terms: mild, moderate, vigorous and supramaximal intensities. These terms are defined with respect to the intensity at maximal oxygen uptake, the highest rate at which oxygen can be taken into the body and used for aerobic metabolism. Although we use the descriptor “maximal” to refer to exercise at maximal oxygen uptake, it is possible to exercise at intensities above this. When intensity of exercise exceeds maximal oxygen uptake, it is referred to as supramaximal exercise.
The choice of normalizing values (maximal O2 in this case) is somewhat arbitrary. It has recently been suggested that a more appropriate normalizing factor is the intensity associated with anaerobic threshold (Fletcher & MacIntosh, 2018, Svedahl & MacIntosh, 2003) . This approach takes into consideration that anaerobic threshold, which is a valuable indicator of the relative difficulty of exercise, occurs at a different % of maximal O2 in trained and untrained individuals.
Why Study Exercise Physiology?
The study of exercise physiology provides an understanding of the changes that occur in the body during exercise. This includes movement associated with simple tasks like opening a jar, walking, or climbing stairs to complex elite physical performance like participating in a hockey game or running a marathon. These changes in the body can be divided into acute (occurring at the time of the exercise and in the immediate recovery period), or chronic (occurring as a consequence of repeated engagement in the physical activity over a period of days, weeks or years).
Understanding Athletic Performance
Much of what we know about the factors that limit ultimate physical performance has to do with exercise physiology. This is true whether you consider the limits of performance in sprinting events like the match sprint in track cycling or endurance events, like the marathon. “Determinants of Success” is a chapter that provides a description of the physiological capabilities of Jake, a successful 10 km runner (Chapter 16). Much of his success in athletics can be attributed to remarkable physiological capacities. In contrast, Len, who is a successful sprinter, has much less impressive aerobic and cardiovascular capacities, but has remarkable muscle properties that contribute to his success.
Although genetics is known to contribute considerably to the tremendous physiological capabilities of athletes, training is also important. The adaptations to regular exercise that we call training represent important aspects of exercise physiology.
Understanding the Human Body During Exercise
It obviously is not enough to understand the need for exercise and the physiological properties of elite athletes. It is just as important to understand the adjustments needed in the average individual as they undertake a moderate or vigorous bout of exercise. These adjustments to exercise become important cell signaling processes (see Chapter 14) that stimulate the adaptive adjustments to exercise that contribute to performance enhancements due to training and to health benefits of regular physical activity.
Understanding Limitations Due to Disease
Various diseases will impose limitations on the exercise capabilities. These limitations are rarely restricted only to the realm of the disease but have wide-ranging implications for the physiological measurements we can make. For example, those suffering primary pulmonary disease have serious muscle atrophy that results in decreased strength and impaired endurance. These changes are thought to relate to a detraining effect of the lack of regular exercise, and much research is now being conducted to see if the inability of the pulmonary patients is more dependent on their muscle atrophy or is a direct consequence of the pulmonary disease. Any disease or condition that restricts mobility will ultimately lead to an impaired cardiovascular system. The old adage; “use it or lose it” comes to mind. Challenging the cardiovascular system with regular exercise leads to adaptations that improve cardiopulmonary performance. Inactivity or lack of exercise, whether volitional or imposed by disease, leads to the reverse; impaired cardiopulmonary performance.
Understanding Adaptations to Regular Exercise/Training
You might have come to realize that the second time you perform a strenuous exercise, it is easier than it was the first time. This is not just your imagination! Our body undergoes adaptations that are intended to resist disturbance to homeostasis when exposed to a stress. Exercise is a stress, and the body responds to exercise by adapting; changing protein content and structure to prepare the body for subsequent challenges.
The repeated performance of a given type of activity will result in adaptations that we call training. Some of the general adaptations that occur with regular exercise include the following: heart rate is lower for a given metabolic rate, stroke volume is greater for a given metabolic rate, temperature increase during exercise is less and sweating is more, fats are mobilized for metabolic substrates more easily, and the adrenergic response to exercise is blunted. Muscle fatigue is delayed as a result of the increased metabolic capacities that result from some kinds of training.
Measurement Considerations
In research and in clinical assessment, it is necessary to make measurements. This could be as simple as measuring heart rate, skinfold thickness, blood pressure, or muscle force generation. The tools and instruments available for measurement in exercise physiology are quite varied and yield a wide variety of precision and reproducibility.
Whenever measurements are made, there are sources of error and, in some cases, uncertainty with respect to meaning of the value obtained. Error can occur in some measurements, even as simple as measuring height, if inconsistencies occur in the way the measurement is made. For example, consider the possibility that you have measured the height of our character, Arthur (see Appendix C) on three consecutive days. You obtain measures of 181.2, 180.7, and 181.9 cm. How can measures of height vary so much? If you go back to the video recording of your measurements, you might discover that Arthur wore his shoes during the measurements, and he had a different pair of shoes on each day. That could have contributed to the variability! If you want accurate, consistent measurements, you must be consistent in the way you make the measurements.
When we use electronic devices to obtain measurements, how do we know that the number provided by the machine is correct? quite often, now, electronics provide the measurements that in the past were obtained mechanically. For example, if you are using an electronic cycle ergometer in the local fitness centre, how do you know that the power output it gives is correct? It is important to calibrate this equipment, to be sure that the correct value is obtained.
Concepts of Validity and Reliability
The concepts of validity and reliability are tremendously important. Reliability has to do with the reproducibility of a measure and validity has to do with the meaning and correctness of a measure; does the equipment measure what it is thought to measure? Validity also has a second, closely related meaning; does the result of your experiment apply beyond the group that served as your subjects? This is called external validity. External validity is often compromised by the nature in which the participants for a study are selected. Most studies of exercise physiology do not randomly select participants from the pool of potential participants described by the exclusion criteria for the study.
Reliability is assessed by demonstrating that repeated measurements of the same thing will yield the same result. For example, if you measure the height of Julia (another one of our characters often mentioned in this textbook) on consecutive days and get: 187.9, 188.0, and 187.9 cm. These measurements are very close, so you would have some confidence that you knew her height. However, in spite of the reproducibility of these measures, you do not know yet if they are valid. Reproducibility alone does not make a measurement correct! How could you be sure your measurements were accurate?
Limitations of the Research to Date
The development of knowledge in exercise physiology has come a long way in the past 50 years. Research continues, and it will still be a long time before a full understanding of the acute and chronic physiological responses to exercise are fully understood. For this reason, the information presented in this textbook is incomplete. You may have questions after you read a given section of this book. Your questions are important, and you should consider following up on them by looking up additional information. However, don’t be too disappointed if you can’t find the answer. It could be that we just don’t know yet!
There may also be disagreements between what you read in this textbook and what you read elsewhere. This is because exercise physiologists do not all agree on a given idea, theory, or concept. Hopefully in the more controversial areas, this textbook will also provide you with the alternative view, but that may not always be the case. It is also possible that some long-held interpretation of information has recently changed, and a new paradigm has evolved. As you read this textbook, keep in mind that new research could change the way exercise physiologists view how the body functions during exercise. At this time, consider an example of how ideas can change. In this example, the history of the development of theories of muscle fatigue will be considered.
Acidosis and Muscle Fatigue
Everybody understands that when they exercise, or repetitively contract their muscles, there will eventually be a decrease in the ability to perform that task. The capability of their muscles to contract decreases. I am sure you have all experienced this. We call this decrease in contractile performance, muscle fatigue. For about 100 years, it was strongly believed that intracellular acidosis was a primary cause of muscle fatigue. Recent research has suggested that this may not be true.
Consider the evidence for the persistence of the strong belief that acidosis was the cause of muscle fatigue. It probably began with an early (1807) report of the presence of lactic acid in the muscles of a stag that had been chased to the point of exhaustion before it was shot (Needham, 1971). It is not clear why a sample of muscle was evaluated for lactic acid, but the presence of a high concentration of lactic acid was associated with the coincidental existence of exhaustion. Is this cause and effect, or simply a case of two events happening at the same time?
Much later, an experimental approach was followed, and the casual observation of a correlation between fatigue and lactic acid was confirmed. AV Hill, a well-known muscle physiologist, supported the notion that fatigue in frog muscle was associated with acidosis (Hill, Long, & Lupton). However, it was not until years later that a mechanism for this assumed relationship was found. It was discovered that in muscle fibres with the membrane removed (skinned fibres), acidosis decreased Ca2+ sensitivity (Fabiato & Fabiato, 1978). This means that less force was observed at a given [Ca2+]. You will learn in Chapter 5 that intracellular release of Ca2+ triggers muscle contraction, and that the force of contraction is dependent on [Ca2+]. This observation that Ca2+ sensitivity was decreased provided a mechanism for the assumed effect of acidosis in causing muscle fatigue. However, it is important to consider the circumstances and the concept of external validity. Does the fact that acidosis impairs Ca2+ sensitivity in skinned frog muscle fibres at 8°C (the temperature used by Fabiato and Fabiato) mean it will also decrease Ca2+ sensitivity at body temperature of mammalian muscle?
In spite of occasional experiments that indicated a lack of effect of acidosis on contractile response at normal mammalian temperatures (MacIntosh, 1979; Pannier, Weyne, & Leusen, 1970), the notion that acidosis caused muscle fatigue was generally accepted (Fitts, 1994). Then in 1995, a paper was published that shed light on the external validity of the 1978 paper. Pate and colleagues (Pate, Bhimani, Franks-Skiba, & Cooke, 1995 ) demonstrated that Ca2+ sensitivity was not decreased by acidosis in skinned fibres when the muscle temperature approached physiological temperature. Later, Westerblad showed that acidosis does not affect contraction of intact mammalian muscle fibres when tested at physiological temperature (1997).
It seems that researchers have made an about-face on this topic, and it is now proposed that acidosis actually helps to preserve muscle function during exhausting exercise. It has been demonstrated that acidosis delays the attenuation of contractile response that would otherwise occur when plasma [K+] increases during exercise (Pedersen, Nielsen, Lamb, & Stephenson, 2004). It is important to keep in mind that under some circumstances, acidosis can have a negative impact on muscle, and some experts believe pH interacts with inorganic phosphate to still impair muscle contraction at physiological temperature (Nelson & Fitts, 2014). It is with interest that we should watch the research on this topic over the next several years.

Value and Limitations of Animal Research
It might be noticed by the astute student that much of the research described above was done with animals. I am not sure where we would be with respect to knowledge in exercise and muscle physiology without the huge contribution from animal research. It is tremendously important, but as indicated above, care must be taken in interpreting that work. In particular, it should be noted that investigation of isolated tissue (like the skinned fibre experiments described above), might not have relevance to function in the body at 37°C. It is not that the observations were wrong, they just did not have external validity! This external validity (see earlier in chapter) had more to do with the temperature at which the measurements were made than with the fact that animals were used.
In the modern exercise physiology lab, animal experimentation is important. Regulations govern the way animals are used, and care is taken to minimize the stress and pain that these animals experience. The value in using animals is that invasive measurements that would not be ethically considered in human subjects can be done with animals, whose lives are essentially dedicated to science.
National and International Organizations for Exercise Physiology
The Canadian Society for Exercise Physiology
Most academics who teach and do research in exercise physiology in Canada are members of the Canadian Society for Exercise Physiology (CSEP). This is one of the largest and most influential academic organizations in Canada (CSEP.ca). CSEP, with funding from the Public Health Agency of Canada, is responsible for originating and maintaining Canada’s Physical Activity Guidelines and the Sedentary Living Guidelines (CSEP guidelines.ca). CSEP also has fostered the use of the PAR-Q for those contemplating a change in their exercise routine, including regular updates. The physical activity readiness is now evaluated with the Get Active questionnaire (CSEP.ca) a document that is available from CSEP for those who need it. CSEP is also responsible for introducing the “Exercise is Medicine” campaign to Canada. This campaign was initiated by the American College of Sports Medicine with the goal to bring exercise prescription and physical activity monitoring into mainstream medical practice. With success in this program, more jobs will open up for those with special training in exercise physiology.
Certifications for Working as a Fitness Consultant or Exercise Physiologist
The Canadian Society for Exercise Physiology offers two levels of certification: Certified Personal Trainer and Clinical Exercise Physiologist. Information about these certifications can be found on the CSEP website: CSEP.ca.
The European College of Sport Science
The European College of Sports Science (ECSS) is a large multinational organization with academic members not only from throughout Europe but also from other countries, including Canada and the United States. ECSS was founded in 1995 and organizes a conference each year at which researchers present their latest findings. The official journal of ECSS is the European Journal of Sport Science. The vision of ECSS is “to lead the promotion and application of world-class, multidisciplinary science in sport and exercise.”
The American College of Sports Medicine (ACSM)
The American College of Sports Medicine, though based in the United States, is an international organization of academics and practitioners of disciplines related to sports medicine. Membership now exceeds 50,000. They host an annual conference that typically has over 5000 attendees. The official journal of ACSM is Medicine and Science in Sports and Exercise. The ACSM was founded in 1954 and the journal was initiated in 1969. The Mission of ACSM is “… advances and integrates scientific research to provide educational and practical applications of exercise science and sports medicine.”
Summary
This is an introductory chapter that is presented with the purpose of giving you a glimpse of what is to follow, and to provide you with some important skills and ideas that will facilitate your understanding of exercise physiology. Learning the language of exercise physiology is very important in facilitating the learning of the concepts in exercise physiology. In some cases, you may be able to learn the meaning of unique terms from the context of its use, but in many cases, you will want to consult the glossary. Although the internet is a fast and easy way to access information, caution must be exercised when you are obtaining information from this source. Some web sites provide information of high quality while other sources can be misleading.
Your learning of the concepts of exercise physiology will be facilitated by representation of the relationships and concepts in graphic form. Some of the common relationships in exercise physiology yield straight-line relationships while others are sigmoidal or exponential. A basic understanding of the concepts of probability and statistics is important to allow you to understand variability, probability, and the notion of significant difference. Statistical evaluation requires measurement, and it is important to understand the concepts of validity and reliability in the context of the measurements that are commonly done in exercise physiology.
As you read through this textbook you will be exposed to a variety of measurements and you will learn to recognize the range of normal values that can be expected for these measurements. You will also become familiar to a substantial range of units for these varied measurements. These units are part of the language of exercise physiology and it is very important to become familiar with these.
One of the most interesting aspects of exercise physiology is the application to elite athlete performance. Although there are many determinants of success in athletics, including: nutrition, psychology, motor coordination, anatomy, and biomechanics; exercise physiology plays a key role in many sports and challenges. For this reason, evaluation of athletic performance becomes a fascinating way to look at the extremes of physiological capability.
Of course, where athletic performance is the epitome of the capacities and capabilities of exercise physiology, disease is the opposite. There are many diseases that compromise the ability to exercise and maintain a reasonable homeostatic condition of the internal milieu. Evaluation of these limits permits an understanding of the importance of the various physiological systems in contributing to the capability to exercise.
Now, we will turn our attention to the history of exercise physiology in Canada. Canadians can be proud of the substantial contribution that has been made to the growth in knowledge and understanding that has arisen from the pioneering work of early Canadian Exercise Physiologists.
Review Questions
At the end of each chapter, there is a selection of multiple-choice questions and usually some essay questions to encourage some discussion. When you have completed each chapter, challenge yourself with the multiple-choice questions. You should be able to get most of them correct. Discuss the essay questions with your fellow students.
Multiple-Choice Questions
- What is the pH of arterial blood?
- a. 7.0
- b. 6.8
- c. 7.4
- d. 8.0
- What are the units for cardiac output?
- L×min-1
- ml×kg-1×min-1
- kg-1×min-1
- all the above
- What are the appropriate units for oxygen uptake while cycling?
- L×min-1
- ml×kg-1×min-1
- kg×min-1
- all the above
- What is the probability of a type I error when < 0.05?
- 95%
- 5%
- 10%
- 99%
- Which of the following has a sigmoidal relationship?
- Relaxation of a muscle contraction
- Relationship between heart rate and power output
- Kinetics of oxygen uptake
- Relationship between partial pressure of O2and relative O2 binding to Hb
- Which of the following is not a journal that contains many researcharticles in exercise physiology?
- Applied Physiology, Nutrition and Metabolism
- Journal of Insignificant Findings
- Medicine and Science in Sport and Exercise
- Sports Medicine
- Which correlation indicates a stronger relationship between two variables?
- 0.05
- 0.1
- -0.99
- 0.75
- What is the meaning of the dot over V () and Q () ?
- it has no meaning
- per minute
- per kilogram
- per liter
- How do you differentiate dependent and independent variable?
- independent is manipulated and the consequence is detected on the dependent variable
- dependent is manipulated and the consequence is detected on the independent variable
- independent is measured without knowledge of cause and dependent has knowing cause
- dependent is measured with prior knowledge of value and dependent is not
- What is the difference between time-constant and half-time
- time-constant represents the time for a constant change while half-time is for the time to change 50%
- time-constant is the change in half the time of relaxation and half-time is the time for half of the change to occur
- time-constant is the time for 63% of the change and half-time is the time for a change equal to half the full amplitude
- time-constant is the time for 50 % of the change and half-time is half the time-constant
Answers to multiple-choice questions:
- c; 2. a; 3. a; 4. b; 5. d; 6. b; 7. c; 8. b; 9. a; 10. c
References
Fabiato, A., & Fabiato, F. (1978). Effects of pH on the myofilaments and the sarcoplasmic reticulum of skinned cells from cardiac and skeletal muscles. Journal of Physiology, 276, 233-255.
Fitts, R. H. (1994). Cellular mechanisms of muscle fatigue. Physiological Reviews, 74(1), 49-94.
Fletcher Jared, R., & MacIntosh Brian, R. (2018). Exercise intensity should be quantified relative to the anaerobic threshold, rahter than maximal oxygen uptake. Journal of Applied Physiology 125, 676-682. doi:10.1152/japplphysiol.00638.2018.
Hill, A. V., Long, C. N. H., & Lupton, H. (1924). Muscular Exercise, Lactic Acid, and the Supply and Utilisation of Oxygen Pt IV- VI. Proceedings of the Royal Society of London. Series B, Containing Papers of a Biological Character, 97(681), 84-138.
MacIntosh, B. R. (1979). Fatigue In Skeletal Muscle. University of Florida,
MacIntosh, B. R., & Rassier, D. E. (2002). What is fatigue? Canadian Journal of Applied Physiology, 27(1), 42-55.
Needham, D. M. (1971). Machina Carnis. The Biochemistry of Muscular Contraction in its Historical Development. Cambridge: Cambridge University Press.
Nelson, C. R., & Fitts, R. H. (2014). Effects of low cell pH and elevated inorganic phosphate on the pCa-force relationship in single muscle fibers at near-physiological temperatures. American Journal of Physiology-Cell Physiology, 306(7), C670-C678. doi:10.1152/ajpcell.00347.2013
Pannier, J. L., Weyne, J., & Leusen, I. (1970). Effects of PCO2, bicarbonate and lactate on the isometric contractions of isolated soleus muscle of the rat. Pflugers Archiv: European Journal of Physiology, 320, 120-132.
Pate, E., Bhimani, M., Franks-Skiba, K., & Cooke, R. (1995). Reduced effect of pH on skinned rabbit psoas muscle mechanics at high temperatures: implications for fatigue. Journal of Physiology, 486, 689-694.
Pedersen, T. H., Nielsen, O. B., Lamb, G. D., & Stephenson, D. G. (2004). Intracellular acidosis enhances the excitability of working muscle. Science, 305(5687), 1144-1147. doi:10.1126/science.1101141
Poole, D. C., Rossiter, H. B., Brooks, G. A., & Gladden, L. B. (2020). The anaerobic threshold: 50+ years of controversy. The Journal of Physiology, n/a(n/a). doi:https://doi.org/10.1113/JP279963
Svedahl, K., & MacIntosh, B. R. (2003). Anaerobic threshold: the concept and methods of measurement. Canadian Journal of Applied Physiology, 28(2), 299-323. doi:10.1139/h03-023
Westerblad, H., Bruton, J. D., & Lannergren, J. (1997). The effect of intracellular pH on contractile function of intact single fibres of mouse muscle declines with increasing temperature. Journal of Physiology, 500, 193-204.
About the Authors

Dr. Brian MacIntosh completed his doctoral training at the University of Florida in Medical Sciences (1979) followed by postdoctoral training at Queens University in Physiology. This training was followed by faculty appointments at Concordia University in Exercise Science (1980-1986), University of Saskatchewan in Physiology (1986-1989) and University of Calgary in Kinesiology (1989-2019). At the University of Calgary, he has taught elementary and advanced undergraduate and graduate level courses in Exercise Physiology and Skeletal Muscle. Dr. MacIntosh has published research on muscle contractile properties and energetics from single cell to whole body exercise. He is a former President of the Canadian Society for Exercise Physiology and one of the first Fellows of the Society. Dr. MacIntosh introduced Exercise is Medicine to Canada, serving as Chair of the Task Force for EIMC from 2012 until 2016. He is a fellow of the American College of Sports Medicine and Professor Emeritus at the University of Calgary.
Dr. Michael Tschakovsky

Dr. Jared Fletcher obtained his PhD in Applied Muscle Physiology from the University of Calgary. There, he studied the relationship between tendon mechanics, muscle energetics and whole-body energy cost of running in distance runners. Following postdoctoral training in the Faculty of Kinesiology and the Cumming School of Medicine and O’Brien Institute of Public Health, he was appointed as an Assistant Professor in the Department of Health and Physical Education at Mount Royal University, where he currently teaches courses in exercise physiology, biomechanics and statistics. He is also an Adjunct Assistant Professor in the Faculty of Kinesiology at the University of Calgary, and was a sport physiologist with the Canadian National Para-Swimming team (2006-2015) and the lead sport physiologist from 2015-2018. His current research integrates physiology and biomechanics to better understand skeletal muscle and tendon function during exercise in individuals across the lifespan, to better understand the metabolic cost of exercise. These findings will help inform exercise prescription and improve exercise tolerance and performance, from clinical rehabilitation to elite athletes.
the study of how the body adjusts acutely and adapts chronically to the challenge of maintaining the internal milieu during exercise
"the intensity of exercise above which there is a sustained non-aerobic contribution to the provision of energy"
"impaired force generation for a given stimulation, usually as a consequence of prior activation"
"when contraction of a muscle results in no length change, it is referred to as static or isometric"
"Contractile tissue under voluntary control for the purpose of force generation or motion"
should be interpreted as meaning without the use of oxygen
