There has always been a delicate balance between how much of the Earth’s surface can be used for agriculture and the ability to produce enough food to sustain a growing population. Climate, terrain, groundwater, and soil composition create limits on what and where crops can be produced without major human adaptations to the landscape. New technologies and scientific knowledge have helped to increase the world’s cultivated land significantly. However, spatial variations in land resources like rainfall and temperature zones are still the most significant factors in determining what land is suitable for specific crops and types of agriculture.
The world’s cultivated land has grown by 12 percent over the last 50 years, mostly at the expense of forest, wetland and grassland habitats. At the same time, the global irrigated land has doubled. The distribution of these land and water assets is unequal among countries. Although only a small part of the world’s land and water is used for crop production, most of the easily accessible and (thus economic) resources are under cultivation or have other ecologically and economically valuable uses. Therefore, the ability to expand more cultivated land is limited. Only parts of South America and sub-Saharan Africa still offer a scope for some expansion. At the same time, competition for water resources has also been growing to the extent that today, more than 40 percent of the world’s rural population is now living in water-scarce regions.
The total global land area is 13.2 billion hectares (ha). A hectare is a metric system area unit and widely used land measurement for agriculture and forestry; it equals to 10,000 square meters. Of this, 12 percent (1.6 billion ha) is currently in use for cultivation of crops, 28 percent (3.7 billion ha) is under forest, and 35 percent (4.6 billion ha) comprises grasslands and woodland ecosystems. Low-income countries cover about 22 percent of the land area, but they account for 38 percent of the global population.
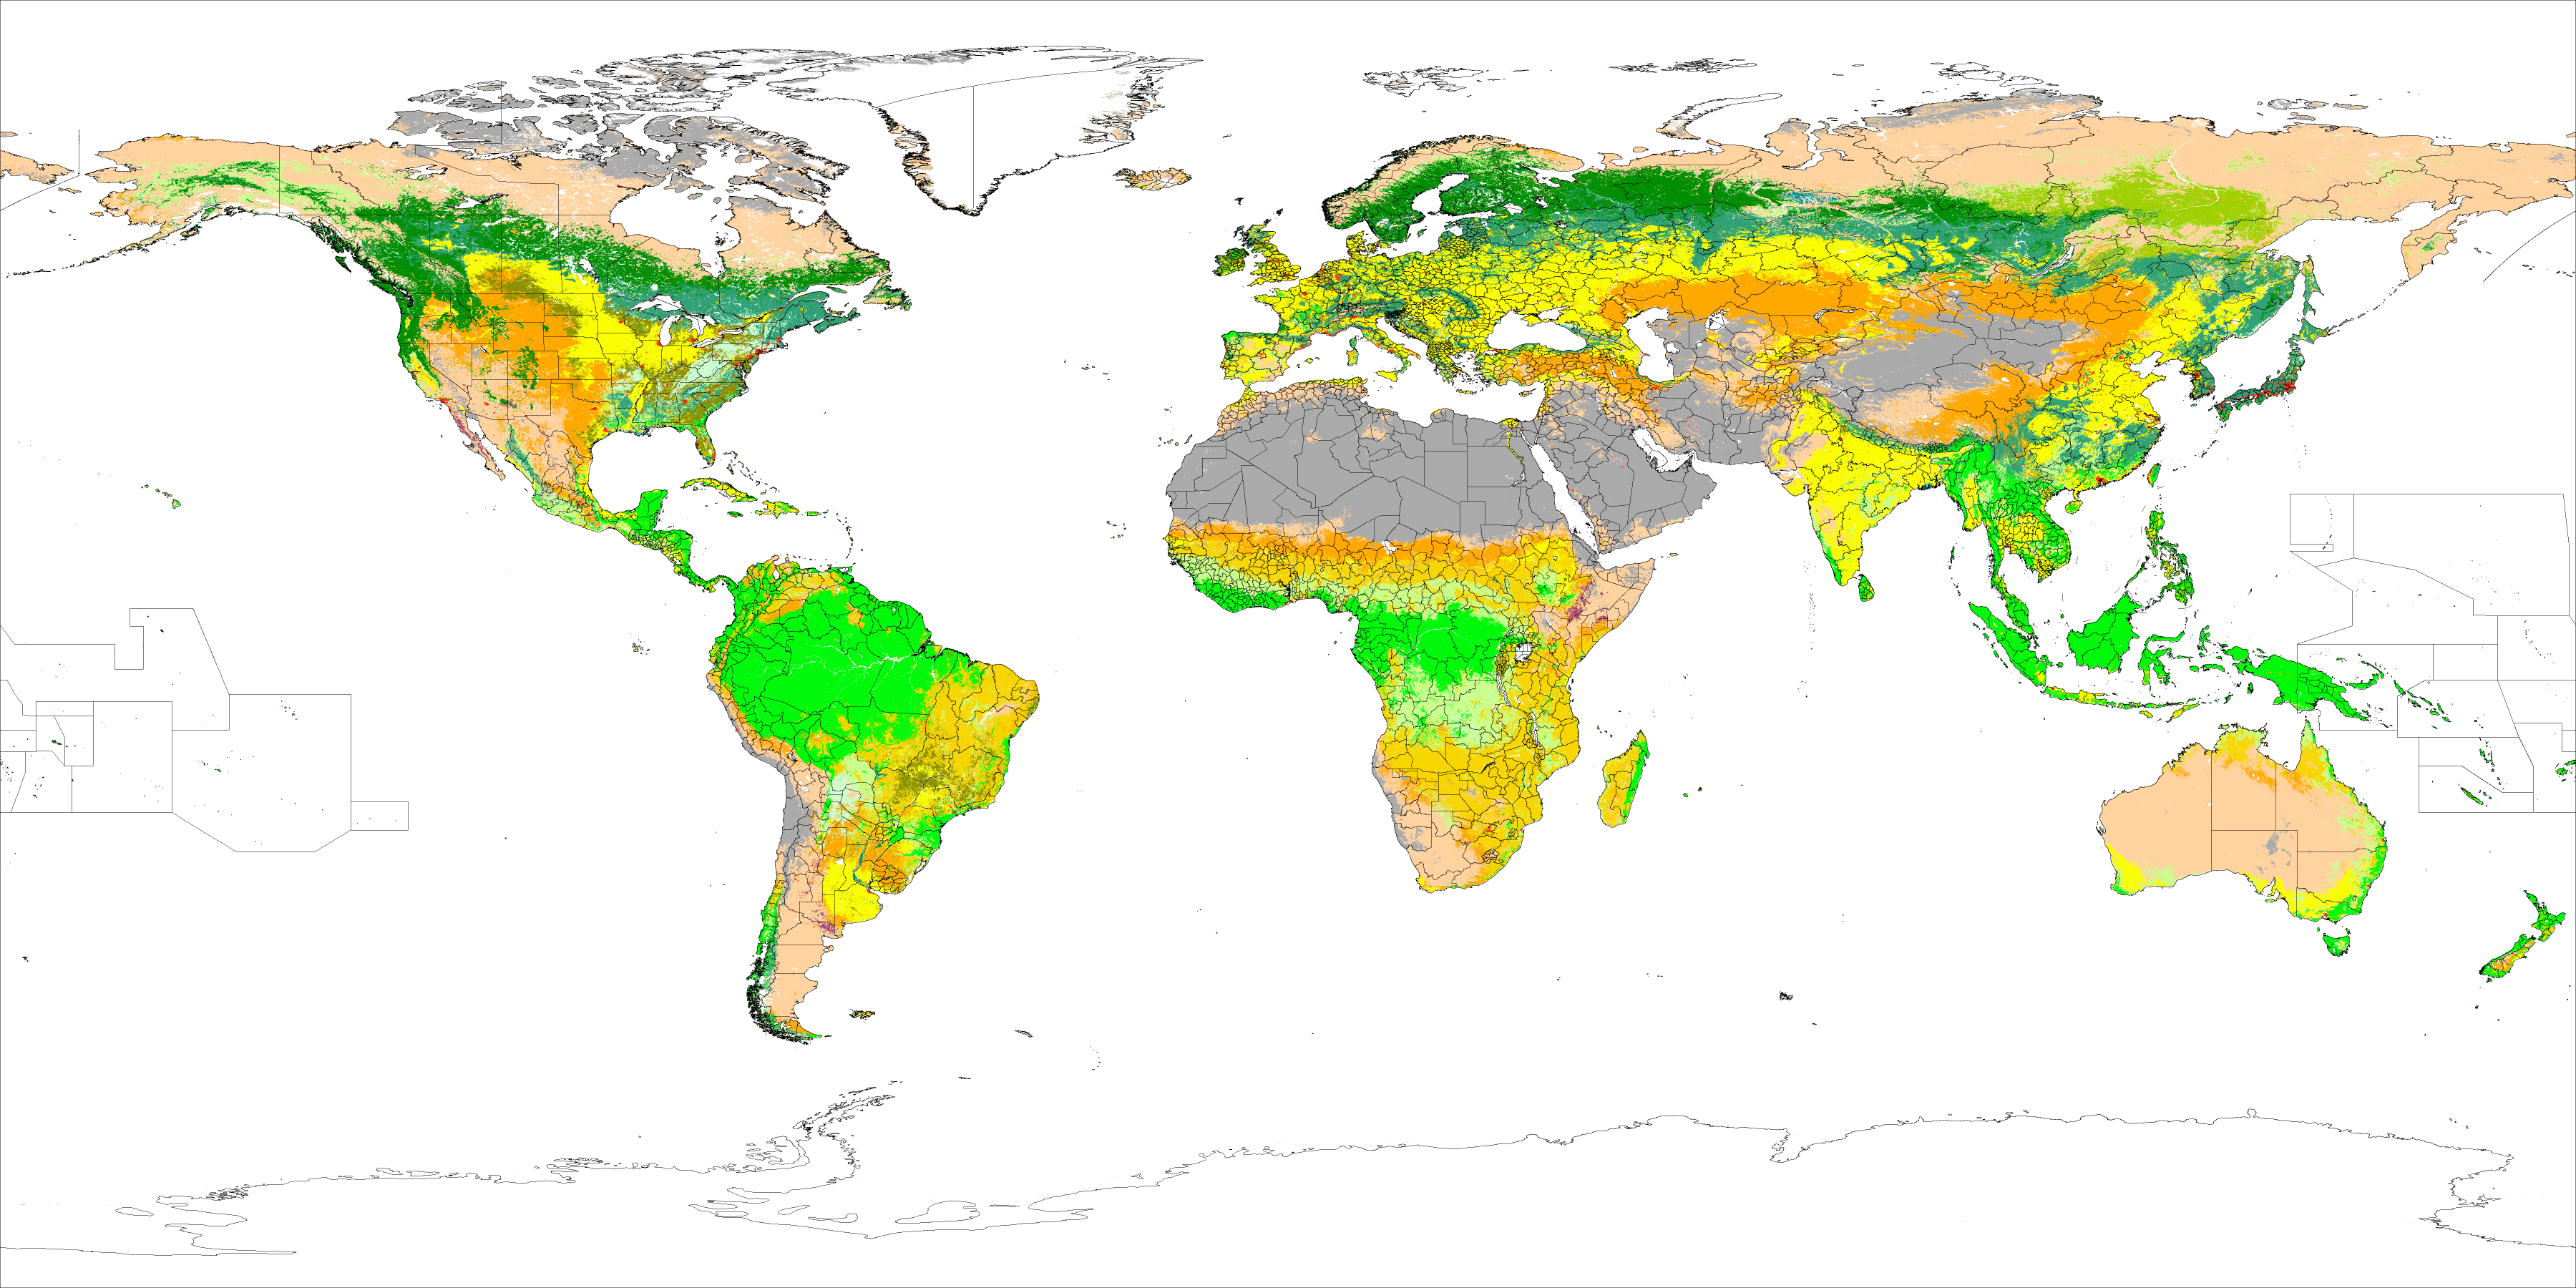
Land use varies with climatic and soil conditions and human influences (Figure 5.12). Figure 5.13 further shows the dominant land use by region. Deserts prevail across much of the lower northern latitudes of Africa and Asia. Dense forests predominate in the heartlands of South America, along with the seaboards of North America, and across Canada, Northern Europe and much of Russia, as well as in the tropical belts of Central Africa and Southeast Asia. Cultivated land is 12 to 15 percent of the total land in each category.
Cultivated land is a leading land use (a fifth or more of the land area) in South and Southeast Asia, Western and Central Europe, and Central America and the Caribbean, but is less critical in sub-Saharan and Northern Africa, where cultivation covers less than a tenth of the area. In low-income countries, soils are often more deficient, and only 28 percent of the total cultivated land is suitable for high yield crops.
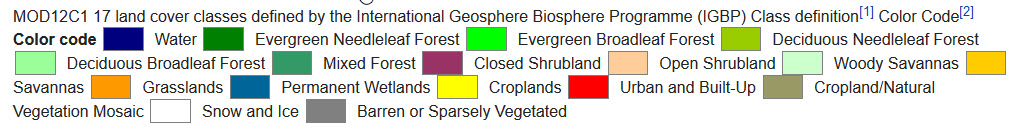 It is also important to note that with overall growth in cultivated land, rain-fed croplands have declined slightly and irrigated cropland has more than doubled in the time between 1961-2008. This helps us to understand how humans have adapted the landscape for agricultural purposes.
Water resources available for irrigation are very unevenly distributed, with some countries having an abundance of water while others live in conditions of extreme scarcity or shortage of water. Also, even where water may appear abundant, much of it is not accessible or is very expensive to develop, or is not close to lands that can be developed for agriculture. Water scarcity has three dimensions: physical (when the available supply does not satisfy the demand), infrastructural (when the infrastructure in place does not allow for satisfaction of water demand by all users) and institutional (when institutions and legislation fail to ensure reliable, secure and equitable supply of water to users).
In some regions, particularly in the Middle East, Northern Africa, and Central Asia, countries are already using water resources more than what is available. The resultant stresses on ecosystems are increasingly apparent. It is now estimated that more than 40 percent of the world’s rural population lives in river basins that are, physically water, scarce.
Table 5.1: Types of Rainfed Production Systems and Regions
| System | Characteristics and Examples |
| Rain-fed agriculture: highlands | Low productivity, small-scale subsistence (low- input) agriculture; a variety of crops on small plots plus few animals. |
| Rain-fed agriculture: dry tropics | Drought-resistant cereals such as maize, sorghum, and millet. Livestock often consists of goats and sheep, especially in the Sudano-Sahelian zone of Africa, and in India. Cattle are more widespread in southern Africa and Latin America. |
| Rain-fed agriculture: humid tropics | Mainly root crops, bananas, sugar cane, and notably soybean in Latin America and Asia. Maize is the most important cereal. Sheep and goats are often raised by more impoverished farmers while cattle are held by wealthier ones. |
| Rain-fed agriculture: subtropics | Wheat (the essential cereal), fruits (e.g., grapes and citrus), and oil crops (e.g., olives). Cattle are the most dominant livestock. Goats are also essential in the southern Mediterranean, while pigs are dominant in China and sheep in Australia. |
| Rain-fed agriculture: temperate | Principal crops include wheat, maize, barley, rapeseed, sugar beet, and potatoes. In the industrialized countries of Western Europe, the United States and Canada, this agricultural system is highly productive and often combined with intensive, penned livestock (mainly pigs, chickens, and cattle). |
At the same time, in more developed countries, urban and industrial demand, has been growing faster than agricultural demand. Whereas in less-developed countries agricultural use remains dominant, in Europe 55 percent of water is used by industry. Water stresses occur locally across the globe, but some entire regions are highly stressed, particularly the Middle East, the Indian subcontinent, and northeastern China. Sub-Saharan Africa and the Americas experience lower levels of water stress. The quality of water is also impacted when run-off returns to the environment. In general, increasing population and economic growth combined with little or no water treatment have led to more negative impacts on water quality. Agriculture, as the largest water user, is a significant contributor. Key pollutions include nutrients and pesticides derived from crop and livestock management.
Rain-fed agriculture depends on rainfall for crop production, with no permanent source of irrigation. Rain-fed agriculture produces about 60 percent of global crop output in a wide variety of production systems (Table 5.1). The most productive systems are concentrated in temperate zones of Europe, followed by Northern America, and rain-fed systems in the subtropics and humid tropics. Rain-fed cropping in highland areas and the dry tropics tend to be relatively low- yielding, and is often associated with subsistence farming systems. Evidence from farms worldwide shows that less than 30 percent of rainfall is used by plants in the process of cultivation. The rest evaporates into the atmosphere, percolates to groundwater or contributes to river runoff.
Agricultural Economics
We know that climate and terrain place physical limits on what can be grown in specific locations on Earth. However, we must also take into account the geographic nature of the choices farmers make when deciding what to plant. Once subsistence farming intensifies to the point of producing more food than it requires to feed a family or local community, it makes financial sense for farmers to sell their excess products. In this shift from substance to commercial agriculture farms need to be profitable; and the more profitable, the better, so farmers carefully choose the crops and animals they raise. These decisions, in turn, affect what we eat.
You might be thinking, “Farmers do not control what I eat. I eat what tastes good”, but opinions vary wildly on the issue of taste preference from country to country, and even within the countries. Taste preferences for food vary within and across ethnicities, and even house to house among people that would seem alike in almost every way. Still, some trends characterize regions, in the US, and around the world, many of these foodways have roots in the local geography of a place. It is often said, “you are what you eat,” but geographers might add the rejoinder “what you eat depends on where you eat.” Family traditions determine what people eat, but understanding the evolution of those traditions requires an analysis of the spatial contexts in which they evolved.
Our ethnic heritage explains much of our taste preferences. European immigrants to the US established most American foodways. Europeans living 300 years ago would have readily recognized many American dietary staples, such as beef, pork, chicken, bread, pasta, cheese, and milk, as well as a number of the fruits and vegetables we commonly eat. Modern Americans also copy foodways borrowed from the indigenous people of the Americas. Less prominent elements of American’s diet are traceable to Asia and Africa.
Eating is a daily ritual, and as such, it is a deeply ingrained cultural routine. What you like to eat is probably not that different from what your parents and grandparents like to eat. The same was true for your grandparents, giving dietary habits exceptional staying power. This fact is part of the reason behind our obesity crisis. Our lifestyle has changed as rapidly as technology, and the economy has evolved, but many of our foodways are stubbornly resistant to change. The diets that served our ancestors who were farmers or laborers engaged in strenuous daily activities, provides too many calories and fat for a generation working and living in the information age. Cultural lag is the term that describes the inability of cultural practices to keep pace with changes in technological advancement. Numerous behaviors exhibit cultural lag, and culturally conservative regions exhibit a higher degree of cultural lag than places with more progressive tendencies
A sizeable portion of the American diet is purely American. We have adopted several foodstuffs favored by Native Americans. Maize, better known in America as “corn,” is perhaps the most American part of our diet. Domesticated by the indigenous people of Mexico thousands of years ago, it has proven a versatile and hardy plant. It is so versatile that today much of the world eats maize in some fashion. Most Americans know maize mostly as sweet corn. Americans eat sweet corn like corn on the cob, but also canned, frozen and fresh “off the cob,” and in a variety of dishes.
Less well known are maize varieties are known as field corn, although it is far more common because of its great versatility. Field corn is too hard to eat raw, so we modify it. Some of it is processed into cornmeal or cornstarch, which we in turn use to make things like corn chips, tortillas, and sauces. We also consume a lot of corn syrup and high fructose corn syrup (HFCS) made from field corn. Corn syrups are used as a sweetener, thickeners, and to keep foods moist or fresh. HFCS is an inexpensive replacement for cane and beet sugars, and therefore is the most common sweetener used in processed foods and soft drinks.
Malnutrition and Obesity
Several scientists suspect corn sweeteners play a significant role in the obesity crisis in the United States, and elsewhere. Some critics argue that although it tastes nearly the same, the human body responds differently to HFCS than traditional sugars. They argue that since HFCS replaced cane sugar as the most common sweetener, a variety of health issues have appeared in the US and elsewhere. Of course, the corn industry disputes such charges. Since this is not a biology course, there is no reason to wade into a discussion of human metabolism, but it is appropriate to illustrate how geography partly explains why we use HFCS in such vast quantities.
Several reasons explain the use of HFCS, rather than granulated sugars, including cane sugar and beet sugar. Cost is the apparent reason, but why HFCS is cheaper has a lot to do with geography. First, corn grows well in much of the US, so farmers can flood the market and drive down prices. Sugar cane and sugar beets, on the other hand, are less well adapted to American climates. Sugar cane grows best in a rainy climate, and to be profitable requires a very long, warm growing season. Only Hawaii, parts of Texas, Louisiana and Florida can profitably produce sugar cane. Cane yield is highly dependent on climate, and only Hawaii’s climate is ideal in the US. Cane yields in Hawaii are triple those in Louisiana. Sugar beets are more widely grown in the US because they grow well in multiple climates. California and Minnesota both produce sugar beets. Half of the US granulated sugar production is made from beets. Climate and labor conditions outside the US make foreign sugar much cheaper than domestic sources.
The other main reason HFCS is far less expensive than granulated sugar is US government policies. First, the government provides massive subsidies to the corn industry, helping drive down the price of HFCS. At the same time, the US government provides special subsidies to cane sugar producers through tax breaks and incentives. The US government even buys sugar that farmers cannot sell at an above world market price. More importantly, the US government restricts sugar imports, mainly from Cuba, an otherwise cheap source of sugar for Americans. These trade protection policies help sugar farmers, but food processors and consumers wind up paying higher prices for cane sugar and sugar-sweetened foods than they would under free market conditions. As a result, food processors use HFCS.
The nearly $8 billion subsidies paid to corn farmers is four times greater than that paid to the sugar beet and cane industry. This has consequences. One is that there is a considerable surplus of corn. In 2014, there were about 1.63 billion bushels of corn left unsold. Some years it is higher. One side effect is that people eat only a tiny fraction of the field corn grown in the US directly. About half of the yearly field corn crop is used to make biofuels, particularly ethanol that is blended with gasoline by many petroleum companies. If you own a car, corn is probably in your gas tank; and your lungs if you live in a smoggy location. The other half of the corn crop becomes animal feed. Farmers use both the grain and the silage, to feed cattle. Farmers feed corn to chickens and hogs as well. Even cat and dog foods often have corn in it.
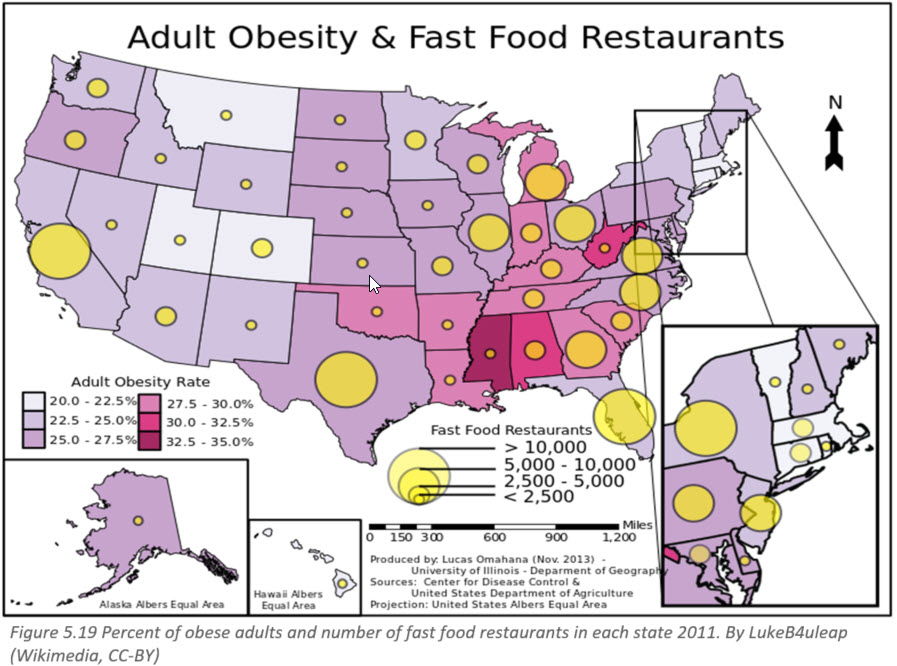
Exceptionally cheap corn helps make meat less expensive than many other types of food. College students on a budget already know that it is a lot cheaper to buy lunch at a local fast-food burger joint than a healthy green salad. Government policies also shape school lunch programs. Kids get cheap, often unhealthy, food, and return agribusiness benefits. In 2011, the US Congress even declared pizza sauce and ketchup “vegetables” for the sake of school lunches to help specific agribusiness interests. The inexpensiveness of unhealthy meats and grains increases the incentives for their consumption, often in the form of fast food. In impoverished regions of the US, fast food is more widely available than elsewhere. Spatially, we can track the impact of these agricultural policies on the geography of the United States.
The economics of agriculture does not just impact our waistline. They impact who farms the land. Small-scale farms are far more impacted by fluctuations in the price of their goods because they are often dependent on one specific product. Conversely, large-scale commercial farms can spread out their economic risk among several products, larger stock or even multiple locations, in the case of a devastating weather event, crop catastrophe, or price fluctuation. An example of this can be seen in dairy farming in the United States.
A significant transformation of dairy farming has reduced the number of farms by nearly 60 percent over the past 20 years, even as total milk production increased by one- third. Recent results from the Census of Agriculture and the Agricultural Resource Management Survey (ARMS) detail how and why the structure of dairy production has changed.
The mean herd size of dairy farms rose from 61 cows in 1992 to 144 in 2012, but most cows are now on farms that are much larger than average. The midpoint farm size is used to track cows; the midpoint shows the herd size at which half of all cows are in larger herds and half are in smaller herds. In 1992, the midpoint of 101 cows was not much larger than the mean, reflecting the fact that most cows were small and mid-size dairy farms. However, the midpoint rose sharply over the next two decades, to 900 cows by 2012, over six times larger than the mean herd size.
In the simplest terms, your milk is most likely coming from a large- scale commercial farm rather than your local family-owned dairy. Check out www.whereismymilkfrom.com
The economics of dairy farming primarily drives the shift to larger dairy farms. Average costs of production, per gallon of milk, are lower in larger herds because production and distribution are more efficient. These costs include the estimated costs of the farm family’s labor as well as resource costs.
The cost differences reflect differences in input use; on average, larger farms use less labor, capital, and feed per gallon of milk produced. This is known as economy of scale and is the reason for starting and maintaining small and mid-sized farming operations can be so difficult. A large dairy owner can make a deal with other farmers to purchase enormous amounts of corn, soybeans, and hay at a discount to feed their milk cows while a small-scale farmer is more likely to pay a higher retail price. In addition to the costs associated with running a commercial agricultural operation, small-scale dairy farmers are profoundly impacted by the price of milk.
Many factors influence milk prices in the United States, including state and federal programs designed to ensure that milk prices do not fall so low that dairy producers cannot cover the cost of production. Non-governmental organizations, such as dairy cooperatives, also play a role in determining minimum pricing. Based on August 2016 price estimates from USDA, U.S. farmers and ranchers again received about 17.4 cents for every $1 spent by consumers for food at the retail level. More than 80 cents per $1 went for marketing, processing, wholesaling, distribution and retailing. A producer’s share of a gallon of fat-free milk, selling for $3.99 at retail, was $1.47, or about 37 percent. Figure 5.22 is aimed at policymakers to change how prices are set for milk so that small-scale farmers can stay competitive with large-scale operations.
https://www.youtube.com/watch?v=37NHX2iZrBA
Spatial Geography of Food
The transformation of agriculture into large-scale agribusiness has created a complex system linking food production with consumers. Here is how we think of our modern food system:
| Farmers/Growers —-> | A Miracle Occurs —-> | Consumers |
This miraculous system, which causes food to appear in grocery stores is an illusion. Somehow, we imagine the farmer pulling his or her truck up behind the supermarket and unloading baskets of fresh fruits and vegetables or sides of beef and pork into the open arms of the retailer and his staff. Moreover, frankly, the bigger the supermarket, the more likely there will be signs, photos, and even wall-sized murals showing farmers and ranchers smiling as they offer their vegetables and fruit or stand with an arm around the neck of a sleek beef cow. In reality, the path our food takes to get to our plates is more like a messy game of hopscotch.
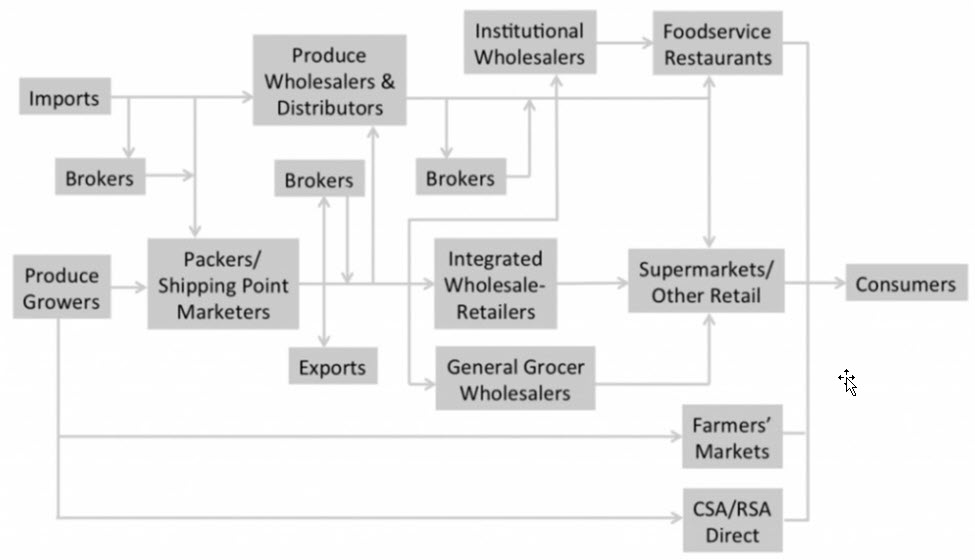
A geographer thinks of these complex supply chains in a global spatial context. Each stop along the way from food producers to consumers represents part of the agricultural landscape. So, how far does our food travel before it gets to our plates?
Consider the journey of a Washington apple. Washington State is one of the largest producers of apples in the United States (Figure 5.21) however, the processing of apples for juice and apple sauce occurs all across the country, with one of the largest operations being Knouse Foods in Pennsylvania. That means if you live next to an orchard in Wenatchee, Washington and you go to the local grocery store for applesauce, it is likely to have traveled about 5,300 miles from Washington to Pennsylvania and back again.
This is not the exception, but rather the rule, in our current food system. Shipping food long distances for processing and packaging, importing, and exporting foods that do not need to be imported or exported – these are standard practices in the food industry. According to one report, in 1996, Britain imported more than 114,000 metric tons of milk. Was this because British dairy farmers did not produce enough milk for the nation’s consumers? No, since the UK exported almost the same amount of milk that year, 119,000 tons.
Food has moved around the world ever since Europeans brought tea from China, but efficient modern transportation and bioengineering has made it more practical to bring food from distant places where labor costs and farm expenses may be cheaper. Nowadays, it is not only tropical foodstuffs such as sugar, coffee, chocolate, tea, and bananas that are shipped long distances to come to our tables but also fruits and vegetables that once grew locally, in household gardens and on small farms. An apple imported to Washington from New Zealand is often less expensive than an apple from the historic apple-growing county of Okanogan, just a few hours away from Seattle. Moreover, the global diffusion of mega-marts like Costco and Walmart have only accelerated this trend.
It is estimated that the average American meal travels about 1500 miles to get from the farm to plate. Why is this cause for concern? There are many reasons:
- This long-distance, large-scale transportation of food consumes large quantities of fossil fuels. It is estimated that we currently put almost 10 kcal of fossil fuel energy into our food system for every 1 kcal of energy we get as food.
- Transporting food over long distances also generates great quantities of carbon dioxide emissions. Some forms of transport are more polluting than others. Airfreight generates 50 times more CO2 than sea shipping. However, sea shipping is slow, and in our increasing demand for fresh food, food is increasingly being shipped by faster – and more polluting – means.
- To transport food long distances, much of it is picked while still unripe and then gassed to “ripen” it after transport, or it is highly processed in factories using preservatives, irradiation, and other means to keep it stable for transport and sale. Scientists are experimenting with genetic modification to produce longer- lasting, less perishable produce.
 Visit resourcesfutures.org for a visualization of complex commodity chains worldwide.
food security
With all of this food being shipped around the world, the question must be asked, “Why are there still hungry people in the world?” That is a complex and highly debated question right now. First, we need to look at the production of food by global region, because it shows some notable patterns.
First, it is essential to understand the graph. The index of 100 refers to the base level of production in 1961. Therefore, any movement away from the base level can be seen as a percentage change. For example, world output has increased by 140 percent from 1961 to 1999. The vast majority of this increase is as a result of increases in Asia. In Asia, we can see almost a 75 percent increase in food production. In contrast, Africa shows a general decline of 10 percent by 1999. The graph also shows that food production is quite variable over time. Most regions, except for Asia, have experienced periods of increased output and periods of decline.
There are several essential points of reference. First, there are only a few net exporters of food; the central countries being USA, Canada, France, Germany, Poland, Brazil, China, and Australia, with some other South American and South East Asian economies also net exporters of food. The most striking pattern in the map is the reliance on almost the entire African continent on food imports.
Traditionally, developed countries as a whole have had a net surplus in agricultural trade. However, the agricultural trade balance of the emerging countries has gradually dwindled until, by the mid-1990s, it was more often negative than positive. Unfortunately, this overall trend masks a complex picture which varies from one commodity to another and from one country to another. The drastic decline in developing countries’ net surplus in sugar, oilseeds and vegetable oils, for example, reflects growing consumption and imports in several developing countries and the effects of protectionist policies in the major industrial countries. For commodities produced almost entirely in developing countries and consumed predominantly in the industrial countries, such as coffee and cocoa, slow growth in demand prevented the trade balance of the developing countries from improving. Fluctuating prices further contributed to the problem.
Globally, there is enough land, soil and water, and enough potential for further growth in crops, to make the necessary production possible. Harvest growth will be slower than in the past, but at the global level, this is not, and producers have satisfied sufficient market demand in the past. However, the concept of supply and demand does not represent the total need for food and other agricultural products worldwide because hundreds of millions of people lack the money to buy what they need or the resources to produce it themselves.
We can produce enough food in the world as a whole, but there will still be problems of food security at the household or national level. In urban areas, food insecurity usually reflects low incomes, but in poor rural areas, it is often inseparable from problems affecting food production. In many areas of the developing world, the majority of people still depend on local agriculture for food and livelihoods, but the potential of local resources to support further increases in production is minimal, as technology to produce more abundant crops is limited. Examples are semi-arid areas and areas with problem soils. In such areas, agriculture is often dependent on global policies and the ability to offer economical and technological aid.
Food price Index
Food concerns can be monitored and addressed by analyzing the food price index, which the Food and Agriculture Organization of the United Nations states “is a measure of the monthly change in international prices of a basket of food commodities. It consists of the average of five commodity group price indices, weighted with the average export shares of each of the groups. There is great concern that globally, food prices are rising making it harder for families to purchase quality food, along with raising concerns for global food insecurity issues.
At the World Food Summit in 1996, the World Health Organization (WHO), defined food security as “when all people at all times have access to sufficient, safe, nutritious food to maintain a healthy and active life.” The WHO go on by saying, “food security is a complex sustainable development issue, linked to health through malnutrition, but also to sustainable economic development, environment, and trade.”
FAO estimates that around one billion people are undernourished and that each year, more than three million children die from undernutrition before their fifth birthday. Also, the physiological needs of pregnant and lactating women make them more susceptible to malnutrition and micronutrient deficiencies. Twice as many women suffer from malnutrition as men, and girls are twice as likely to die from malnutrition than boys. Maternal health is crucial for child survival – an undernourished mother is more likely to deliver an infant with low birth weight, significantly increasing its risk of dying.
https://www.youtube.com/watch?v=_-xHkk-z81U
Role of Women in Agriculture
In emerging countries, rural women and men play different roles in guaranteeing food security for their households and communities. While men grow mainly field crops, women are usually responsible for growing and preparing most of the food consumed in the home and raising small livestock, which provides protein.
Rural women also carry out most home food processing, which ensures a diverse diet, minimizes losses, and provides marketable products. Women are more likely to spend their incomes on food and children’s needs – research has shown that a child’s chances of survival increase by 20% when the mother controls the household budget. Women, therefore, play a decisive role in food security, dietary diversity, and children’s health.
However, gender inequalities in control of livelihood assets limit women’s food production. In Ghana, studies found that insecure access to land led women farmers to practice shorter fallow periods than men, which reduced their yields, income, and the availability of food for the household. In sub-Saharan Africa, diseases such as HIV/AIDS force women to assume more significant caretaking roles, leaving them less time to grow and prepare food. Women’s access to education is also a determining factor in levels of nutrition and child health. Studies from Africa show that children of mothers who have spent five years in primary education are 40 percent more likely to live beyond the age of five.
Having an adequate supply of food does not automatically translate into adequate levels of nutrition. In many societies, women and girls eat the food remaining after the male family members have eaten. Women, girls, the sick and disabled are the primary victims of this “food discrimination,” which results in chronic undernutrition and ill- health.
A phenomenon found in many regions and countries today is the trend towards the so-called “feminization of agriculture,” or the growing dominance of women in agricultural production and the concurrent decrease of men in the sector. This trend makes it more imperative than ever to take action to enhance women’s ability to carry out their tasks in agricultural production and their other contributions to food security. This development goes hand in hand with the increasing number of female-headed households around the world. A significant cause of both these developments is male-out migration from rural areas to towns and cities in their countries or abroad and the abandonment of farming by men for more lucrative occupations.
In Africa, where women have traditionally performed the majority of work in food production, agriculture is becoming increasingly a predominantly female sector. Economic policies favoring the development of industry, and the neglect of the agricultural sector, particularly domestic food production, have led to an exodus of rural people to the urban or mining areas, to seek income-earning opportunities in mines; large export-oriented commercial farms, fishing enterprises, and other businesses.
While there is still insufficient data to give exact figures on women’s contributions to agricultural production everywhere in the world, the collection of data is increasing. This data, together with field studies and gender analyses, make it possible to draw several conclusions about the extent and nature of women’s multiple roles in agricultural production and food security. If anything, women’s contributions to farming, forestry, and fishing may be underestimated, as many surveys and censuses count only paid labor. Women are increasingly active in both the cash and subsistence agricultural sectors and much of their work in producing food for the household and community consumption, as important as it is for food security, is not counted in statistics.
