4 Data, Statistics and Probability
Section Information
Outcome/Competency: You will be able to make informed predictions and decisions using statistics and probability.
Timing: 15h
Rationale: Why is it important for you to learn this skill?
A common expression now is “trust the science.” People will often quote all types of data and statistics to make a point because, to a large extent, science is nothing but numbers. The problem is that data and statistics can be twisted and misrepresented. In order to make informed and wise decisions, you need to know how to interpret data and statistics and identify any problems and bias.
Objectives:
To be competent in this area, the individual must be able to:
- Represent and interpret data using technology
- Understand how the method of data collection can affect results
- Understand the role of probability in society
Learning Goals
- Model, represent, compare, interpolate, extrapolate, and draw conclusions about data presented in various forms
- Analyze, identify, critique, and explain the relationship between method of data collection and results
- Understand the relationship between probabilistic data, conclusions and decision making both broadly and personally
In this section you will learn about data representation using graphs, data collection, interpreting data and decision making and probability. You will be shown examples and then given opportunities to practice your skills.
This content is available online for free at https://cnx.org/contents/XgdE-Z55@40.9:XgdE-Z55 and is extracted and modified here under the creative commons attribution 4.0 license.
Chapter Contents:
- Introduction
- Topic 1: Data Representation Using Graphs
- Topic 2: Data Collection
- Topic 3: Interpreting Data and Decision Making
- Topic 4: Probability
- Test: Outcome 4
Introduction
You are probably asking yourself the question, “When and where will I use statistics?”. If you read any newspaper or watch television, or use the Internet, you will see statistical information. There are statistics about crime, sports, education, politics, and real estate. Typically, when you read a newspaper article or watch a news program on television, you are given sample information. With this information, you may make a decision about the correctness of a statement, claim, or “fact.” Statistical methods can help you make the “best educated guess.”
Since you will undoubtedly be given statistical information at some point in your life, you need to know some techniques to analyze the information thoughtfully. Think about buying a house or managing a budget. Think about your chosen profession. The fields of economics, business, psychology, education, biology, law, computer science, police science, and early childhood development require at least one course in statistics.
Included in this chapter are the basic ideas and words of probability and statistics. You will soon understand that statistics and probability work together. You will also learn how data are gathered and what “good” data are.
The science of statistics deals with the collection, analysis, interpretation, and presentation of data. We see and use data in our everyday lives. In your classroom, try this exercise. Have class members write down the average time (in hours, to the nearest half-hour) they sleep per night. Your instructor will record the data. Then create a simple graph (called a dot plot) of the data. A dot plot consists of a number line and dots (or points) positioned above the number line. For example, consider the following data:
5; 5.5; 6; 6; 6; 6.5; 6.5; 6.5; 6.5; 7; 7; 8; 8; 9
The dot plot for this data would be as follows:
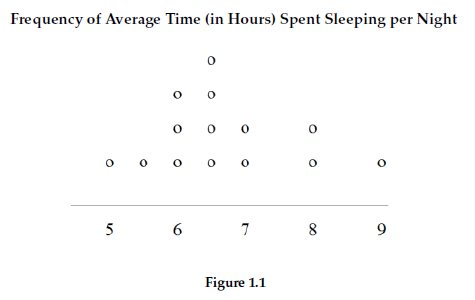
Does your dot plot look the same as or different from the example? Why? If you did the same example in an English class with the same number of students, do you think the results would be the same? Why or why not? Where do your data appear to cluster? How could you interpret the clustering? The questions above ask you to analyze and interpret your data. With this example, you have begun your study of statistics.
Key Terms
In statistics, we generally want to study a population. You can think of a population as an entire collection of persons, things, or objects under study. To study the larger population, we select a sample. The idea of sampling is to select a portion (or subset) of the larger population and study that portion (the sample) to gain information about the population. Data are the result of sampling from a population.
Because it takes a lot of time and money to examine an entire population, sampling is a very practical technique. If you wished to compute the overall grade point average at your school, it would make sense to select a sample of students who attend the school. The data collected from the sample would be the students’ grade point averages. In presidential elections, opinion poll samples of 1,000 to 2,000 people are taken. The opinion poll is supposed to represent the views of the people in the entire country. Manufacturers of canned carbonated drinks take samples to determine if a 16 ounce can contain 16 ounces of carbonated drink.
From the sample data, we can calculate a statistic. A statistic is a number that is a property of the sample. For example, if we consider one math class to be a sample of the population of all math classes, then the average number of points earned by students in that one math class at the end of the term is an example of a statistic. The statistic is an estimate of a population parameter. A parameter is a number that is a property of the population. Since we considered all math classes to be the population, then the average number of points earned per student over all the math classes is an example of a parameter.
One of the main concerns in the field of statistics is how accurately a statistic estimates a parameter. The accuracy really depends on how well the sample represents the population. The sample must contain the characteristics of the population in order to be a representative sample. We are interested in both the sample statistic and the population parameter in inferential statistics. In a later chapter, we will use the sample statistic to test the validity of the established population parameter.
A variable, notated by capital letters like X and Y, is a characteristic of interest for each person or thing in a population. Variables may be numerical or categorical. Numerical variables take on values with equal units such as weight in pounds and time in hours. Categorical variables place the person or thing into a category. If we let X equal the number of points earned by one math student at the end of a term, then X is a numerical variable. If we let Y be a person’s party affiliation, then examples of Y include Republican, Democrat, and Independent. Y is a categorical variable. We could do some math with values of X (calculate the average number of points earned, for example), but it makes no sense to do math with values of Y (calculating an average party affiliation makes no sense).
Data are the actual values of the variable. They may be numbers, or they may be words. Datum is a single value.
Two words that come up often in statistics are mean and proportion. If you were to take three exams in your math classes and obtained scores of 86, 75, and 92, you calculate your mean score by adding the three exam scores and dividing by three (your mean score would be 84.3 to one decimal place). If, in your math class, there are 40 students and 22 are men and 18 are women, then the proportion of men students is 22 40 and the proportion of women students is 18 40 . Mean and proportion are discussed in more detail in later chapters.
Example 1
Define the key terms from the following study: We want to know the average (mean) amount of money first year college students spend at ABC College on school supplies that do not include books. We randomly survey 100 first year students at the college. Three of those students spent $150, $200, and $225, respectively.
Solution:
The population is all first-year students attending ABC College this term.
The sample could be all students enrolled in one section of a beginning statistics course at ABC College (although this sample may not represent the entire population).
The parameter is the average (mean) amount of money spent (excluding books) by first year college students at ABC College this term.
The statistic is the average (mean) amount of money spent (excluding books) by first year college students in the sample.
The variable could be the amount of money spent (excluding books) by one first year student. Let X = the amount of money spent (excluding books) by one first year student attending ABC College.
The data are the dollar amounts spent by the first year students. Examples of the data are $150, $200, and $225.
Classroom Exercise 1
Do the following exercise collaboratively with up to four people per group. Find a population, a sample, the parameter, the statistic, a variable, and data for the following study: You want to determine the average (mean) number of glasses of milk college students drink per day. Suppose yesterday, in your English class, you asked five students how many glasses of milk they drank the day before. The answers were 1, 0, 1, 3, and 4 glasses of milk.
Solution:
Population- college students
Sample- 5 students in English class
Parameter- glasses of milk average per day in college
Statistic- mean number of glasses of milk per day in sample
Variable- # of glasses of milk
Data- 1,0,1,3,4.
Data
Data may come from a population or from a sample. Small letters like x or y generally are used to represent data values. Most data can be put into the following categories:
- Qualitative
- Quantitative
Qualitative data are the result of categorizing or describing attributes of a population. Hair color, blood type, ethnic group, the car a person drives, and the street a person lives on are examples of qualitative data. Qualitative data are generally described by words or letters. For instance, hair color might be black, dark brown, light brown, blonde, gray, or red. Blood type might be AB+, O-, or B+. Researchers often prefer to use quantitative data over qualitative data because it lends itself more easily to mathematical analysis. For example, it does not make sense to find an average hair color or blood type.
Quantitative data are always numbers. Quantitative data are the result of counting or measuring attributes of a population. Amount of money, pulse rate, weight, number of people living in your town, and the number of students who take statistics are examples of quantitative data. Quantitative data may be either discrete or continuous.
All data that are the result of counting are called quantitative discrete data. These data take on only certain numerical values. If you count the number of phone calls you receive for each day of the week, you might get 0, 1, 2, 3, etc.
All data that are the result of measuring are quantitative continuous data assuming that we can measure accurately. For example, if you and your friends carry backpacks with books in them to school, the numbers of books in the backpacks are discrete data and the weights of the backpacks are continuous data.
Example 2
The data are the number of books students carry in their backpacks. You sample five students. Two students carry 3 books, one student carries 4 books, one student carries 2 books, and one student carries 1 book. The numbers of books (3, 4, 2, and 1) are the quantitative discrete data.
Example 3
The data are the weights of the backpacks with the books in it. You sample the same five students. The weights (in pounds) of their backpacks are 6.2, 7, 6.8, 9.1, 4.3. Notice that backpacks carrying three books can have different weights. Weights are quantitative continuous data because weights are measured.
Example 4
The data are the colors of backpacks. Again, you sample the same five students. One student has a red backpack, two students have black backpacks, one student has a green backpack, and one student has a gray backpack. The colors red, black, black, green, and gray are qualitative data.
Classroom Exercise 2
Work collaboratively to determine the correct data type (quantitative or qualitative). Indicate whether quantitative data are continuous or discrete. Hint: Data that are discrete often start with the words “the number of.”
- The number of pairs of shoes you own.
- The type of car you drive.
- Where you go on vacation.
- The distance it is from your home to the nearest grocery store.
- The number of classes you take per school year.
- The tuition for your classes.
- The type of calculator you use.
- Movie ratings.
- Political party preferences.
- Weight of sumo wrestlers.
- Amount of money won playing poker.
- Number of correct answers on a quiz.
- Peoples’ attitudes toward the government.
- IQ scores.
Solution:
1. quantitative discrete
2. qualitative
3. qualitative
4. quantitative continuous
5. quantitative discrete
6. quantitative discrete
7. qualitative
8. quantitative discrete
9. qualitative
10. quantitative continuous
11. quantitative discrete
12. quantitative discrete
13. qualitative
14. quantitative discrete
Topic 1: Data Representation Using Graphs
Data is used in decision making. For example, the Saskatchewan provincial government collects data on high school graduation rates of indigenous students. This information is used to:
- Identify the disparity between Indigenous and non-Indigenous graduation rates
- Monitor the effectiveness of educational programs to promote indigenous student graduation over time.
How data are represented can influence how the data is interpreted. That is, it is possible to sway people’s opinion based on how you present the data. Raw data is often represented in a table, like the one below. The consumer of the data must sift through the numbers to draw their own conclusions. It is easier to highlight trends if the data are represented graphically.
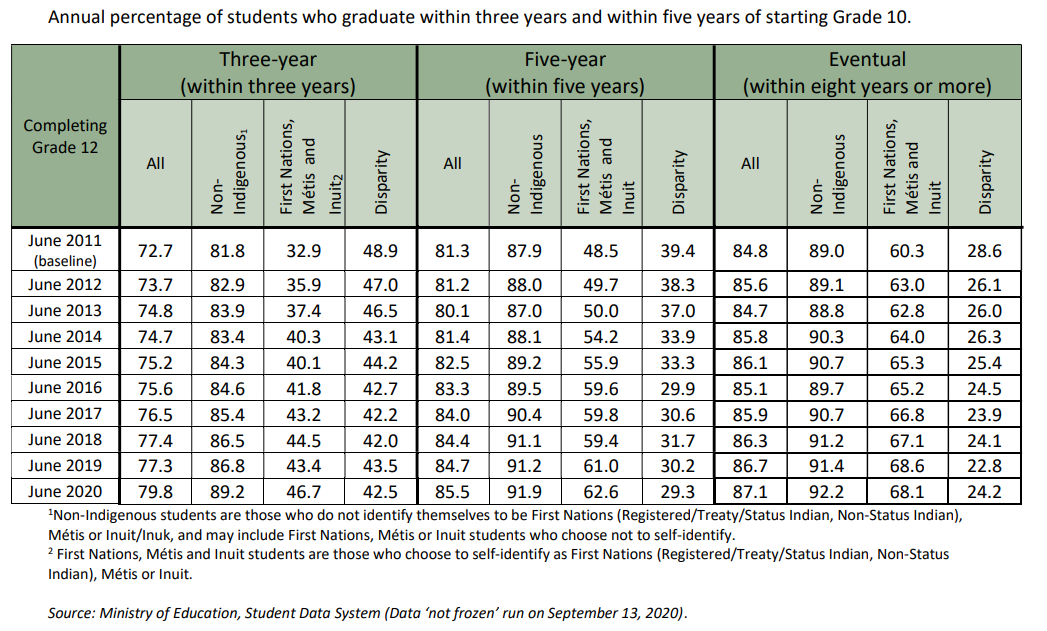
Figure 1 extracted from Ministry of Education Annual Report for 2020-21 accessed from https://www.saskatchewan.ca/government/government-structure/ministries/education on September 25, 2021
Tables are a good way of organizing and displaying data. But graphs can be even more helpful in understanding the data. There are no strict rules concerning what graphs to use. Below are pie charts and bar graphs, two graphs that are used to display qualitative data.
1.1 Pie Chart
In a pie chart, categories of data are represented by wedges in the circle and are proportional in size to the percent of individuals in each category.
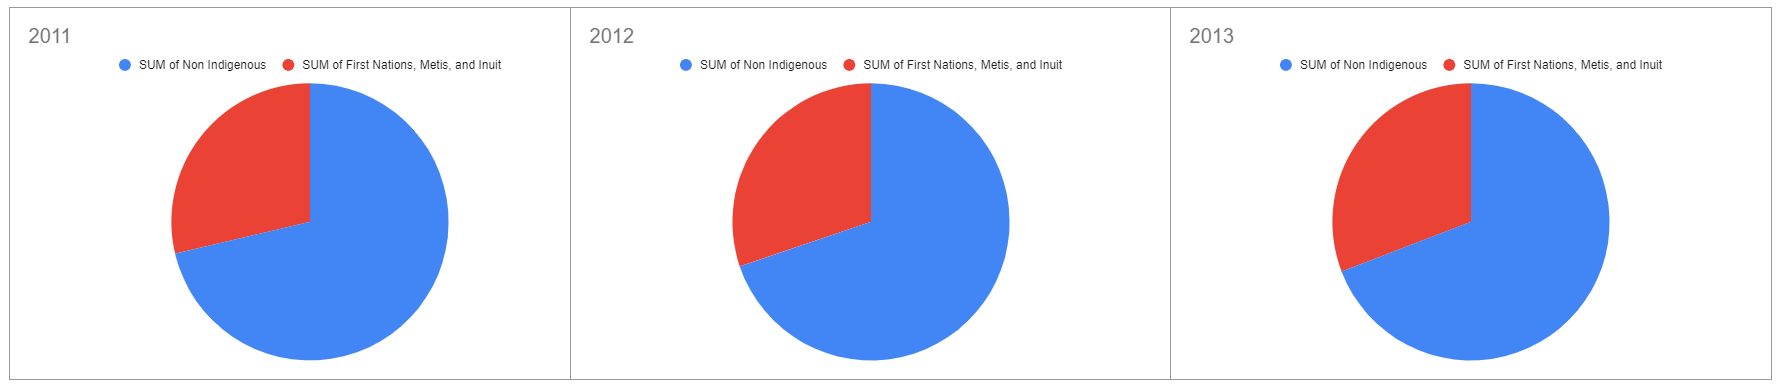
Figure 2: Pie Charts Comparing Graduation Rates of Indigenous and Non Indigenous Students for 2011, 2012, 2013
1.2 Line graph
In a line graph, a line connects the data points from one year to the next to display a trend over time.
Look at the graphs and determine which graph (pie or bar) you think displays the comparisons better.
It is a good idea to look at a variety of graphs to see which is the most helpful in displaying the data. We might make different choices of what we think is the “best” graph depending on the data and the context. Our choice also depends on what we are using the data for.
We can use a variety of computer programs (called spreadsheets) to represent data. One program is Microsoft Excel. Another program is called Google Sheets. In the examples below, we will use Google Sheets because it is accessible to anyone with an internet connection.
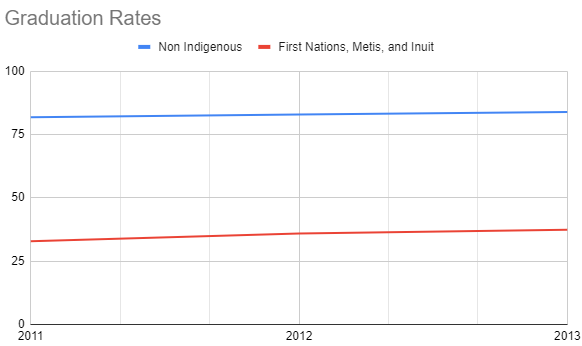
Figure 3: Line Graph Comparing Graduation Rates of Indigenous and Non Indigenous Students for 2011, 2012, 2013
In both the pie charts and the line graph, it is obvious that the graduation rates of Indigenous vs Non-Indigenous barely changed over the three years. The advantage of the line graph is that you only need to look at one chart to see that there is no change, whereas for the pie charts, three charts are needed to represent that data.
If you wanted to compare the difference between the graduation rates of Indigenous and Non-Indigenous students in one year, the pie chart is beneficial. By looking at one pie chart, you can see that roughly two thirds as many non-Indigenous as Indigenous students graduate in a single year. By looking at the line graph, you only get the sense that more Non-Indigenous students graduate in general, not the proportion.
Just as it is important to choose the right chart to display your data, it is important to understand how the chart displays the data. It is possible to make the data look like it supports different conclusions based on how the chart is constructed. Consider the two charts below. These charts are made from the exact same data. (The data from the table in Figure 1.)
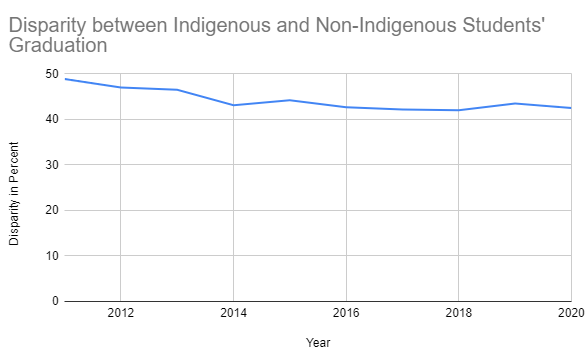
Figure 4: Graph with wide range in vertical axis
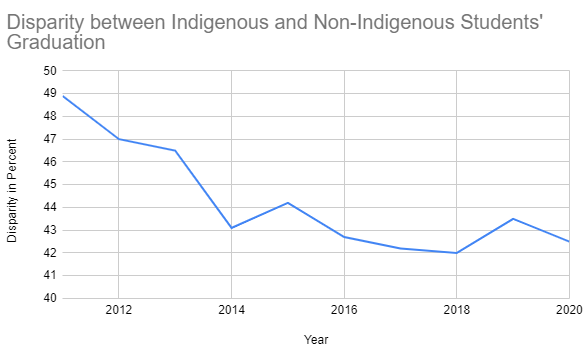
Figure 5: Line graph with narrow range in vertical axis
Looking at Figure 4, one might conclude that government programs to reduce the disparity in graduation rates are ineffective, because the disparity has barely changed in roughly 10 years.
Looking at Figure 5, one might conclude that the disparity between Indigenous and non-indigenous graduation rates has significantly decreased, and so government programs are working well.
While the data are exactly the same, the way the data are represented is different. Look at the vertical axis (left hand side.) In Figure 4, the percentage starts at 0 and goes to 50. This makes the change look very small. In Figure 5 there is a narrower range of values: 40 to 50. This makes any change in data look more dramatic.
Practice Exercises: Data Representation Using Graphs
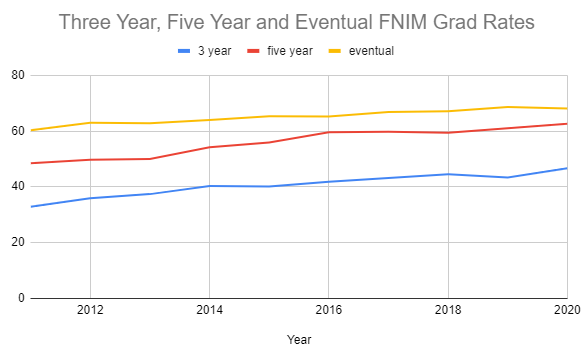
Use the data in Figure 1 to compare the three timeframes of graduation: three year, five year, and eventual. Using Google Sheets, enter the data, construct the appropriate chart type, and include appropriate data ranges.
Solution:
May vary. This is a sample:
Topic 2: Data Collection
Gathering information about an entire population often costs too much or is virtually impossible. Instead, we use a sample of the population.
This section will describe a few of the most common methods.
There are several different methods of random sampling. In each form of random sampling, each member of a population initially has an equal chance of being selected for the sample. Each method has pros and cons.
In other words, each sample of the same size has an equal chance of being selected. For example, suppose Lisa wants to form a four-person study group (herself and three other people) from her pre-calculus class, which has 31 members not including Lisa. To choose a simple random sample of size 3 from the other members of her class, Lisa could put all 31 names in a hat, shake the hat, close her eyes, and pick out 3 names.
Other well-known random sampling methods are stratified sampling, cluster sampling, and systematic sampling.
For example, you could stratify (group) your college population by department and then choose a proportionate simple random sample from each stratum (each department) to get a stratified random sample. To choose a simple random sample from each department, number each member of the first department, number each member of the second department and do the same for the remaining departments. Then use simple random sampling to choose proportionate numbers from the first department and do the same for each of the remaining departments. Those numbers picked from the first department, picked from the second department and so on represent the members who make up the stratified sample.
To choose a cluster sample, divide the population into clusters (groups) and then randomly select some of the clusters. All the members from these clusters are in the cluster sample.
For example, if you randomly sample four departments from your college population, the four departments make up the cluster sample. Another example, divide your college faculty by department. The departments are the clusters. Number each department and then choose four different numbers using simple random sampling. All members of the four departments with those numbers are the cluster sample.
For example, suppose you have to do a phone survey. Your phone book contains 20,000 residence listings. You must choose 400 names for the sample. Number the population 1 – 20,000 and then use a simple random sample to pick a number that represents the first name of the sample. Then choose every 50th name thereafter until you have a total of 400 names (you might have to go back to the of your phone list). Systematic sampling is frequently chosen because it is a simple method.
A type of sampling that is non-random is convenience sampling.
For example, a computer software store conducts a marketing study by interviewing potential customers who happen to be in the store browsing through the available software. The results of convenience sampling may be very good in some cases and highly biased (favors certain outcomes) in others.
Sampling data should be done very carefully. Collecting data carelessly can have devastating results. Surveys mailed to households and then returned may be very biased (for example, they may favor a certain group). It is better for the person conducting the survey to select the sample respondents. In statistics, a sampling bias is created when a sample is collected from a population and some members of the population are not as likely to be chosen as others (remember, each member of the population should have an equally likely chance of being chosen). When a sampling bias happens, there can be incorrect conclusions drawn about the population that is being studied.
[h5p id=”63″]
Example 1
Suppose ABC College has 10,000 part-time students (the population). We are interested in the average amount of money a part-time student spends on books in the fall term. Asking all 10,000 students is an almost impossible task. Suppose we take two different samples. First, we use convenience sampling and survey 10 students from a first term organic chemistry class. Many of these students are taking first term calculus in addition to the organic chemistry class. The amount of money they spend is as follows:
$128; $87; $173; $116; $130; $204; $147; $189; $93; $153
The second sample is taken by using a list from the P.E. department of senior citizens who take P.E. classes and taking every 5th senior citizen on the list, for a total of 10 senior citizens. They spend:
$50; $40; $36; $15; $50; $100; $40; $53; $22; $22
Problem 1
Do you think that either of these samples is representative of (or is characteristic of) the entire 10,000 part-time student population?
Solution:
No. The first sample probably consists of science-oriented students. Besides the chemistry course, some of them are taking first-term calculus. Books for these classes tend to be expensive. Most of these students are, more than likely, paying more than the average part-time student for their books. A second sample is a group of senior citizens who are, more than likely, taking courses for health and interest. The amount of money they spend on books is probably much less than the average part-time student. Both samples are biased. Also, in both cases, not all students have a chance to be in either sample.
Problem 2
Since these samples are not representative of the entire population, is it wise to use the results to
describe the entire population?
Solution:
No. For these samples, each member of the population did not have an equally likely chance of being chosen. Now, suppose we take a third sample. We choose ten different part-time students from the disciplines of chemistry, math, English, psychology, sociology, history, nursing, physical education, art, and early childhood development. (We assume that these are the only disciplines in which part-time students at ABC College are enrolled and that an equal number of part-time students are enrolled in each of the disciplines.) Each student is chosen using simple random sampling. Using a calculator, random numbers are generated and a student from a particular discipline is selected if he/she has a corresponding number. The students spend:
$180; $50; $150; $85; $260; $75; $180; $200; $200; $150
Problem 3
Is the sample biased?
Solution:
The sample is unbiased, but a larger sample would be recommended to increase the likelihood that the sample will be close to representative of the population. However, for a biased sampling technique, even a large sample runs the risk of not being representative of the population.
Practice Exercises: Data Collection
As a class, determine whether or not the following samples are representative. If they are not, discuss the reasons.
1. To find the average GPA of all students in a university, use all honor students at the university as the sample.
2. To find out the most popular cereal among young people under the age of 10, stand outside a large supermarket for three hours and speak to every 20th child under age 10 who enters the supermarket.
3. To find the average annual income of all adults in the United States, sample U.S. congressmen. Create a cluster sample by considering each state as a stratum (group). By using simple random sampling, select states to be part of the cluster. Then survey every U.S. congressman in the cluster.
4. To determine the proportion of people taking public transportation to work, survey 20 people in New York City. Conduct the survey by sitting in Central Park on a bench and interviewing every person who sits next to you.
5. To determine the average cost of a two day stay in a hospital in Massachusetts, survey 100 hospitals across the state using simple random sampling.
Solution:
1. Not rep. honour students have higher GPA than average
2. Representative
3. Not representative- congressmen make more than average
4. Not representative. People in park don’t represent all people (example, suburbs)
5. Representative.
Student Task
The previous example is good for demonstrating how bias occurs, but we may not been in a similar situation (college taking organic chemistry.)
Group up with another one or two other students.
Discuss a situation where you were the subject of a survey. How do you think you were chosen (what selection method)? What was the survey meant to find out? Do you feel the process used to select you leads to a fair representation?
Reconvene as a class and discuss results.
Topic 3: Interpreting Data and Decision Making
We need to critically evaluate the statistical studies we read about and analyze before accepting the results of the study. Common problems to be aware of include:
- Problems with Samples: A sample should be representative of the population. A sample that is not representative of the population is biased. Biased samples that are not representative of the population give results that are inaccurate and not valid.
- Self-Selected Samples: Responses only by people who choose to respond, such as call-in surveys are often unreliable.
- Sample Size Issues: Samples that are too small may be unreliable. Larger samples are better if possible. In some situations, small samples are unavoidable and can still be used to draw conclusions, even though larger samples are better. Examples: Crash testing cars, medical testing for rare conditions.
- Undue influence: Collecting data or asking questions in a way that influences the response.
- Non-response or refusal of subject to participate: The collected responses may no longer be representative of the population. Often, people with strong positive or negative opinions may answer surveys, which can affect the results.
- Causality: A relationship between two variables does not mean that one causes the other to occur. They may both be related (correlated) because of their relationship through a different variable.
- Self-Funded or Self-Interest Studies: A study performed by a person or organization in order to support their claim. Is the study impartial? Read the study carefully to evaluate the work. Do not automatically assume that the study is good but do not automatically assume the study is bad either. Evaluate it on its merits and the work done.
- Misleading Use of Data: Improperly displayed graphs, incomplete data, lack of context.
- Confounding: When the effects of multiple factors on a response cannot be separated. Confounding makes it difficult or impossible to draw valid conclusions about the effect of each factor. Note, the following examples are extracted from Baron, L, et. al., “Math Makes Sense 9,” Chapter 9. Pearson, 2009.
Example 1
For each survey question, explain why a problem may occur and the effect it would have on the results. Suggest how each problem could be avoided.
a) A survey is conducted to find out if citizens think the local government should provide more money for youth activities. The question asked was: “Would you support an increase in taxes to create more skate parks?”
b) A survey is conducted to find out the level of school spirit. Students are polled about their level of school spirit after the soccer team wins the championship.
Solution:
a) The use of language in the survey question could be problematic. The question emphasizes what citizens would lose; that is, their taxes would increase. The question also downplays what citizens would gain by only mentioning skate parks, instead of a variety of activities. Most people would probably respond by saying they would not support an increase in taxes to build more skate parks. A better question would be: “Do you think the local government should supply more funds for youth recreational activities?”
b) The timing of the survey question could be problematic. Since the school’s soccer team just won the championship, the level of school spirit would be higher than usual. The results of the survey may show a higher level of school spirit than if the survey was conducted at another time. Asking students the same question a month later, when no school event is occurring, should produce more accurate results.
Student Task 1
Group up with another one or two other students.
Can you think of another question on the same topic that would lead to a different bias?
Reconvene as a class and discuss results.
Example 2
Jack and Jill plan to open a shop in Saskatoon that would sell crafts. To ensure Saskatoon is the best place for their business, they want to survey residents to find out how popular crafts are. Jack knows that they would get the most accurate results if each household in Saskatoon is surveyed, but Jill points out that this is problematic. Explain why.
Solution:
The number of households in Saskatoon is great. Jack and Jill may have problems related to cost and time. The cost of printing and mailing enough surveys for each household would be very high. Also, Jack and Jill should provide an envelope and stamp for each household to return the survey. This would be an additional cost. The time it would take to print, mail, and collect the surveys for all the households would be too long.
Example 3
Antonia wants to find out if there is a relationship between household income and how much people spent on Christmas presents. Identify potential problems Antonia may encounter and explain how she could deal with the problems.
Solution:
Christmas is not celebrated by all cultures, and so the survey question does not apply to everyone. An appropriate opening question for the survey might be: “Do you celebrate Christmas?” If a person responds “No”, then he or she will not need to answer the other question in your survey.
Information about income and spending habits is personal, so people may be uncomfortable revealing it. An anonymous survey would be appropriate. The use of language may influence responses. Examples of inappropriate or intrusive questions would be: “How much do you make?” and “How much do you spend?” A better question might be: “Is the amount you spend on Christmas presents:
– greater than your weekly income?
– less than your weekly income?
– equal to your weekly income?”
Practice Exercises: Interpreting Data and Decision Making
1. Name a problem with each data collection.
a) After the first week of school, your principal asks you and your friends how you are enjoying school.
b) An online magazine asks readers either to agree or disagree with the statement: “If you find a $20-bill, you turn it in.”
c) Brenda asks her classmates if they think girls should not be allowed to cover their heads in school.
d) To discover the most popular kind of movie at his school, Carlos plans to ask each student what her or his favourite kind of movie is.
2. For each scenario in question 1:
a) Describe the effect each problem would have on the data collection.
b) How could each problem be overcome?
3. Jill wanted to find out how often the computers in her school were being used. She asked students the question: “How much time do you spend on the computer each week?”
a) How do you think her schoolmates will interpret this question?
b) How could the question be rewritten so it would more accurately reflect what Jill wants to know?
c) Who might be interested in her findings? Why?
4. Andrew went to each class in his school and asked for a show of hands to find out how many students had ever been bullied at school. Only 2 students raised their hands. Andrew concluded that bullying was not a major problem at his school.
a) Is this a reasonable conclusion? Explain.
b) Describe a better method for conducting Andrew’s survey.
5. Trinity wants to find out how football fans feel about building a new indoor football stadium for a Canadian Football League team. She goes to the stadium to survey fans after a winning game on a warm August evening.
a) Describe how the timing of her question may influence the responses.
b) In what setting might the responses be different than those Trinity received?
6. a) Describe how each question reveals a bias of the questioner.
i) Do you think it is a good idea to use DNA tests to convict a violent criminal?
ii) Do you think gas guzzling SUVs should be banned?
iii) Do you think students should be allowed to use spell check because it automatically improves spelling?
b) Rewrite each question to eliminate the bias. Explain how your question is an improvement.
7. Rebecca was looking for a cell phone service provider. She surveyed her friends and asked who their service providers were. Based on these data, she chose the provider that her friends used more than any other.
a) Do you think Rebecca’s question reflected what she wanted to know? Explain.
b) What questions might have helped Rebecca to make a more informed decision?
8. A fashion website is conducting a survey. Sasha answered questions about his favourite brands of clothing, then provided an email address as a login to the site in the future. Shortly after this, his inbox was full of emails advertising a new brand of clothing.
a) Which important factor did the survey designers overlook? How is this problematic?
b) How can the survey designers avoid this problem?
9. Provide an example of data collection where the cost and time needed to complete the collection may lead to problems.
Solution:
1. a) Privacy
b) Use of language
c) Cultural sensitivity
d) Time
2. a) Part a: Since the survey is not anonymous, the students may hesitate to respond negatively (to the principal) or positively (to avoid seeming to flatter the principal in front of their friends). Part b: The principal should give students a written survey and ask them to return it anonymously to his/her office. The question should ask: “Are you enjoying school?”
b) Part a: The statement presents the most ethical option and no reasons for choosing another option, which may affect the results in favour of turning the wallet in. Part b: The statement could be made into a question: “If you find a $20-bill, do you keep it or turn it in?”
c) Part a: Some people would not be aware of the cultural importance of head covering. Part b: Brenda should ask if students are aware of the cultural significance of someone covering her or his head, and then ask the question.
d) Part a: Carlos will probably run out of time before he asks every student. Part b: Carlos should choose a representative sample of the students to survey.
3. a) Students will think Jill’s question asks about how much time they spend on the computer at school and at home.
b) “How much time do you spend on the school computers?”
c) The school administration could be interested in the results to plan the school’s budget for new computers.
4. a) No; many students who are bullied are afraid to tell people, especially in a non-anonymous environment.
b) An anonymous survey
5. a) On a warm August evening, the fans may not immediately see the point of building an indoor stadium, so many may respond negatively.
b) On a very cold November evening, Trinity may receive many more responses in favour of an indoor stadium.
6. a) i) The use of the words “violent criminal”; bias toward using DNA tests
ii) The use of the words “gas-guzzling”; negative description of SUVs
iii) The question emphasizes the positive aspect of spell checks.
b) i) Do you think that DNA evidence should be allowed in courts?
ii) Are you in favour of banning SUVs?
iii) Do you think students should be allowed to use spell check?
7. a) No
b) Rebecca should have asked if her friends had any problems with their service provider, what service providers they had in the past, and whether they are satisfied with their current service providers.
8. a) Ethics: The survey designers didn’t tell Sasha that promotional emails might be sent to the email address he provided. This reflects poorly on the brands advertised on the website.
b) Tell people their email addresses may be used for future correspondence and allow people then to indicate whether they wish to receive such emails.
9. Finding the favorite ice cream flavor of Canadian teens by surveying each teen would be expensive and time-consuming.
Topic 4: Probability
Probability is a mathematical tool used to study randomness. It deals with the chance (the likelihood) of an event occurring. For example, if you toss a fair coin 4 times, the outcomes may not be 2 heads and 2 tails. However, if you toss the same coin 4,000 times, the outcomes will be close to half heads and half tails. The expected theoretical probability of heads in any one toss is 1 2 or 0.5. Even though the outcomes of a few repetitions are uncertain, there is a regular pattern of outcomes when there are many repetitions. After reading about the English statistician Karl Pearson who tossed a coin 24,000 times with a result of 12,012 heads, one of the authors tossed a coin 2,000 times. The results were 996 heads. The fraction 996 2000 is equal to 0.498 which is very close to 0.5, the expected probability.
- The theory of probability began with the study of games of chance such as Chekutnak (Stick Dice.) Predictions take the form of probabilities.
- To predict the likelihood of an earthquake, of rain, or whether you will get an A in this course, we use probabilities.
- Doctors use probability to determine the chance of a vaccination causing the disease the vaccination is supposed to prevent.
- A stockbroker uses probability to determine the rate of return on a client’s investments.
- You might use probability to decide to buy a lottery ticket or not.
In your study of statistics, you will use mathematics through probability calculations to analyze and interpret your data.
Chekutnak – Stick Dice
|


This information is from http://mathcentral.uregina.ca/RR/database/RR.09.00/treptau1/game3.html accessed on September 25, 2001. Note, the following is extracted and modified from Baron, L, et. al., “Math Makes Sense 9,” Chapter 9. Pearson, 2009.
Practice Exercises
From the statements below,
a) Identify the different probabilities that Jean-Guy considers in a day.
b) List an assumption associated with each statement.
c) Explain how the situation would change if that assumption were not true.
➤ Jean-Guy noticed that, in the last month, 70% of the time the bus was 3 minutes late. So, he takes his time with breakfast today.
➤ Lately, Jean-Guy’s math teacher checks homework 4 days a week. So, Jean-Guy makes sure he has time to complete his homework today.
➤ At school, Jean-Guy and his friends agree that their lacrosse team has a 95% chance of making the finals.
➤ In health class, Jean-Guy’s teacher reads a magazine that claims 172 out of 1000 male smokers develop lung cancer, but only 13 out of 1000 males who do not smoke develop lung cancer.
Share your assumptions with those of another pair of students. Discuss:
- Which assumptions do you think are the most likely and least likely to be true?
- Which probability could have been most influenced by personal opinion?
- How do you think the other probabilities were determined? Explain.
Probability refers to the likelihood that an event will occur. By collecting and analyzing data, predictions can be made about the likelihood that a certain event will occur.
For example, meteorologists study past weather data to make predictions about future conditions. A 40% probability of snow means that under similar conditions in the past it snowed 40% of the time, or 4 times out of 10. A probability of 40% can be expressed as 4 out of 10, 4/10 , or 0.4. When you flip a coin, there is a 0.5 probability the coin will land heads up. Despite this probability, you may feel strongly that the coin will land tails up. In this case, you have made a subjective judgment.
Sometimes a probability can be used to support opposing views.
Example 1
Jon wants to learn how to snowboard but does not want to take lessons. His mother insists that Jon take lessons. Jon and his mother find an article that claims: “68% of snowboarding injuries occur during beginner lessons” Explain how both Jon and his mother can use this statistic to support their opinions.
Solution:
68% of snowboarding injuries occur during beginner lessons. Jon’s mother can argue that this statistic proves lessons are important because beginners are prone to accidents. Jon can argue that this statistic is a good reason not to take lessons because the likelihood of getting injured during the lesson is high.
For Discussion
Car insurance for teenagers is more expensive than for adults because the probability of an accident is greater for teenage drivers. What assumptions is an insurance company making when it charges a teenage driver more for insurance?
Practice Exercises: Probability
1. Indicate whether each decision is based on theoretical probability, experimental probability, or subjective judgment. Explain how you know.
a) The last two times Andrei won a prize at a coffee shop, he ordered a medium hot chocolate. Andrei never won when he ordered a large hot chocolate, so today he orders a medium hot chocolate.
b) Instead of buying her own lottery ticket, Martha pools her money with the people at work to buy more tickets and increase her chances of winning.
c) Anita boards the last car of a train because, in the past, the last car always had available seats.
d) Doug will not travel by airplane even though experts say it is safer to fly than drive.
2. What assumptions is each person making?
a) Based on past math quizzes, Claudia says she has a 90% chance of getting a perfect score on her next math quiz.
b) Six times out of ten, Omar gets stuck in traffic when he leaves work. So, he calculates that his chances for getting stuck in traffic today after work are 60%.
3. The weather forecast is 70% chance of rain. Winona had planned to go canoeing. Explain how the decision she makes may be based either on probability or on subjective judgment.
4. The student council has a draw for a prize during the school dance. Lei decides not to enter the draw because all of his classmates have entered and he feels unlucky today. Is Lei’s decision based on probability, on subjective judgment, or both? Explain.
5. One year, the probability of not recovering a stolen vehicle in Montreal was 44%. How could politicians use this fact to argue that:
a) more money should be allotted to searching for stolen vehicles
b) more money should not be allotted, and instead should go to different causes.
6. Vanessa observes her birdfeeder at the same time each day for a week. She notes that 32 of the 100 birds which visit the feeder are cardinals. She concludes that, in general, there is a 32% probability a bird visiting the feeder will be a cardinal.
a) What assumptions did Vanessa make?
b) If each assumption changes, how might the predicted outcome change?
7. A headline states: “A poll reveals 30% support Bradford, 70% support Choo in next election” Kathryn says that if she polled the next 10 people she passed on the street, 7 of them would be voting for Choo.
a) What assumption is Kathryn making?
b) Explain what the effect might be if the assumption were not true.
8. A DNA match was found between a blood sample and a suspect. A forensic scientist testifies that there is a 1 in 7000 chance the blood sample is from someone other than the suspect. Describe how two lawyers could use this statistic to support different positions.
9. An advertisement for acne treatment boasts: “4 out of 5 users notices improvements in two days.”
a) Explain how a teenager’s decision on whether to try this acne treatment could be based on probability and subjective judgment.
b) If the teenager does decide to try the acne treatment, what assumptions might he be making? For each assumption, explain how the predicted outcome of the treatment might change if the assumption changes.
Solution:
1. a) Experimental probability; decision is based on Andrei’s past experience.
b) Theoretical probability; the more tickets you buy, the greater your chance of winning.
c) Experimental probability; decision is based on Anita’s past experience. d) Subjective judgment; decision is based on Doug’s feelings.
2. a) Claudia will continue to perform at the same level and the next math quiz will have the same difficulty.
b) Omar will leave work at the same time and the traffic patterns will be the same every day.
3. If Winona doesn’t go canoeing, her decision will be based on probability (it is likely that it will rain). If she does go, her decision will be based on subjective judgment (the feeling that it will not rain).
4. Theoretical probability and subjective judgment
5. a) More money should be spent to increase the probability of recovering a stolen vehicle.
b) Because the probability of recovering a stolen vehicle is so low, there are better ways of spending money than on solving this problem.
6. a) Vanessa made the assumption that the same types of birds visit her birdfeeder at different times of the day, every day.
b) The percent of birds that are cardinals would change.
7. a) Kathryn assumes that the next 10 people she meets are a fair representation of the community
b) The next 10 people may favour one candidate very strongly over the other, making the number of those who support Choo greater than or less than 7.
8. Since there is such a small chance the blood was not the suspect’s, it is very likely the suspect committed the crime. There is a chance the blood belongs to someone else, so the jury should not convict a possibly innocent man.
9. a) The experimental probability may convince the teenager to try the treatment. He may also use subjective judgment about whether to try the treatment, depending on his personal beliefs of the effectiveness of acne treatment.
b) He would be assuming that he will respond to the treatment in a way that is similar to the response of other people who tried the treatment. His response to the treatment may differ from most people’s.
Outcome 4 Test
Complete the Essentials 1 Math: Data, Statistics and Probability Chapter Quiz on Brightspace.
