10 Forms and reports
Section Information
Outcome/Competency: Fill out forms and reports
Time to complete this section: 6h
Rationale:
Why is it important for you to learn this skill?
Being able to fill out forms and reports is integral to working as a Powerline Technician as you’ll often need to produce and understand hazards reports, and other reports and documents.
Objectives
To be competent in this area, the individual must be able to:
Fill out forms and reports as per relevant policies and regulations
Learning Goals
Interpret, scan, use and fill out relevant documents
Understand and apply reporting policies for hazards, injuries, and environmental impacts
Use the most appropriate device for reporting hazards, injuries, and environmental impacts
Introduction:
In this section you will learn about different forms, documents and hazard reports, and practice filling out some common forms that would be filled out by Powerline Technicians in Saskatchewan.
Objective One
Interpret, scan, use and fill out relevant documents
Topic 1: Logbooks (20m)
Logbooks
One of the most important forms you will fill out as a Powerline Technician are logbooks.
Logbooks can be used to record all kinds of important information, and often serve as a reference during troubleshooting or just to remember an interesting detail about a project that you worked on. We will go over the general types of information that can be recorded in a logbook and provide examples. These logbooks serve as record-keeping for both state-mandated forms, as well as being helpful for your own documentation of the work you have done.
Logbooks are an excellent way to keep track of what was done on a project. While it is possible to use other methods such as notebooks or loose sheets of paper, these can be misplaced or even thrown away by mistake.
After you have gotten used to recording information in logbooks and understand their importance, they will quickly become an indispensable part of your daily routine.
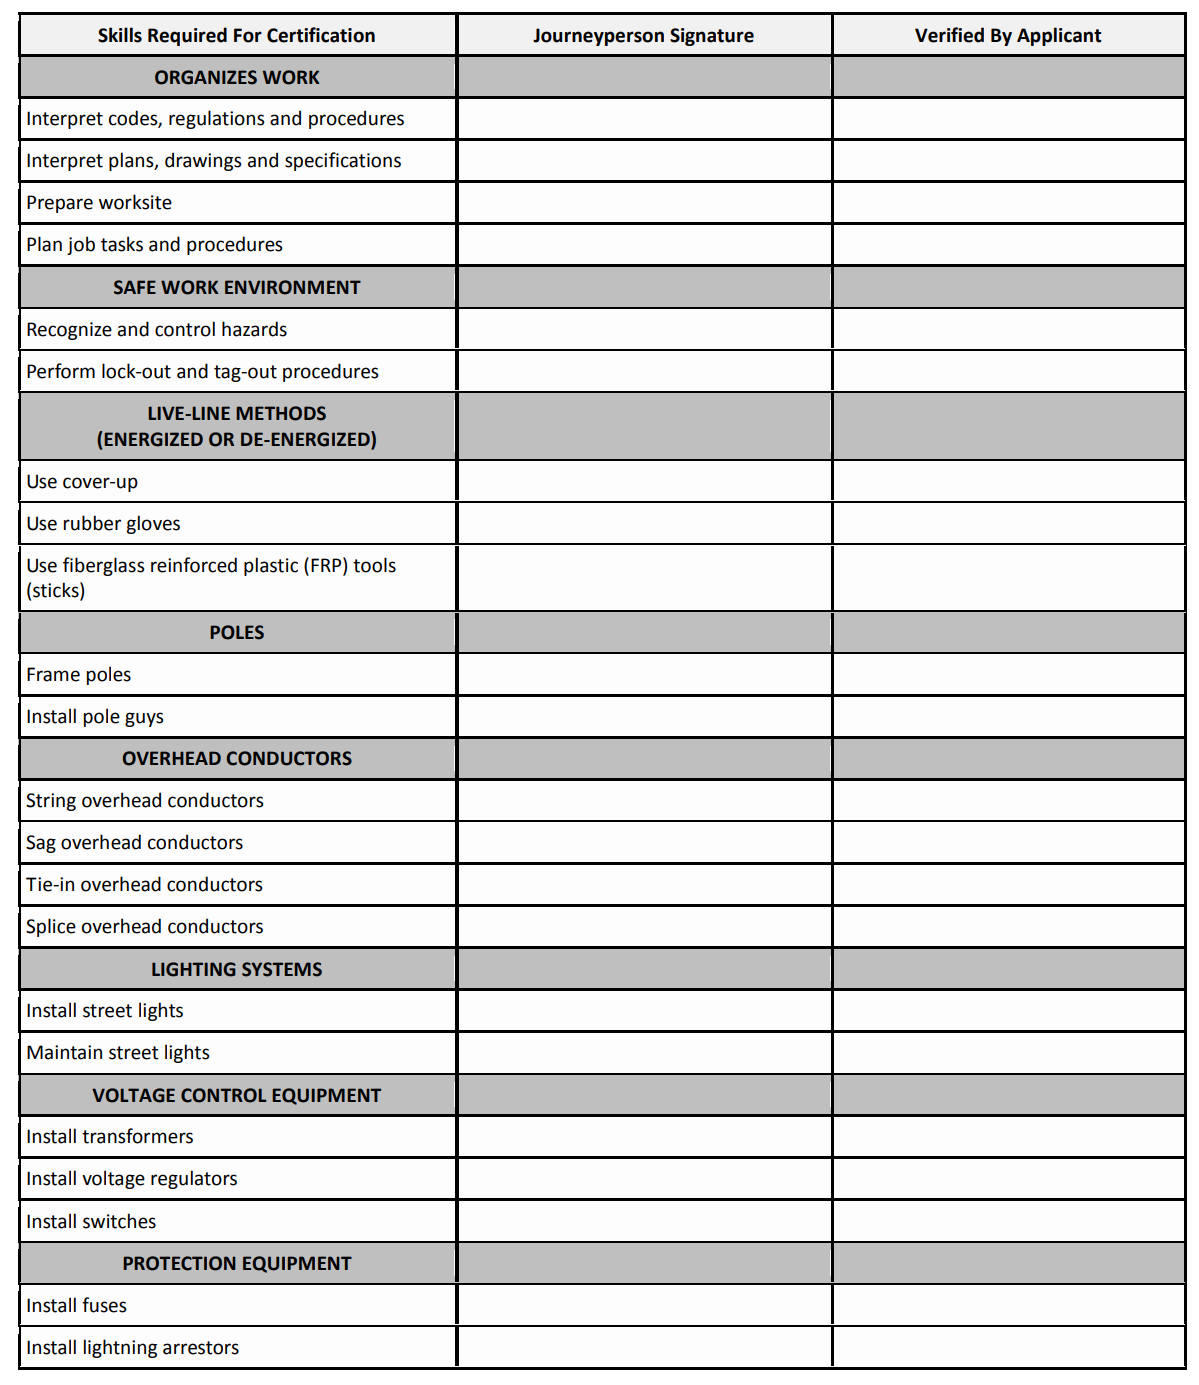
Apprenticeship Training Logbooks
Upon beginning an apprenticeship, apprentices will be given a training logbook which contains key skills and work methods required by apprentices to be successful at each level of their training.
When you have a clear understanding of the knowledge transfer requirement, your mentor will initial and date your logbook for that component of the logbook.
The training logbook then becomes both your official list of skills you need to learn, as well as your official record of learning.
For this reason, it’s imperative you keep it with you and in a safe place.
Training Logbook Sample
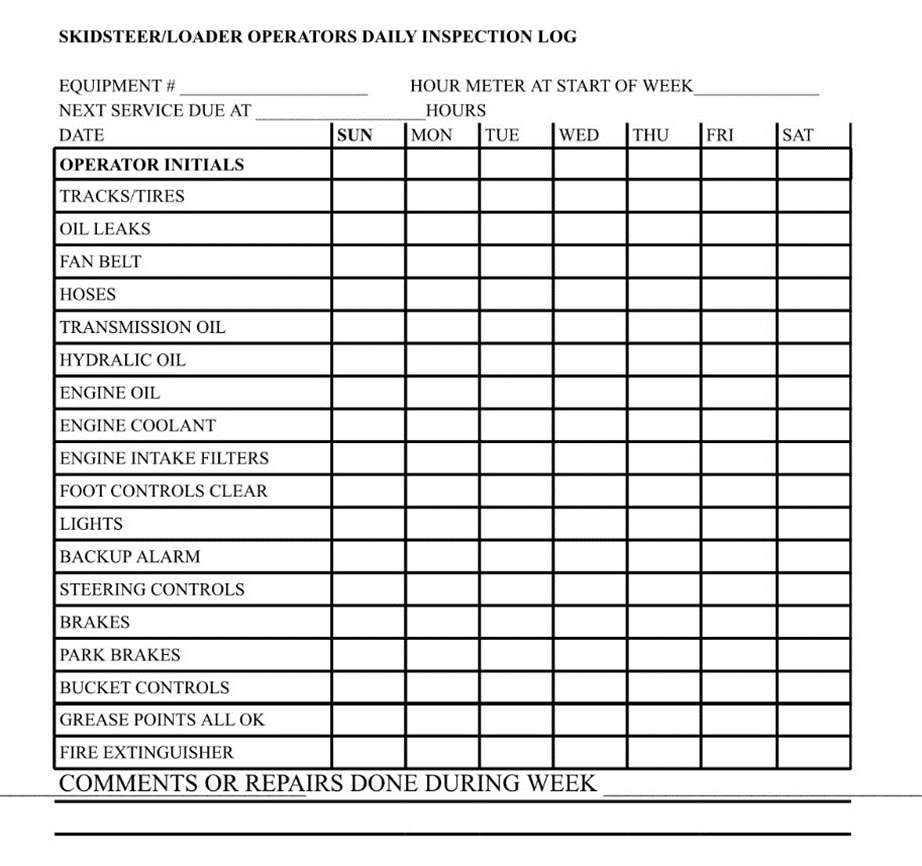
Inspection logbooks
Inspections are relatively simple tasks where you use a voltmeter or other device to test the safety and functionality of a building’s electrical system. Inspections are important because they help make sure that you can provide customers with a safe, efficient system when it comes time for them to use the wiring you installed.
Inspection logs usually contain information about what kind of inspection was performed on an equipment, where it was performed and what parts of the system were inspected. Most technicians also provide a little bit of information about their findings and the causes for any problems that needed to be addressed.
Inspection Logbook Example
Topic 2: Reading Charts and Graphs (40m)
Reading Charts and Graphs
A picture, so they say, will tell a thousand words. But what about a graph or chart?
A good graph or chart can show as much as several paragraphs of words. But how do you choose which style of graph to use?
This page sets out some of the basics behind drawing and creating good graphs and charts. By ‘good’, we mean ones that show what you want them to show, and don’t mislead the reader.
Types of Charts
There are several different types of charts and graphs. The four most common are probably line graphs, bar graphs and histograms, pie charts, and Cartesian graphs. They are generally used for, and are best for, quite different things.
You would use:
- Bar graphs to show numbers that are independent of each other. Example data might include things like the number of people who preferred each of Chinese takeaways, Indian takeaways and fish and chips.
- Pie charts to show you how a whole is divided into different parts. You might, for example, want to show how a budget had been spent on different items in a particular year.
- Line graphs show you how numbers have changed over time. They are used when you have data that are connected, and to show trends, for example, average night-time temperature in each month of the year.
- Cartesian graphs have numbers on both axes, which therefore allow you to show how changes in one thing affect another. These are widely used in mathematics, and particularly in algebra.
Axes
Graphs have two axes, the lines that run across the bottom and up the side. The line along the bottom is called the horizontal or x-axis, and the line up the side is called the vertical or y-axis.
The x-axis may contain categories or numbers. You read it from the bottom left of the graph.
The y-axis usually contains numbers, again starting from the bottom left of the graph.
The numbers on the y-axis generally, but not always, start at 0 in the bottom left of the graph, and move upwards. Usually, the axes of a graph are labelled to indicate the type of data they show.
Beware of graphs where the y-axis doesn’t start at 0, as they may be trying to fool you about the data shown (and there is more about this on our page, Everyday Mathematics).
Bar Graphs and Histograms
Bar graphs generally have categories on the x-axis, and numbers on the y-axis (but these are interchangeable). This means that you can compare numbers between different categories. The categories need to be independent, that is changes in one of them do not affect the others.
Here is a summary of ‘some data’ in a data table:
Category 14.1
Category 22.5
Category 33.5
Category 44.7
And the same data displayed in a bar chart:
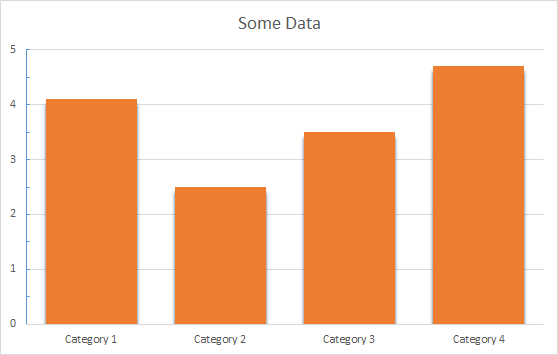
You can see immediately that this graph gives you a clear picture of which category is largest and which is smallest. It gives a clear comparison between categories.
You can also use the graph to read off information about how many are in each category without having to refer to the data table, which may or may not be provided with every graph you see.
In general, you can draw bar graphs with the bars either horizontal or vertical, because it doesn’t make any difference. The bars do not touch.
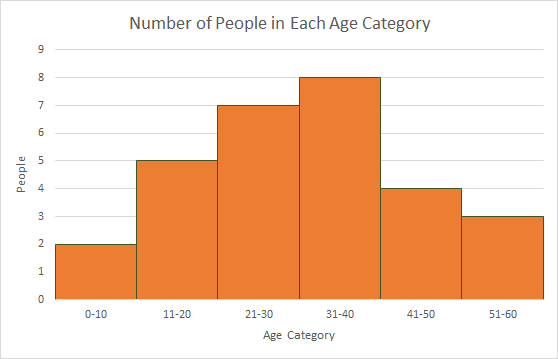
A histogram is a specific type of bar chart, where the categories are ranges of numbers. Histograms therefore show combined continuous data.
Histogram – Worked Example
You have been given a list of ages in years, and you need to show them in a graph.
The ages are:
5, 12, 23, 22, 28, 17, 11, 21, 25, 23, 7, 16, 13, 39, 35, 42, 24, 31, 35, 36, 35, 34, 37, 44, 51, 53, 46, 45, and 57.
You can choose to group them into ten-year age categories, 0–10, 11–20, 21–30 and so on:
Age Number of people
0-102
11-205
21-307
31-408
41-504
51-603
To show this data in a histogram, your x-axis would be numbered in 10s from 0 to your highest age, your y-axis from 0 to 8 (the highest number of people in any group), and there would be no gaps between the bars, because there are no gaps between the age ranges.
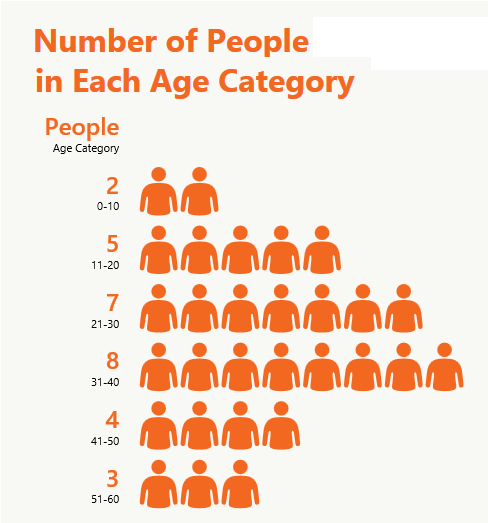
Pictograms
A pictogram is a special type of bar graph. Instead of using an axis with numbers, it uses pictures to represent a particular number of items. For example, you could use a pictogram for the data above about ages, with an image of a person to show the number of people in each category:
Pie Charts
A pie chart looks like a circle (or a pie) cut up into segments. Pie charts are used to show how the whole breaks down into parts.
For example, this data shows the sales figures for a year, broken down by quarters:
Quarterly Sales Figures
1st Qtr8.2
2nd Qtr3.2
3rd Qtr1.4
4th Qtr1.2
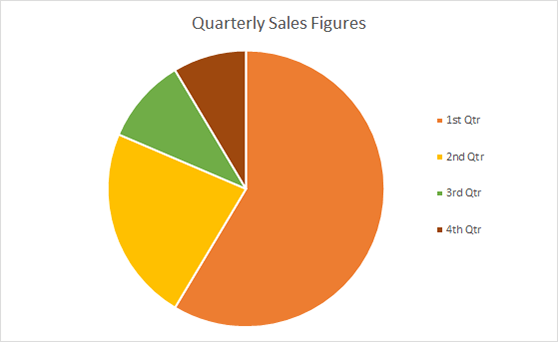
From the pie chart you can see immediately that sales in Quarter 1 were much bigger than all the others: more than 50% of total annual sales.
Quarter 2 was next, with around 25% of sales.
Without knowing anything more about this business, you might be concerned about the way that sales appeared to have dropped over the year.
Pie charts, unlike bar graphs, show dependent data.
The total sales in the year must have to have occurred in one quarter or another. If you’ve got the figures wrong, and Q1 should be smaller, one of the other quarters will have sales added to compensate, assuming that you haven’t made a mistake with the total.
Pie charts show percentages of a whole – your total is therefore 100% and the segments of the pie chart are proportionally sized to represent the percentage of the total.
Usually, it is not appropriate to use pie charts for more than 5 or 6 different categories. Lots of segments are difficult to visualise and such data may be better displayed on a different type of chart or graph.
Line Graphs
Line graphs are usually used to show dependent data, and particularly trends over time.
Line graphs depict a point value for each category, which are joined in a line. We can use the data from the pie chart as a line graph too.
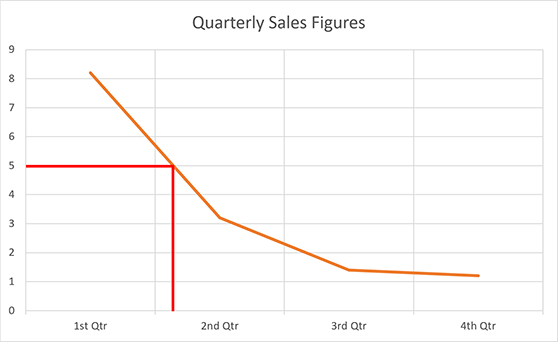
You can see even more obviously that sales have fallen rapidly over the year, although the slow down is levelling out at the end of the year. Line graphs are particularly useful for identifying the point in time at which a certain level of sales, revenue (or whatever the y value represents) was reached.
In the example above, suppose we want to know during which quarter sales first fell below 5. We can draw a line across from 5 on the y-axis (red line on the example) and see that it was during quarter 2.
Cartesian Graphs
Cartesian graphs are what mathematicians really mean when they talk about graphs. They compare two sets of numbers, one of which is plotted on the x-axis and one on the y-axis. The numbers can be written as Cartesian coordinates, which look like (x,y), where x is the number read from the x-axis, and y the number from the y-axis.
Warning– Cartesian graphs do not always start at 0; quite often (0,0) is the mid-point of the graph.
Cartesian Graph – Worked Example
John is two years older than Mary, and their ages added together equal 12. What age are they both now?
We can solve this by drawing two lines, one of John’s age compared with Mary’s, and one of the ages that add together to give 12.
Line 1: John’s (actual) age when Mary is different ages between 1 and 9
|
Mary’s Age
|
John’s Age (=Mary + 2)
|
|
1 |
3 |
|
2 |
4 |
|
3 |
5 |
|
4 |
6 |
|
5 |
7 |
|
6 |
8 |
|
7 |
9 |
|
8 |
10 |
|
9 |
11 |
Line 2: John’s (hypothetical) age when Mary is different ages between 1 and 9 if their ages add up to 12
|
Mary’s Age
|
John’s Age (=12 – Mary’s Age) |
|
1 |
11 |
|
2 |
10 |
|
3 |
9 |
|
4 |
8 |
|
5 |
7 |
|
6 |
6 |
|
7 |
5 |
|
8 |
4 |
|
9 |
3 |
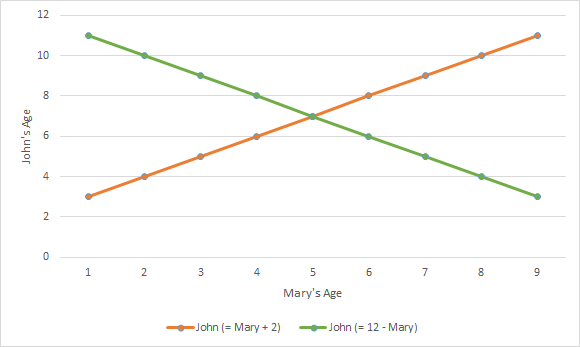
Cartesian graph example
Plotting the two lines on graph, with Mary’s age as the x-axis, you can see that there is a point at which the lines cross. This is the only point at which a) John is two years older than Mary and b) their ages add up to 12. This must be their current ages, which are therefore 5 for Mary and 7 for John.
Drawing Graphs using Computer Packages
You can use various computer software packages, including Word and Excel, to draw graphs.
Some packages are extremely capable when used effectively. However, be aware that some applications are rather limited in the type of charts that they can draw, and you may not find the results entirely what you expected! You really need a basic understanding of graphs and charts so that you can compare what the computer has created to what you want to show.
Computer applications also make it easy to produce overly complicated graphs. A 3D exploding pie chart may look ‘cool’ but does it help you or others to visualise the data? It is often best to keep graphs and charts simple with neat, clear formatting.
Read more at: https://www.skillsyouneed.com/num/graphs-charts.html
Objective Two
Understand and apply reporting policies for hazards, injuries, and environmental impacts
Topic 1: Hazard Reports (2.5h)
Content in this section is from pillars.worksafesask.ca
Hazard Assessments
A hazard is an activity, situation or substance that could cause harm. Risk is the chance that a hazard will cause harm. Hazard assessment is the process of identifying workplace hazards (both existing and potential), assessing the risk, implementing controls and reviewing to ensure hazards are eliminated or the risk minimized.
Hazard assessment is a proactive activity to improve health and safety. By identifying hazards and implementing controls, the workplace can prevent injuries and illnesses and the associated costs (both human and financial). Hazard assessment is an important foundation for other elements of a health and safety system, such as inspections, training, practices and procedures.
There are many methods to identify hazards. An important method is a job hazard analysis (JHA). JHA is the process of systematically evaluating a job, task, process or procedure to identify hazards and their associated risks, and then eliminating or reducing the risks to be as low as reasonably possible in order to protect workers from injury. Job hazard analysis is sometimes called job safety analysis or job task analysis. JHAs can be done through discussion and observation (example: using photos and videos).
Other methods to identify hazards include formal and informal hazard and risk assessment processes, inspections, field level risk assessments, hazard and risk assessments related to emergency procedures, procurement hazard and risk assessments.
It is very important to involve workers, especially those with experience, when conducting hazard assessments.
An employer should:
- Define hazard reporting processes
- Conduct hazard assessments
- Assess the risk of the identified hazards using a risk assessment methodology
- Implement controls to address identified hazards, focusing on hazards with the greatest risk first, considering:
- hierarchy of controls:
- elimination/substitution, engineering, administrative (including safe work practices/procedures and training), personal protective equipment (PPE) at the source, along the path, at the worker level regulatory and other established standards
- Follow up on hazard controls to ensure they:
-
- have been implemented as intended
- are effective; and
- have not created new hazards.
-
- Maintain records of completed hazard assessments
Steps to perform a job hazard analysis:
- Inventory occupations
- Inventory tasks for each of the occupations
- Prioritize and select tasks, considering:
- Risk
- Newly established tasks
- Modified tasks
- Infrequently performed tasks
- Break task into basic steps
- Identify all hazards present within each step
- Assess risk
- Identify controls
- Implement controls
- Reassess risk
- Communicate and provide training
What are examples of a hazard?
Workplace hazards can come from a wide range of sources. General examples include any substance, material, process, practice, etc. that has the ability to cause harm or adverse health effect to a person or property. See Table 1.
|
Table 1: Examples of Hazards and Their Effects |
||
|
Workplace Hazard |
Example of Hazard |
Example of Harm Caused |
|
Thing |
Knife |
Cut |
|
Substance |
Benzene |
Leukemia |
|
Material |
Mycobacterium tuberculosis |
Tuberculosis |
|
Source of Energy |
Electricity |
Shock, electrocution |
|
Condition |
Wet floor |
Slips, falls |
|
Process |
Welding |
Metal fume fever |
|
Practice |
Hard rock mining |
Silicosis |
|
Behaviour |
Bullying |
Anxiety, fear, depression |
Workplace hazards also include practices or conditions that release uncontrolled energy like:
- an object that could fall from a height (potential or gravitational energy),
- a run-away chemical reaction (chemical energy),
- the release of compressed gas or steam (pressure, high temperature),
- entanglement of hair or clothing in rotating equipment (kinetic energy), or
- contact with electrodes of a battery or capacitor (electrical energy).
|
HAZARD/CONCERN REPORT |
|||||
|
Location: |
|||||
|
PART 1 TO BE FILLED OUT BY THE WORKER |
|||||
|
Reported to: |
Date Reported: |
||||
|
Description of hazard/concern: Describe in detail and be specific (e.g., ice on front sidewalks, security procedures not followed after school hours, broken ladder in classroom 292). Use an additional sheet of paper if required. |
|||||
|
Corrective action taken: Describe what has been done already to eliminate this hazard or reduce the associated risk, by whom and date. |
|||||
|
Residual risk rating: See next page for matrix |
|||||
|
Solutions/corrective actions recommended: Describe in detail your ideas on how to eliminate this hazard or reduce associated risk. Use an additional sheet of paper if required. |
|||||
|
Part 1 Completed by: |
|||||
|
Name, Title and Phone Number (Please Print) |
Date |
Signature |
|||
|
|
|
|
|||
|
PART 2 TO BE FILLED OUT BY THE SUPERVISOR |
|||||
|
Corrective Actions Identified |
|||||
|
Corrective action/Control to be implemented |
Degree of risk |
Completion Target Date (YY/MM/DD) |
Date Completed (YY/MM/DD) |
Verified by (Signature) |
|
|
|
|
|
|
|
|
|
|
|
|
|
|
|
|
Part 2 Completed by: |
|||||
|
Name & Title (Please Print) |
Date |
Signature |
|||
|
|
|
|
|||
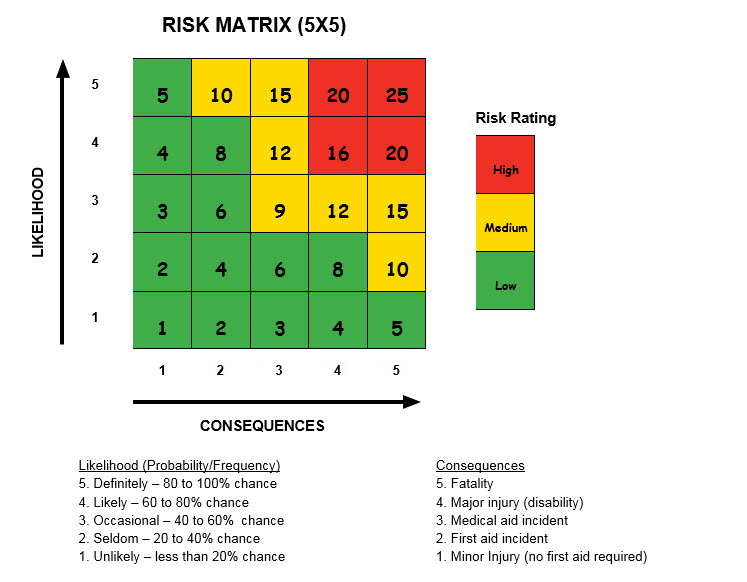
For each hazard, determine the frequency of the hazard. Next consider the potential consequence if something occurs. Using the risk matrix, determine the specific risk value (i.e., high, medium or low) of each hazard. Consider all factors that contribute to the degree of risk for each hazard presented to each group of workers. Consider the following factors to determine likelihood and potential consequences:
- How often is the task performed: multiple times a day, daily, once a week or once a year? The more frequent a task is performed the greater the likelihood or chance there is for something to go wrong.
- If something did go wrong, how severe could the consequences be? Would the incident result in only minor injury or could it result in a fatality?
Objective Three
Use the most appropriate device for reporting hazards, injuries and environmental impacts
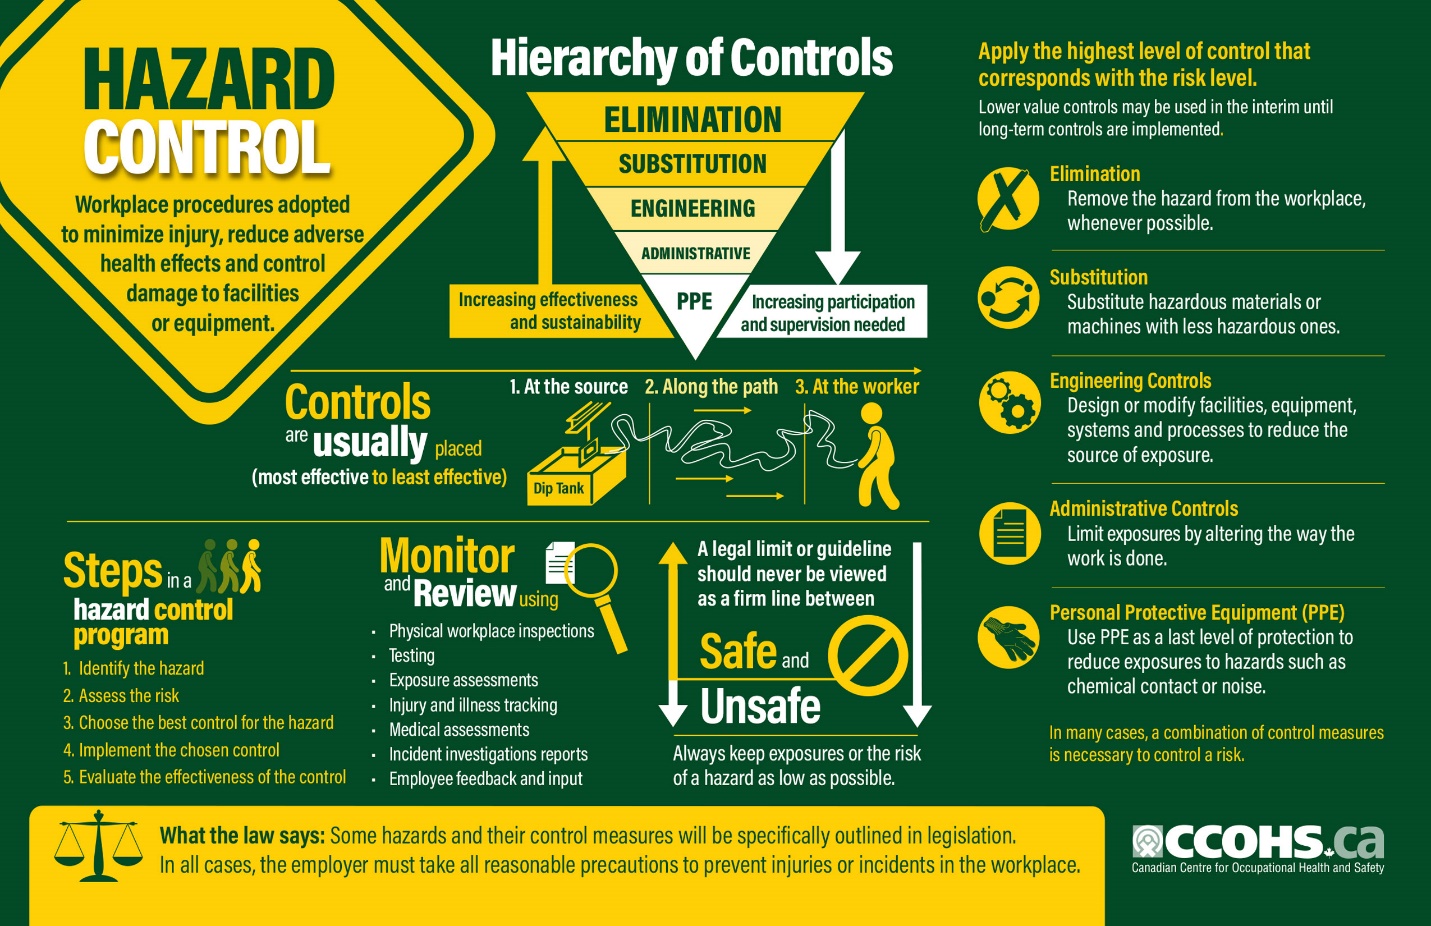
Topic 1: Hierarchy of Controls (30m)
Description
Every workplace has hazards, and while many are easy to avoid or have minor impact, there are many others which can lead to severe injury, damage, and loss.
A hazard control program can protect workers and reduce the occurrence of accidents, illnesses and injuries. It can also help to demonstrate due diligence, improve employee morale, and reduce overall operational costs.
This infographic illustrates the elements of a hazard control program, the hierarchy of controls, and the importance of monitoring and reviewing control systems to protect and keep workers safe. In order to decide the best way to report a hazard, you will need to do a risk assessment to discover if the hazard can be addressed by your team, whether you’ll need to involve your manager/boss, or whether it will require reporting to external bodies or regulators.
For example, if the hazard is a rope that is presenting a tripping hazard, it would be inappropriate to fill out a hazard report, when you could easily just relocate the rope. However, if there is a health and safety hazard such as an oil spill or live wire, you will require a formal report.
Topic 2: Risk Assessments (2h)
What is a risk assessment?
Risk assessment is a term used to describe the overall process or method where you:
- Identify hazards and risk factors that have the potential to cause harm (hazard identification).
- Analyze and evaluate the risk associated with that hazard (risk analysis, and risk evaluation).
- Determine appropriate ways to eliminate the hazard or control the risk when the hazard cannot be eliminated (risk control).
A risk assessment is a thorough look at your workplace to identify those things, situations, processes, etc. that may cause harm, particularly to people. After identification is made, you analyze and evaluate how likely and severe the risk is. When this determination is made, you can next, decide what measures should be in place to effectively eliminate or control the harm from happening.
The CSA Standard Z1002 “Occupational health and safety – Hazard identification and elimination and risk assessment and control” uses the following terms:
Risk assessment – the overall process of hazard identification, risk analysis, and risk evaluation.
Hazard identification – the process of finding, listing, and characterizing hazards.
Risk analysis – a process for comprehending the nature of hazards and determining the level of risk.
Notes:
- Risk analysis provides a basis for risk evaluation and decisions about risk control.
- Information can include current and historical data, theoretical analysis, informed opinions, and the concerns of stakeholders.
- Risk analysis includes risk estimation.
Risk evaluation – the process of comparing an estimated risk against given risk criteria to determine the significance of the risk.
Risk control – actions implementing risk evaluation decisions.
Note:
- Risk control can involve monitoring, re-evaluation, and compliance with decisions.
For definitions and more information about what hazards and risks are, please see the OSH Answers document “Hazard and Risk”.
Why is risk assessment important?
Risk assessments are very important as they form an integral part of an occupational health and safety management plan. They help to:
- Create awareness of hazards and risk.
- Identify who may be at risk (e.g., employees, cleaners, visitors, contractors, the public.
- Determine whether a control program is required for a particular hazard.
- Determine if existing control measures are adequate or if more should be done.
- Prevent injuries or illnesses, especially when done at the design or planning stage.
- Prioritize hazards and control measures.
- Meet legal requirements where applicable.
What is the goal of risk assessment?
The aim of the risk assessment process is to evaluate hazards, then remove that hazard or minimize the level of its risk by adding control measures, as necessary. By doing so, you have created a safer and healthier workplace.
- The goal is to try to answer the following questions:
- What can happen and under what circumstances?
- What are the possible consequences?
- How likely are the possible consequences to occur?
- Is the risk controlled effectively, or is further action required?
When should a risk assessment be done?
There may be many reasons a risk assessment is needed, including:
- Before new processes or activities are introduced.
- Before changes are introduced to existing processes or activities, including when products, machinery, tools, equipment change or new information concerning harm becomes available.
- When hazards are identified.
How do you plan for a risk assessment?
In general, determine:
- What the scope of your risk assessment will be (e.g., be specific about what you are assessing such as the lifetime of the product, the physical area where the work activity takes place, or the types of hazards).
- The resources needed (e.g., train a team of individuals to carry out the assessment, the types of information sources, etc.).
- What type of risk analysis measures will be used (e.g., how exact the scale or parameters need to be in order to provide the most relevant evaluation).
- Who are the stakeholders involved (e.g., manager, supervisors, workers, worker representatives, suppliers, etc.).
- What relevant laws, regulations, codes, or standards may apply in your jurisdiction, as well as organizational policies and procedures.
How is a risk assessment done?
Assessments should be done by a competent person or team of individuals who have a good working knowledge of the situation being studied. Include either on the team or as sources of information, the supervisors and workers who work with the process under review as these individuals are the most familiar with the operation.
In general, to do an assessment, you should:
- Identify hazards.
- Determine the likelihood of harm, such as an injury or illness occurring, and its severity.
- Consider normal operational situations as well as non-standard events such as maintenance, shutdowns, power outages, emergencies, extreme weather, etc.
- Review all available health and safety information about the hazard such as Safety Data Sheet (SDS), manufacturers literature, information from reputable organizations, results of testing, workplace inspection reports, records of workplace incidents (accidents), including information about the type and frequency of the occurrence, illnesses, injuries, near misses, etc.
- Understand the minimum legislated requirements for your jurisdiction.
- Identify actions necessary to eliminate the hazard, or control the risk using the hierarchy of risk control methods.
- Evaluate to confirm if the hazard has been eliminated or if the risk is appropriately controlled.
- Monitor to make sure the control continues to be effective.
- Keep any documents or records that may be necessary. Documentation may include detailing the process used to assess the risk, outlining any evaluations, or detailing how conclusions were made.
When doing an assessment, also take into account:
- The methods and procedures used in the processing, use, handling or storage of the substance, etc.
- The actual and the potential exposure of workers (e.g., how many workers may be exposed, what that exposure is/will be, and how often they will be exposed).
- The measures and procedures necessary to control such exposure by means of engineering controls, work practices, and hygiene practices and facilities.
- The duration and frequency of the task (how long and how often a task is done).
- The location where the task is done.
- The machinery, tools, materials, etc. that are used in the operation and how they are used (e.g., the physical state of a chemical, or lifting heavy loads for a distance).
- Any possible interactions with other activities in the area and if the task could affect others (e.g., cleaners, visitors, etc.).
- The lifecycle of the product, process or service (e.g., design, construction, uses, decommissioning).
- The education and training the workers have received.
- How a person would react in a particular situation (e.g., what would be the most common reaction by a person if the machine failed or malfunctioned).
It is important to remember that the assessment must take into account not only the current state of the workplace but any potential situations as well.
By determining the level of risk associated with the hazard, the employer, and the health and safety committee (where appropriate), can decide whether a control program is required and to what level.
How are the hazards identified?
Overall, the goal is to find and record possible hazards that may be present in your workplace. It may help to work as a team and include both people familiar with the work area, as well as people who are not – this way you have both the experienced and fresh eye to conduct the inspection. In either case, the person or team should be competent to carry out the assessment and have good knowledge about the hazard being assessed, any situations that might likely occur, and protective measures appropriate to that hazard or risk.
To be sure that all hazards are found:
- Look at all aspects of the work.
- Include non-routine activities such as maintenance, repair, or cleaning.
- Look at accident / incident / near-miss records.
- Include people who work off site either at home, on other job sites, drivers, teleworkers, with clients, etc.
- Look at the way the work is organized or done (include experience of people doing the work, systems being used, etc).
- Look at foreseeable unusual conditions (for example: possible impact on hazard control procedures that may be unavailable in an emergency situation, power outage, etc.).
- Determine whether a product, machine or equipment can be intentionally or unintentionally changed (e.g., a safety guard that could be removed).
- Review all of the phases of the lifecycle.
- Examine risks to visitors or the public.
- Consider the groups of people that may have a different level of risk such as young or inexperienced workers, persons with disabilities, or new or expectant mothers.
It may help to create a chart or table such as the following:
|
Example of Risk Assessment |
||||
|
Task |
Hazard |
Risk |
Priority |
Control |
|
Delivering product to customers |
Drivers work alone |
May be unable to call for help if needed |
|
|
|
Drivers have to occasionally work long hours |
Fatigue, short rest time between shifts |
|
|
|
|
Drivers are often in very congested traffic |
Increased chance of collision |
|
|
|
|
Longer working hours |
|
|
||
|
Drivers have to lift boxes when delivering product |
Injury to back from lifting, reaching, carrying, etc. |
|
|
|
How do you know if the hazard will cause harm (poses a risk)?
Each hazard should be studied to determine its’ level of risk. To research the hazard, you can look at:
- Product information / manufacturer documentation.
- Past experience (knowledge from workers, etc.).
- Legislated requirements and/or applicable standards.
- Industry codes of practice / best practices.
- Health and safety material about the hazard such as safety data sheets (SDSs), research studies, or other manufacturer information.
- Information from reputable organizations.
- Results of testing (atmospheric or air sampling of workplace, biological swabs, etc.).
- The expertise of an occupational health and safety professional.
- Information about previous injuries, illnesses, near misses, incident reports, etc.
- Observation of the process or task.
Remember to include factors that contribute to the level of risk such as:
- The work environment (layout, condition, etc.).
- The systems of work being used.
- The range of foreseeable conditions.
- The way the source may cause harm (e.g., inhalation, ingestion, etc.).
- How often and how much a person will be exposed.
- The interaction, capability, skill, experience of workers who do the work.
How are risks ranked or prioritized?
Ranking or prioritizing hazards is one way to help determine which risk is the most serious and thus which to control first. Priority is usually established by taking into account the employee exposure and the potential for incident, injury or illness. By assigning a priority to the risks, you are creating a ranking or an action list.
There is no one simple or single way to determine the level of risk. Nor will a single technique apply in all situations. The organization has to determine which technique will work best for each situation. Ranking hazards requires the knowledge of the workplace activities, urgency of situations, and most importantly, objective judgement.
For simple or less complex situations, an assessment can literally be a discussion or brainstorming session based on knowledge and experience. In some cases, checklists or a probability matrix can be helpful. For more complex situations, a team of knowledgeable personnel who are familiar with the work is usually necessary.
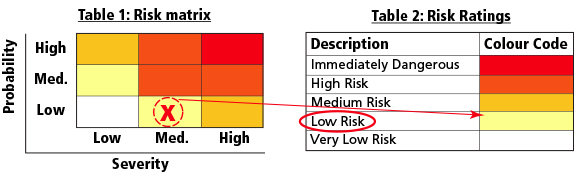
As an example, consider this simple risk matrix. Table 1 shows the relationship between probability and severity.
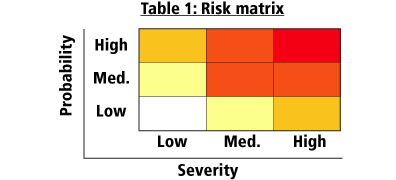
Severity ratings in this example represent:
- High: major fracture, poisoning, significant loss of blood, serious head injury, or fatal disease
- Medium: sprain, strain, localized burn, dermatitis, asthma, injury requiring days off work
- Low: an injury that requires first aid only; short-term pain, irritation, or dizziness
Probability ratings in this example represent:
- High: likely to be experienced once or twice a year by an individual
- Medium: may be experienced once every five years by an individual
- Low: may occur once during a working lifetime
The cells in Table 1 correspond to a risk level, as shown in Table 2.
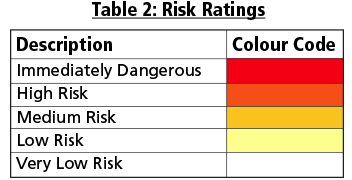
These risk ratings correspond to recommended actions such as:
- Immediately dangerous: stop the process and implement controls
- High risk: investigate the process and implement controls immediately
- Medium risk: keep the process going; however, a control plan must be developed and should be implemented as soon as possible
- Low risk: keep the process going but monitor regularly. A control plan should also be investigated
- Very low risk: keep monitoring the process
Let’s use an example: When painting a room, a step stool must be used to reach higher areas. The individual will not be standing higher than 1 metre (3 feet) at any time. The assessment team reviewed the situation and agreed that working from a step stool at 1 m is likely to:
- Cause a short-term injury such as a strain or sprain if the individual falls. A severe sprain may require days off work. This outcome is like a medium severity rating.
- Occur once in a working lifetime as painting is an uncommon activity for this organization. This criterion is like a low probability rating.
When compared to the risk matrix chart (Table 1), these values correspond to a low risk.
The workplace decides to implement risk control measures, including the use of a stool with a large top that will allow the individual to maintain stability when standing on the stool. They also determined that while the floor surface is flat, they provided training to the individual on the importance of making sure the stool’s legs always rest on the flat surface. The training also included steps to avoid excess reaching while painting.
What are methods of hazard control?
Once you have established the priorities, the organization can decide on ways to control each specific hazard. Hazard control methods are often grouped into the following categories:
- Elimination (including substitution).
- Engineering controls.
- Administrative controls.
- Personal protective equipment.
Why is it important to review and monitor the assessments?
It is important to know if your risk assessment was complete and accurate. It is also essential to be sure that any changes in the workplace have not introduced new hazards or changed hazards that were once ranked as lower priority to a higher priority.
It is good practice to review your assessment on a regular basis to make sure your control methods are effective.
What documentation should be done for a risk assessment?
Keeping records of your assessment and any control actions taken is very important. You may be required to store assessments for a specific number of years. Check for local requirements in your jurisdiction.
The level of documentation or record keeping will depend on:
- Level of risk involved.
- Legislated requirements.
- Requirements of any management systems that may be in place.
Your records should show that you:
- Conducted a good hazard review.
- Determined the risks of those hazards.
- Implemented control measures suitable for the risk.
- Reviewed and monitored all hazards in the workplace.
