Geographic Concepts
Before we can learn “how to do” a geographic information system (GIS), it is first necessary to review and reconsider a few key geographic concepts that are often taken for granted. For instance, what is a location, and how can it be defined? At what distance does a location become “nearby”? Or what do we mean when we say that someone has a “good sense of direction”? By answering these and related questions, we establish a framework that will help us to learn and to apply a GIS. This framework will also permit us to share and communicate geographic information with others, which can facilitate collaboration, problem-solving, and decision making.
Scale
When representing the Earth on a manageable-sized map, the actual size of the location is reduced. Scale is the ratio between the distance between two locations on a map and the corresponding distance on Earth’s surface. A 1:1000 scale map, for example, would mean that 1 meter on the map equals 1000 meters, or 1 kilometer, on Earth’s surface. Scale can sometimes be a confusing concept for students, so it is important to remember that it refers to a ratio. It does not refer to the size of the map itself, but rather, how zoomed in or out the map is. A 1:1 scale map of your room would be the same size of your room – plenty of room for significant detail, but hard to fit into a glove compartment.
As with map projections, the “best” scale for a map depends on what it is used for. If you are going on a walking tour of a historic town, a 1:5,000 scale map is commonly used. If you are a geography student looking at a map of the entire world, a 1:50,000,000 scale map would be appropriate. “Large” scale and “small” scale refer to the ratio, not to the size of the landmass on the map. 1 divided by 5,000 is 0.0002, which is a larger number than 1 divided by 50,000,000 (which is 0.00000002). Thus, a 1:5,000 scale map is considered “large” scale while 1:50,000,000 is considered “small” scale.
Location
The one concept that distinguishes geography from other fields is location, which is central to a GIS. Location is simply a position on the surface of the earth. What is more, nearly everything can be assigned a geographic location. Once we know the location of something, we can put it on a map, for example, with a GIS.
Generally, we tend to define and describe locations in nominal or absolute terms. In the case of the former, locations are simply defined and described by name. For example, city names such as New York, Tokyo, or London refer to nominal locations. Toponymy, or the study of place names and their respective history and meanings, is concerned with such nominal locations.
Though we tend to associate the notion of location with particular points on the surface of the earth, locations can also refer to geographic features (e.g., Rocky Mountains) or large areas (e.g., Siberia). The United States Board on Geographic Names maintains geographic naming standards and keeps track of such names through the Geographic Names Information Systems. The GNIS database also provides information about which state and county the feature is located as well as its geographic coordinates.
Contrasting nominal locations are absolute locations that use some type of reference system to define positions on the earth’s surface. For instance, defining a location on the surface of the earth using latitude and longitude is an example of absolute location. Postal codes and street addresses are other examples of absolute location that usually follow some form of local logic. Though there is no global standard when it comes to street addresses, we can determine the geographic coordinates (i.e., latitude and longitude) of particular street addresses, zip codes, place names, and other geographic data through a process called geocoding. There are several free online geocoders that return the latitude and longitude for various locations and addresses around the world.
With the advent of the global positioning system (GPS), determining the location of nearly any object on the surface of the earth is a relatively simple and straightforward exercise. GPS technology consists of a constellation of twenty-four satellites that are orbiting the earth and continuously transmitting time signals. To determine a position, earth-based GPS units (e.g., handheld devices, car navigation systems, mobile phones) receive the signals from at least three of these satellites and use this information to triangulate a location. All GPS units use the geographic coordinate system (GCS) to report location. Initially developed by the United States Department of Defense for military purposes, there is now a wide range of commercial and scientific uses of a GPS.
Location can also be defined in relative terms. Relative location refers to defining and describing places in relation to other known locations. For instance, Cairo, Egypt, is north of Johannesburg, South Africa; New Zealand is southeast of Australia; and Kabul, Afghanistan, is northwest of Lahore, Pakistan. Unlike nominal or absolute locations that define single points, relative locations provide a bit more information and situate one place in relation to another.
Direction
Like location, the concept of direction is central to geography and GIS. Direction refers to the position of something relative to something else, usually along a line. In order to determine direction, a reference point or benchmark from which direction will be measured needs to be established. One of the most common benchmarks used to determine direction is ourselves. Egocentric direction refers to when we use ourselves as a directional benchmark. Describing something as “to my left,” “behind me,” or “next to me” are examples of egocentric direction.
As the name suggests, landmark direction uses a known landmark or geographic feature as a benchmark to determine direction. Such landmarks may be a busy intersection of a city, a prominent point of interest like the Colosseum in Rome, or some other feature like a mountain range or river. The critical thing to remember about landmark direction, especially when providing directions, is that the landmark should be relatively well-known.
In geography and GIS, three more standard benchmarks are used to define the directions of true north, magnetic north, and grid north. True north is based on the point at which the axis of the earth’s rotation intersects the earth’s surface. In this respect, the North and South Poles serve as the geographic benchmarks for determining direction. Magnetic north (and south) refers to the point on the surface of the earth where the earth’s magnetic fields converge. This is also the point to which magnetic compasses point. Note that magnetic north falls somewhere in northern Canada and is not geographically coincident with true north or the North Pole. Grid north simply refers to the northward direction that the grid lines of latitude and longitude on a map, called a graticule, point to.
Distance
Complementing the concepts of location and direction is distance. Distance refers to the degree or amount of separation between locations and can be measured in nominal or absolute terms with various units. We can describe the distances between locations nominally as “large” or “small,” or we can describe two or more locations as “near” or “far apart.”
Calculating the distance between two locations on the surface of the earth can be quite involving because we are dealing with a three-dimensional object. Moving from the three-dimensional earth to two-dimensional maps on paper, computer screens, and mobile devices is not a trivial matter and is discussed in greater detail in a later chapter.
We also use a variety of units to measure distance. For instance, the distance between London and Singapore can be measured in miles, kilometers, flight time on a jumbo jet, or days on a cargo ship. Whether or not such distances make London and Singapore “near” or “far” from each other is a matter of opinion, experience, and patience. Hence the use of absolute distance metrics, such as that derived from the distance formula, provide a standardized method to measure how far away or how near locations are from each other.
Space
Where distance suggests a measurable quantity in terms of how far apart locations are situated, space is a more abstract concept that is more commonly described rather than measured. For example, space can be described as “empty,” “public,” or “private.”
Within the scope of a GIS, we are interested in space, and in particular, we are interested in what fills particular spaces and how and why things are distributed across space. In this sense, space is a somewhat ambiguous and generic term that is used to denote the general geographic area of interest.
One kind of space that is of particular relevance to a GIS is topological space. Simply put, topological space is concerned with the nature of relationships and the connectivity of locations within a given space. What is essential within topological space are (1) how locations are (or are not) related or connected, and (2) the rules that govern such geographic relationships.
Transportation maps such as those for subways provide some of the best illustrations of topological spaces. When using maps, we are primarily concerned with how to get from one stop to another along a transportation network. Specific rules also govern how we can travel along the network (e.g., transferring lines is possible only at a few key stops; we can travel only one direction on a particular line). Such maps may be of little use when traveling around a city by car or foot. However, they show the local transportation network and how locations are linked together effectively and efficiently.
Navigation
Transportation maps, like those discussed previously, illustrate how we move through the environments where we live, work, and play. This movement and, in particular, destination-oriented travel are generally referred to as navigation. How we navigate through space is a complex process that blends our various motor skills; technology, mental maps, and awareness of locations, distances, directions, and the space where we live. What is more, our geographical knowledge and spatial awareness are continuously updated and changed as we move from one location to another.
The acquisition of geographic knowledge is a lifelong endeavor. Though several factors influence the nature of such knowledge, we tend to rely on the three following types of geographic knowledge when navigating through space:
- Landmark knowledge refers to our ability to locate and identify unique points, patterns, or features (e.g., landmarks) in space.
- Route knowledge permits us to connect and travel between landmarks by moving through space.
- Survey knowledge enables us to understand where landmarks are concerning each other and to take shortcuts.
Each type of geographic knowledge is acquired in stages, one after the other. For instance, when we find ourselves in a new or unfamiliar location, we usually identify a few unique points of interest (e.g., hotel, building, fountain) to orient ourselves. We are, in essence, building up our landmark knowledge. Using and traveling between these landmarks develops our route knowledge and reinforces our landmark knowledge and our overall geographical awareness. Survey knowledge develops once we begin to understand how routes connect landmarks and how various locations are situated in space. It is at this point, when we are somewhat comfortable with our survey knowledge, that we can take shortcuts from one location to another. Though there is no guarantee that a shortcut will be successful, if we get lost, we are at least expanding our local geographic knowledge.
Landmark, route, and survey knowledge are the cornerstones of having a sense of direction and frame our geographical learning and awareness. While some would argue that they are born with a good sense of direction, others admit to always getting lost. The popularity of personal navigation devices and online mapping services speaks to the overwhelming desire to know and to situate where we are in the world. Though developing and maintaining a keen sense of direction presumably matters less and less as such devices and services continue to develop and spread, it can also be argued that the more we know about where we are in the world, the more we will want to learn about it.
This section covers concepts essential to geography, GIS, and many other fields of interest. Understanding how location, direction, and distance can be defined and described provides an essential foundation for the successful use and implementation of a GIS. Thinking about space and how we navigate through, it also serves to improve and own geographic knowledge and spatial awareness.
Understanding Maps
A map can be defined as a graphic representation of the real world. Because of the infinite nature of our Universe, it is impossible to capture all of the complexity found in the real world. For example, topographic maps abstract the three-dimensional real world at a reduced scale on a two-dimensional plane of paper.
Maps are used to display both cultural and physical features of the environment. Standard topographic maps show a variety of information including roads, land-use classification, elevation, rivers and other water bodies, political boundaries, and the identification of houses and other types of buildings. Some maps are created with particular goals in mind, with an intended purpose.
Most maps allow us to specify the location of points on the Earth’s surface using a coordinate system. For a two-dimensional map, this coordinate system can use simple geometric relationships between the perpendicular axes on a grid system to define spatial location. Two types of coordinate systems are currently in general use in geography: the geographical coordinate system and the rectangular (also called Cartesian) coordinate system.
Geographic Coordinate Systems
The geographic coordinate system measures location from only two values, despite the fact that the locations are described for a three-dimensional surface. The two values used to define location are both measured relative to the polar axis of the Earth. The two measures used in the geographic coordinate system are called latitude and longitude.

Latitude is an angular measurement north or south of the equator relative to a point found at the center of the Earth. This central point is also located on the Earth’s rotational or polar axis. The equator is the starting point for the measurement of latitude. The equator has a value of zero degrees. A line of latitude or parallel of 30° North has an angle that is 30° north of the plane represented by the equator. The maximum value that latitude can attain is either 90° North or South. These lines of latitude run parallel to the rotational axis of the Earth.
Lines connecting points of the same latitude, called parallels, has lines running parallel to each other. The only parallel that is also a great circle is the equator. All other parallels are small circles. The following are the most important parallel lines:
- Equator, 0 degrees
- Tropic of Cancer, 23.5 degrees N
- Tropic of Capricorn, 23.5 degrees S
- Arctic Circle, 66.5 degrees N
- Antarctic Circle, 66.5 degrees S
- North Pole, 90 degrees N (infinitely small circle)
- South Pole, 90 degrees S (infinitely small circle)
Longitude is the angular measurement east and west of the Prime Meridian. The position of the Prime Meridian was determined by international agreement to be in-line with the location of the former astronomical observatory at Greenwich, England. Because the Earth’s circumference is similar to a circle, it was decided to measure longitude in degrees. The number of degrees found in a circle is 360. The Prime Meridian has a value of zero degrees. A line of longitude or meridian of 45° West has an angle that is 45° west of the plane represented by the Prime Meridian. The maximum value that a meridian of longitude can have is 180° which is the distance halfway around a circle. This meridian is called the International Date Line. Designations of west and east are used to distinguish where a location is found relative to the Prime Meridian. For example, all of the locations in North America have a longitude that is designated west.
At 180 degrees of the Prime Meridian in the Pacific Ocean is the International Date Line. The line determines where the new day begins in the world. Now because of this, the International Date Line is not a straight line, rather it follows national borders so that a country is not divided into two separate days.
Ultimately, when parallel and meridian lines are combined, the result is a geographic grid system that allows users to determine their exact location on the planet.
Great and Small Circles
Much of Earth’s grid system is based on the location of the North Pole, South Pole, and the Equator. The poles are an imaginary line running from the axis of Earth’s rotation. The plane of the equator is an imaginary horizontal line that cuts the earth into two halves. This brings up the topic of great and small circles. A great circle is any circle that divides the earth into a circumference of two halves. It is also the largest circle that can be drawn on a sphere. The line connecting any points along a great circle is also the shortest distance between those two points.
Examples of great circles include the Equator, all lines of longitude, the line that divides the earth into day and night called the circle of illumination, and the plane of the ecliptic, which divides the earth into equal halves along the equator. Small circles are circles that cut the earth, but not into equal halves.
Time Zones
Before the late nineteenth century, timekeeping was primarily a local phenomenon. Each town would set their clocks according to the motions of the Sun. Noon was defined as the time when the Sun reached its maximum altitude above the horizon. Cities and towns would assign a clockmaker to calibrate a town clock to these solar motions. This town clock would then represent “official” time, and the citizens would set their watches and clocks accordingly.
The ladder half of the nineteenth century was a time of increased movement of humans. In the United States and Canada, large numbers of people were moving west and settlements in these areas began expanding rapidly. To support these new settlements, railroads moved people and resources between the various cities and towns. However, because of the nature of how local time was kept, the railroads experience significant problems in constructing timetables for the various stops. Timetables could only become more efficient if the towns and cities adopted some standard method of keeping time.
In 1878, Canadian Sir Sanford Fleming suggested a system of worldwide time zones that would simplify the keeping of time across the Earth. Fleming proposed that the globe should be divided into 24 time zones, every 15 degrees of longitude in width. Since the world rotates once every 24 hours on its axis and there are 360 degrees of longitude, each hour of Earth rotation represents 15 degrees of longitude.
Railroad companies in Canada and the United States began using Fleming’s time zones in 1883. In 1884, an International Prime Meridian Conference was held in Washington D.C. to adopt the standardized method of timekeeping and determined the location of the Prime Meridian. Conference members agreed that the longitude of Greenwich, England would become zero degrees longitude and established the 24 time zones relative to the Prime Meridian. It was also proposed that the measurement of time on the Earth would be made relative to the astronomical measurements at the Royal Observatory at Greenwich. This time standard was called Greenwich Mean Time (GMT).

Today, many nations operate on variations of the time zones suggested by Sir Fleming. In this system, time in the various zones is measured relative the Coordinated Universal Time (UTC) standard at the Prime Meridian. Coordinated Universal Time became the standard legal reference of time all over the world in 1972. UTC is determined from atomic clocks that are coordinated by the International Bureau of Weights and Measures (BIPM) located in France. The numbers located at the bottom of the time zone map indicate how many hours each zone is earlier (negative sign) or later (positive sign) than the Coordinated Universal Time standard. Also, note that national boundaries and political matters influence the shape of the time zone boundaries. For example, China uses a single time zone (eight hours ahead of Coordinated Universal Time) instead of five different time zones.
Coordinate Systems and Map Projections
Depicting the Earth’s three-dimensional surface on a two-dimensional map creates a variety of distortions that involve distance, area, and direction. It is possible to create maps that are somewhat equidistance. However, even these types of maps have some form of distance distortion. Equidistance maps can only control distortion along either lines of latitude or longitude. Distance is often correct on equidistance maps only in the direction of latitude.
On a map that has a large scale, 1:125,000 or larger, distance distortion is usually insignificant. An example of a large-scale map is a standard topographic map. On these maps measuring straight line distance is simple. Distance is first measured on the map using a ruler. This measurement is then converted into a real-world distance using the map’s scale. For example, if we measured a distance of 10 centimeters on a map that had a scale of 1:10,000, we would multiply 10 (distance) by 10,000 (scale). Thus, the actual distance in the real world would be 100,000 centimeters.
Measuring distance along map features that are not straight is a little more difficult. One technique that can be employed for this task is to use several straight-line segments. The accuracy of this method is dependent on the number of straight-line segments used. Another method for measuring curvilinear map distances is to use a mechanical device called an opisometer. This device uses a small rotating wheel that records the distance traveled. The recorded distance is measured by this device either in centimeters or inches.
Mapping Our World
Have you ever found driving directions and maps online, used a smartphone to ‘check-in’ to your favorite restaurant, or entered a town name or zip code to retrieve the local weather forecast?
Every time you and millions of other users perform these tasks, you are making use of Geographic Information Science (GIScience) and related spatial technologies. Many of these technologies, such as Global Positioning Systems (GPS) and in-vehicle navigation units, are very well-known, and you can probably recall the last time you have used them.
Other applications and services that are the products of GIScience are a little less obvious, but they are every bit as common. If you are connected to the Internet, you are making use of geospatial technologies right now. Every time your browser requests a web page from a Content Delivery Network (CDN), a geographic lookup occurs and the server you are connected to contacts other servers that are closest to it and retrieves the information. This happens so that the delay between your request to view the data and the data being sent to you is as short as possible.
GIScience and the related technologies are everywhere, and we use them every day. When it comes to information, “spatial is special.” Reliance on spatial attributes is what separates geographic information from other types of information. There are several distinguishing properties of geographic information. Understanding them, and their implications for the practice of geographic information science is a key utilizing geographic data.
- Geographic data represent spatial locations and non-spatial attributes measured at certain times.
- Geographic space is continuous.
- Geographic space is nearly spherical.
- Geographic data tend to be spatially dependent.
Spatial attributes tell us where things are, or where things were at the time the data were collected. By merely including spatial attributes, geographic data allow us to ask a plethora of geographic questions. For example, we might ask, “are gas prices in Puyallup high?” The interactive map from GasBuddy.com can help us with such a question while enabling us to generate many other spatial inquiries related to the geographic variation in fuel prices.
Another essential characteristic of geographic space is that it is “continuous.” Although the Earth has valleys, canyons, caves, oceans, and more, there are no places on Earth without a location, and connections exist from one place to another. Outside of science fiction, there are no tears in the fabric of space-time. Modern technology can measure location very precisely, making it possible to generate incredibly detailed depictions of geographic feature location (e.g., of the coastline of the eastern U.S). It is often possible to measure so precisely that we collect more location data than we can store and much more than is useful for practical applications. How much information is useful to store or to display in a map will depend on the map scale (how much of the world we represent within a fixed display such as the size of your computer screen) as well as on the map’s purpose.
In addition to being continuous, geographic data also tend to be spatially dependent. More simply, “everything is related to everything else, but near things are more related than distant things” (which leads to an expectation that things that are near to one another tend to be more alike than things that are far apart). How alike things are in relation to their proximity to other things can be measured by a statistical calculation known as spatial autocorrelation. Without this fundamental property, geographic information science as we know it today would not be possible.
Geographic data comes in many types, from many different sources and captured using many techniques; they are collected, sold, and distributed by a wide array of public and private entities. In general, we can divide the collection of geographic data into two main types:
- Directly collected data
- Remotely sensed data
Directly collected data are generated at the source of the phenomena being measured. Examples of directly collected data include measurements such as temperature readings at specific weather stations, elevations recorded by visiting the location of interest, or the position of a grizzly bear equipped with a GPS-enabled collar. Also, included here are data derived from surveys (e.g., the census) or observation (e.g., Audubon Christmas bird count).
Remotely sensed data are measured from remote distances without any direct contact with the phenomena or need to visit the locations of interest. Satellite images, sonar readings, and radar are all forms of remotely sensed data.
Maps are both the raw material and the product of geographic information systems (GIS). All maps represent features and characteristics of locations, and that representation depends upon data relevant at a particular time. All maps are also selective; they do not show us everything about the place depicted; they show only the particular features and characteristics that their maker decided to include. Maps are often categorized into reference or thematic maps based upon the producer’s decision about what to include and the expectations about how the map will be used. The prototypical reference map depicts the location of “things” that are usually visible in the world; examples include road maps and topographic maps depicting terrain.
Thematic maps, in contrast, typically depict “themes.” They generally are more abstract, involving more processing and interpretation of data, and often depict concepts that are not directly visible; examples include maps of income, health, climate, or ecological diversity. There is no clear-cut line between reference and thematic maps, but the categories are useful to recognize because they relate directly to how the maps are intended to be used and to decisions that their cartographers have made in the process of shrinking and abstracting aspects of the world to generate the map. Different types of thematic maps include:
- choropleth – a thematic map that uses tones or colors to represent spatial data as average values per unit area
- proportional symbol – uses symbols of different sizes to represent data associated with different areas or locations within the map
- isopleth– also known as contour maps or isopleth maps depict smooth continuous phenomena such as precipitation or elevation
- dot – uses a dot symbol to show the presence of a feature or phenomenon – dot maps rely on a visual scatter to show a spatial pattern
- dasymetric – an alternative to a choropleth map but instead of mapping the data so that the region appears uniform, ancillary information is used to model the internal distribution of the data
Geospatial Technology
Suppose that you have launched a new business that manufactures solar-powered lawnmowers. You are planning a mail campaign to bring this revolutionary new product to the attention of prospective buyers. However, since it is a small business, you cannot afford to sponsor coast-to-coast television commercials or to send brochures by mail to more than 100 million U.S. households. Instead, you plan to target the most likely customers – those who are environmentally conscious, have higher than average family incomes, and who live in areas where there are enough water and the sunshine to support lawns and solar power.
Fortunately, lots of data are available to help you define your mailing list. Household incomes are routinely reported to banks and other financial institutions when families apply for mortgages, loans, and credit cards. Personal tastes related to issues like the environment are reflected in behaviors such as magazine subscriptions and credit card purchases. Market research companies collect such data and transform it into information by creating “lifestyle segments” – categories of households that have similar incomes and tastes. Your solar lawnmower company can purchase lifestyle segment information by 5-digit ZIP code, or even by ZIP+4 codes, which designate individual households.
Geographic Information Systems
It is astonishing how valuable information from the millions upon millions of transactions that are recorded every day. The fact that lifestyle information products are often delivered by geographic areas, such as ZIP codes, speaks to the appeal of geographic information systems (GIS). The scale of these data and their potential applications are increasing continually with the advent of new mechanisms for sharing information and making purchases that are linked to our GPS-enabled smartphones. A Geographical Information System (GIS) is a computer-based tool used to help people transform geographic data into geographic information.
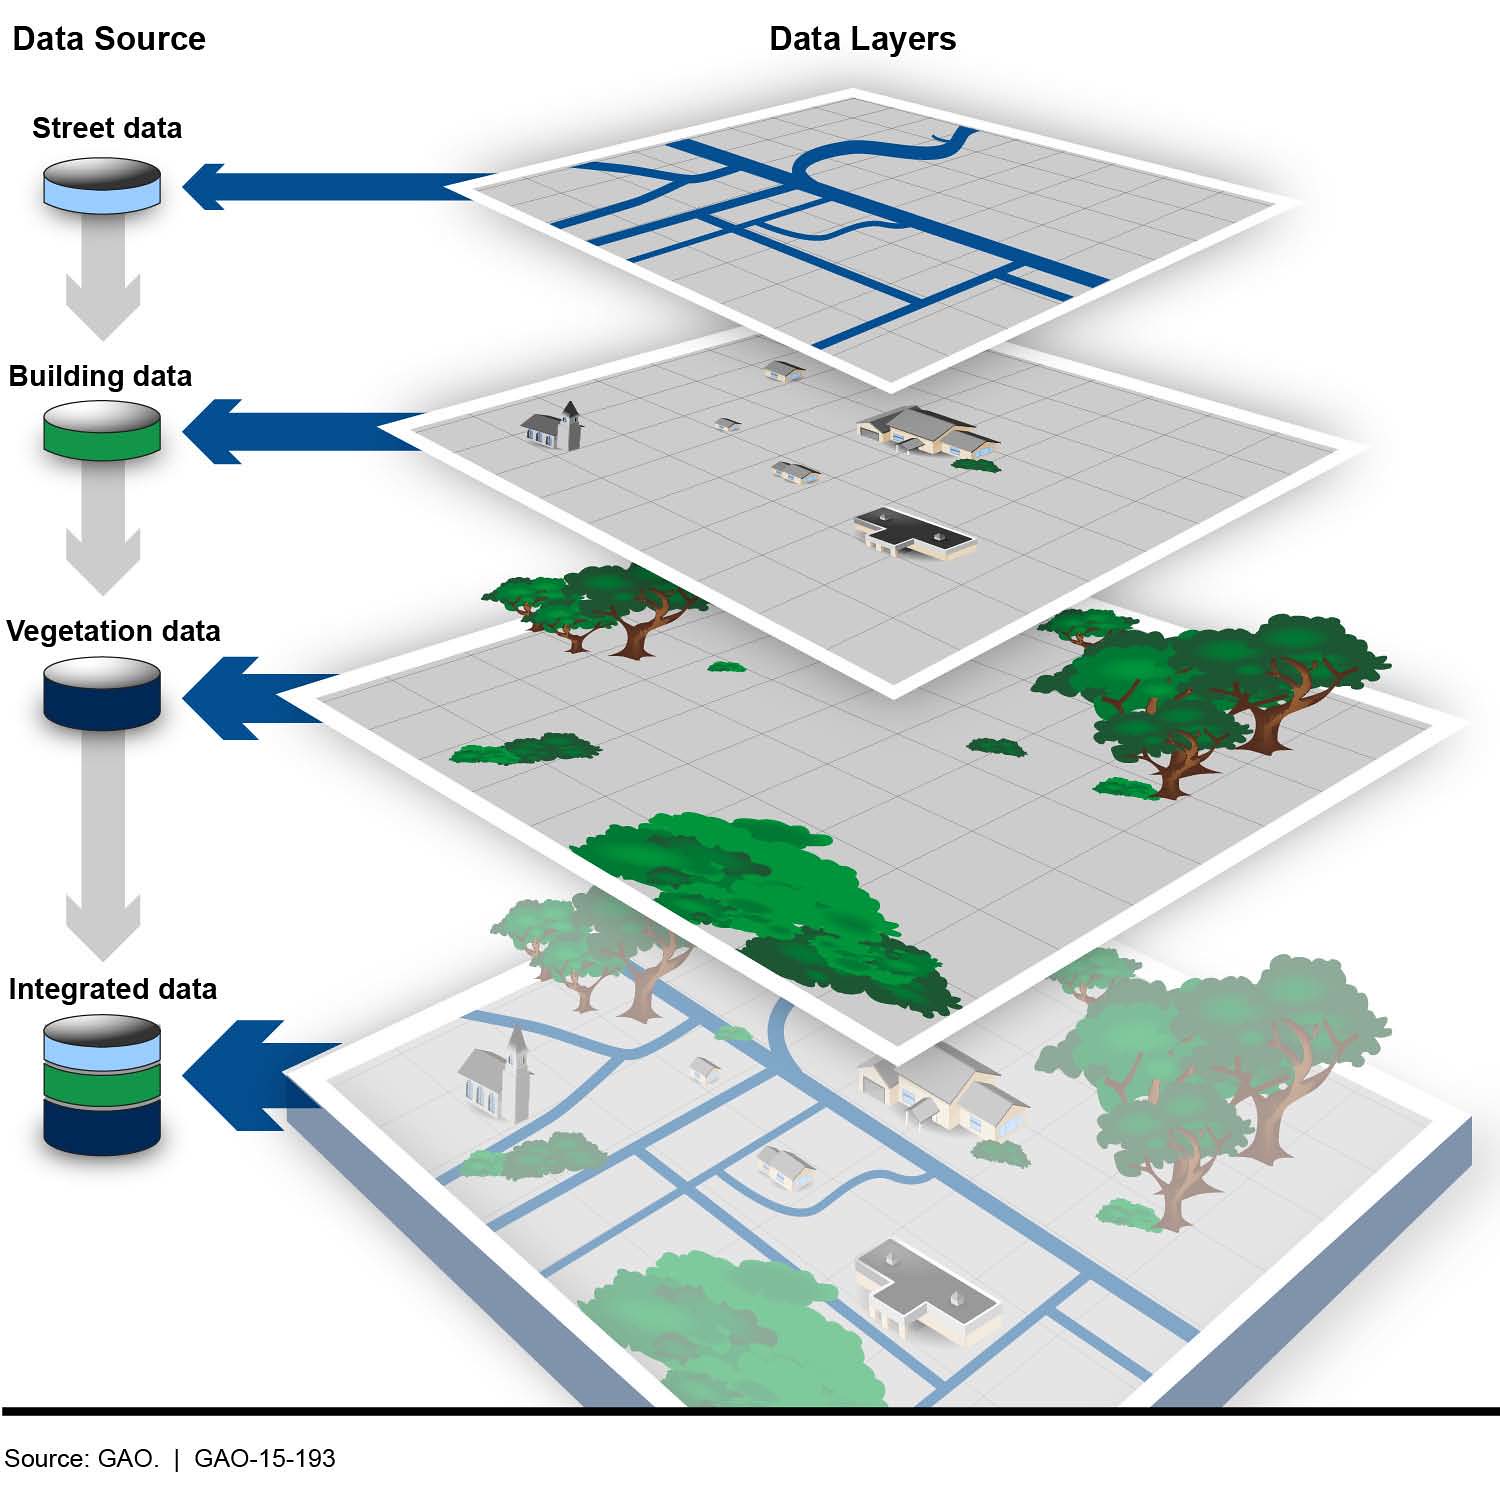
GIS arose out of the need to perform spatial queries on geographic data (questions addressed to a database such as wanting to know a distance or the location where two objects intersect). A spatial query requires knowledge of locations as well as attributes about that location. For example, an environmental analyst might want to know which public drinking water sources are located within one mile of a known toxic chemical spill. Alternatively, a planner might be called upon to identify property parcels located in areas that are subject to flooding.
Numerous tools exist to help users perform database management operations. Microsoft Excel and Access allow users to retrieve specific records, manipulate the records, and create new user content. ESRI’s ArcGIS allows users to organize and manipulate files, but also map the geographic database files in order to find interesting spatial patterns and processes in graphic form.
Global Positioning Sytems
The use of location-based technologies has reached unprecedented levels. Location- enabled devices, giving us access to a wide variety of LBSs, permeate our households and can be found in almost every mall, office, and vehicle. From digital cameras and mobile phones to in-vehicle navigation units and microchips in our pets, millions of people and countless devices have access to the Global Positioning System (GPS). Most of us have some basic idea of what GPS is, but just what is it, exactly, that we are all connected to?

The Global Positioning System (GPS) is a satellite-based navigation system made up of a network of 24 satellites placed into orbit by the U.S. Department of Defense. GPS was originally intended for military applications, but in the 1980s, the government made the system available for civilian use. GPS works in any weather conditions, anywhere in the world, 24 hours a day.
In a nutshell, GPS works like this: satellites circle the Earth twice a day in a very and transmit a signal to Earth. GPS receivers (or smartphones and watches) take this information and use trilateration to calculate the user’s exact location. Now, with distance measurements from a few satellites, the receiver can determine the user’s position and display it on the unit’s electronic map.
Using GPS to determine your location is not very useful if you do not know about the landscape around you. For instance, your GPS could tell you that you are in the mall, but without a map, you may not know how to get to the door. There are many stories of people whose maps were out of date, and they followed their GPS into a river or a lake. Remote sensing allows mapmakers to collect physical data from a distance without visiting or interacting directly with the location.
Remote Sensing
The distance between the object and observer can be considerable, for example, imaging from the Hubble telescope, or rather small, as is the case in the use of microscopes for examining bacterial growth. In geography, the term remote sensing takes on a specific connotation dealing with space-borne and aerial imaging systems used to remotely sense electromagnetic radiation reflected and emitted from Earth’s surface.

Remote sensing systems work in much the same way as a desktop scanner connected to a personal computer. A desktop scanner creates a digital image of a document by recording, pixel by pixel, the intensity of light reflected from the document. Color scanners may have three light sources and three sets of sensors, one each for the blue, green, and red wavelengths of visible light. Remotely sensed data, like the images produced by a desktop scanner, consist of reflectance values arrayed in rows and columns that make up raster grids.
Remote sensing is used to solve a host of problems across a wide variety of disciplines. For example, Landsat imagery is used to monitor plant health and foliar changes. In contrast, imagery such as that produced by IKONOS is used for geospatial intelligence applications (yes, that means spying) and monitoring urban infrastructure. Other satellites, such as AVHRR (Advanced High-Resolution Radiometer), are used to monitor the effects of global warming on vegetation patterns on a global scale. The MODIS (Moderate Resolution Imaging Spectroradiometer) Terra and Aqua sensors are designed to monitor atmospheric and oceanic composition in addition to the typical terrestrial applications.
