3.5.1 – Finding Equations of Exponential Functions
In the previous chapter, we were given an exponential function, which we then evaluated for a specific input. Sometimes we are given information about an exponential function without having an explicit formula for the function. We must use the information to first write the form of the function, then determine the constants [latex]\,a\,[/latex] and [latex]\,b,[/latex] and evaluate the function.
How To
Given two data points, write an exponential model.
- If one of the data points has the form [latex]\,\left(0,a\right),[/latex] then [latex]\,a\,[/latex] is the initial value. Using [latex]\,a,[/latex] substitute the second point into the equation [latex]\,f\left(x\right)=a{\left(b\right)}^{x},[/latex] and solve for [latex]\,b.[/latex]
- If neither of the data points have the form [latex]\,\left(0,a\right),[/latex] substitute both points into two equations with the form [latex]\,f\left(x\right)=a{\left(b\right)}^{x}.\,[/latex] Solve the resulting system of two equations in two unknowns to find [latex]\,a\,[/latex] and [latex]\,b.[/latex]
- Using the [latex]\,a\,[/latex] and [latex]\,b\,[/latex] found in the steps above, write the exponential function in the form [latex]\,f\left(x\right)=a{\left(b\right)}^{x}.[/latex]
Example 1 – Writing an Exponential Model When the Initial Value Is Known
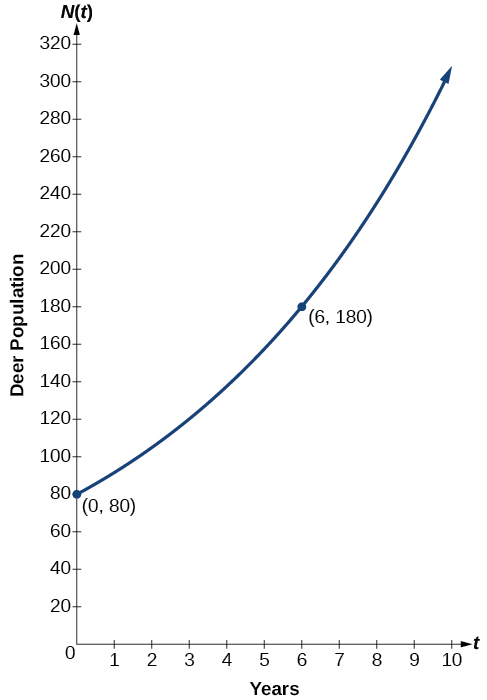
In 2006, 80 deer were introduced into a wildlife refuge. By 2012, the population had grown to 180 deer. The population was growing exponentially. Write an algebraic function [latex]\,N\left(t\right)\,[/latex] representing the population [latex]\,\left(N\right)\,[/latex] of deer over time [latex]\,t.[/latex]
We let our independent variable [latex]\,t\,[/latex] be the number of years after 2006. Thus, the information given in the problem can be written as input-output pairs: (0, 80) and (6, 180). Notice that by choosing our input variable to be measured as years after 2006, we have given ourselves the initial value for the function, [latex]\,a=80.\,[/latex] We can now substitute the second point into the equation [latex]\,N\left(t\right)=80{b}^{t}\,[/latex] to find [latex]\,b:[/latex]
[latex]$$\begin{array}{lll}N\left(t\right)\hfill & =80{b}^{t}\hfill & \hfill \\ \,\,180\hfill & =80{b}^{6}\hfill & \text{Substitute using point }\left(6, 180\right).\hfill \\ \,\,\,\,\,\frac{9}{4}\hfill & ={b}^{6}\hfill & \text{Divide and write in lowest terms}.\hfill \\ \,\,\,\,\,\,\,\,b\hfill & ={\left(\frac{9}{4}\right)}^{\frac{1}{6}}\hfill & \text{Isolate }b\text{ using properties of exponents}.\hfill \\ \,\,\,\,\,\,\,\,b\hfill & \approx 1.1447\begin{array}{cccc}& & & \end{array}\hfill & \text{Round to 4 decimal places}.\hfill \end{array}$$[/latex]
NOTE:Unless otherwise stated, do not round any intermediate calculations. Then round the final answer to four places for the remainder of this section.
The exponential model for the population of deer is [latex]\,N\left(t\right)=80{\left(1.1447\right)}^{t}.\,[/latex] (Note that this exponential function models short-term growth. As the inputs gets large, the output will get increasingly larger, so much so that the model may not be useful in the long term.)
We can graph our model to observe the population growth of deer in the refuge over time. Notice that the graph in Figure 3 passes through the initial points given in the problem, [latex]\,\left(0,\text{ 8}0\right)\,[/latex] and [latex]\,\left(\text{6},\text{ 18}0\right).\,[/latex] We can also see that the domain for the function is [latex]\,\left[0,\infty \right),[/latex] and the range for the function is [latex]\,\left[80,\infty \right).[/latex]
Try It
A wolf population is growing exponentially. In 2011, [latex]\,129\,[/latex] wolves were counted. By [latex]\,\text{2013,}\,[/latex] the population had reached 236 wolves. What two points can be used to derive an exponential equation modeling this situation? Write the equation representing the population [latex]\,N\,[/latex] of wolves over time [latex]\,t.[/latex]
Show answer
[latex]\left(0,129\right)\,[/latex] and [latex]\,\left(2,236\right);\,\,\,N\left(t\right)=129{\left(\text{1}\text{.3526}\right)}^{t}[/latex]
Example 2 – Writing an Exponential Model When the Initial Value is Not Known
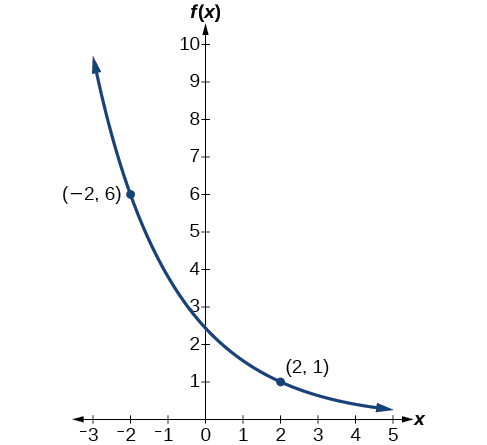
Find an exponential function that passes through the points [latex]\,\left(-2,6\right)\,[/latex] and [latex]\,\left(2,1\right).[/latex]
Because we don’t have the initial value, we substitute both points into an equation of the form [latex]\,f\left(x\right)=a{b}^{x},[/latex] and then solve the system for [latex]\,a\,[/latex] and [latex]\,b.[/latex]
- Substituting [latex]\,\left(-2,6\right)\,[/latex] gives [latex]\,6=a{b}^{-2}\,[/latex]
- Substituting [latex]\,\left(2,1\right)\,[/latex] gives [latex]\,1=a{b}^{2}\,[/latex]
Use the first equation to solve for [latex]\,a\,[/latex] in terms of [latex]\,b:[/latex]
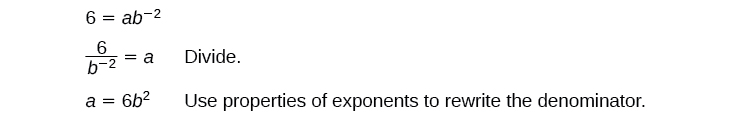
Substitute [latex]\,a\,[/latex] in the second equation, and solve for [latex]\,b:[/latex]
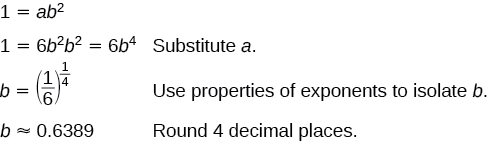
Use the value of [latex]\,b\,[/latex] in the first equation to solve for the value of [latex]\,a:[/latex] 
Thus, the equation is [latex]\,f\left(x\right)=2.4492{\left(0.6389\right)}^{x}.[/latex]
We can graph our model to check our work. Notice that the graph in Figure 4 passes through the initial points given in the problem, [latex]\,\left(-2,\text{ 6}\right)\,[/latex] and [latex]\,\left(2,\text{ 1}\right).\,[/latex] The graph is an example of an exponential decay function.
Try It
Given the two points [latex]\,\left(1,3\right)\,[/latex] and [latex]\,\left(2,4.5\right),[/latex] find the equation of the exponential function that passes through these two points.
Show answer
[latex]f\left(x\right)=2{\left(1.5\right)}^{x}[/latex]
Do two points always determine a unique exponential function?
Yes, provided the two points are either both above the x-axis or both below the x-axis and have different x-coordinates. But keep in mind that we also need to know that the graph is, in fact, an exponential function. Not every graph that looks exponential really is exponential. We need to know the graph is based on a model that shows the same percent growth with each unit increase in [latex]\,x,[/latex] which in many real world cases involves time.
How To
Given the graph of an exponential function, write its equation.
- First, identify two points on the graph. Choose the y-intercept as one of the two points whenever possible. Try to choose points that are as far apart as possible to reduce round-off error.
- If one of the data points is the y-intercept [latex]\,\left(0,a\right)[/latex] , then [latex]\,a\,[/latex] is the initial value. Using [latex]\,a,[/latex] substitute the second point into the equation [latex]\,f\left(x\right)=a{\left(b\right)}^{x},[/latex] and solve for [latex]\,b.[/latex]
- If neither of the data points have the form [latex]\,\left(0,a\right),[/latex] substitute both points into two equations with the form [latex]\,f\left(x\right)=a{\left(b\right)}^{x}.\,[/latex] Solve the resulting system of two equations in two unknowns to find [latex]\,a\,[/latex] and [latex]\,b.[/latex]
- Write the exponential function, [latex]\,f\left(x\right)=a{\left(b\right)}^{x}.[/latex]
Example 3 – Writing an Exponential Function Given Its Graph
Find an equation for the exponential function graphed in Figure 5.
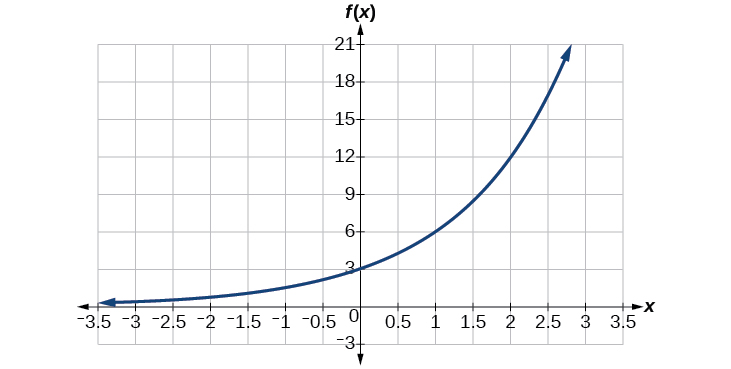
We can choose the y-intercept of the graph, [latex]\,\left(0,3\right),[/latex] as our first point. This gives us the initial value, [latex]\,a=3.\,[/latex] Next, choose a point on the curve some distance away from [latex]\,\left(0,3\right)\,[/latex] that has integer coordinates. One such point is [latex]\,\left(2,12\right).[/latex]
[latex]$$\begin{array}{ll}\text{ }y=a{b}^{x}\hfill & \text{Write the general form of an exponential equation}.\hfill \\ \text{ }y=3{b}^{x}\hfill & \text{Substitute the initial value 3 for }a.\hfill \\ 12=3{b}^{2}\hfill & \text{Substitute in 12 for }y\text{ and 2 for }x.\hfill \\ \text{ }4={b}^{2}\hfill & \text{Divide by 3}.\hfill \\ \text{ }b=±2\begin{array}{cccc}& & & \end{array}\hfill & \text{Take the square root}.\hfill \end{array}$$[/latex]
Because we restrict ourselves to positive values of [latex]\,b,[/latex] we will use [latex]\,b=2.\,[/latex] Substitute [latex]\,a\,[/latex] and [latex]\,b\,[/latex] into the standard form to yield the equation [latex]\,f\left(x\right)=3{\left(2\right)}^{x}.[/latex]
Try It
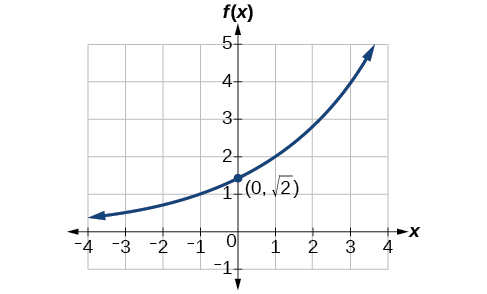
Find an equation for the exponential function graphed in Figure 6.
Show answer
[latex]f\left(x\right)=\sqrt{2}{\left(\sqrt{2}\right)}^{x}.\,[/latex] Answers may vary due to round-off error. The answer should be very close to [latex]\,1.4142{\left(1.4142\right)}^{x}.[/latex]
How To
Given two points on the curve of an exponential function, use a graphing calculator to find the equation.
- Press [STAT].
- Clear any existing entries in columns L1 or L2.
- In L1, enter the x-coordinates given.
- In L2, enter the corresponding y-coordinates.
- Press [STAT] again. Cursor right to CALC, scroll down to ExpReg (Exponential Regression), and press [ENTER].
- The screen displays the values of a and b in the exponential equation [latex]\,y=a\cdot {b}^{x}[/latex] .
Example 4 – Using a Graphing Calculator to Find an Exponential Function
Use a graphing calculator to find the exponential equation that includes the points [latex]\,\left(2,24.8\right)\,[/latex] and [latex]\,\left(5,198.4\right).[/latex]
Follow the guidelines above. First press [STAT], [EDIT], [1: Edit…], and clear the lists L1 and L2. Next, in the L1 column, enter the x-coordinates, 2 and 5. Do the same in the L2 column for the y-coordinates, 24.8 and 198.4.
Now press [STAT], [CALC], [0: ExpReg] and press [ENTER]. The values [latex]\,a=6.2\,[/latex] and [latex]\,b=2\,[/latex] will be displayed. The exponential equation is [latex]\,y=6.2\cdot {2}^{x}.[/latex]
Try It
Use a graphing calculator to find the exponential equation that includes the points (3, 75.98) and (6, 481.07).
Show answer
[latex]y\approx 12\cdot {1.85}^{x}[/latex]
Key Concepts
- An exponential model can be found when the growth rate and initial value are known. See Example 1.
- An exponential model can be found when the two data points from the model are known. See Example 2.
- An exponential model can be found using two data points from the graph of the model. See Example 3.
- An exponential model can be found using two data points from the graph and a calculator. See Example 4.
Glossary
- exponential growth
- a model that grows by a rate proportional to the amount present
