Unit 3: Migration Data
Section 2. What are the sources of migration data, their strengths and limitations?
In this section we will explore traditional and new data sources (Figure 3.3) as well as discuss the challenges and limitations of each type of migration data.
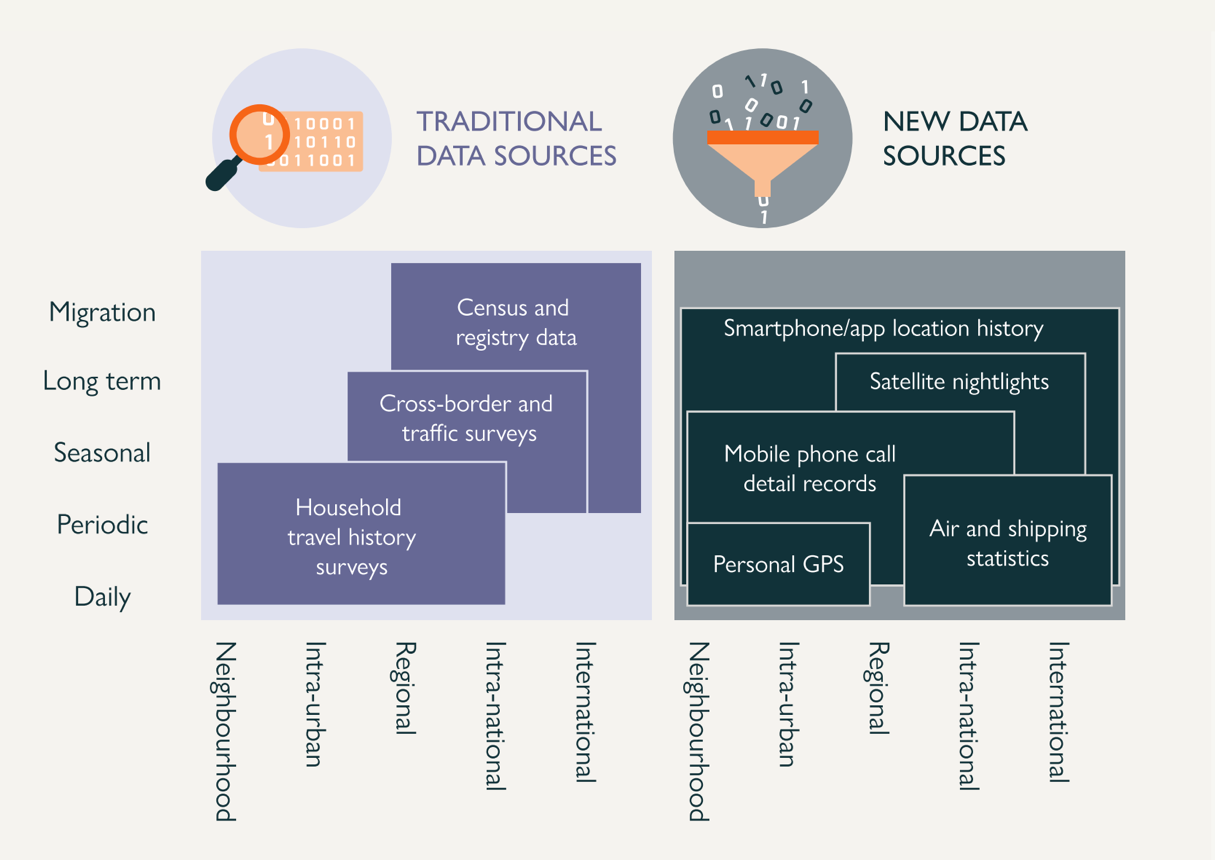
2.1 What are the traditional migration data sources?
Among the main traditional migration data sources are (Allen and Vargas‐Silva 2024, p. 86):
- censuses collected by national statistical offices every five or ten years. They usually collect information about the country of birth, citizenship, sometimes family history of migration, and year of arrival in the country. In some countries population registry data serve similar purposes;
- administrative sources, such as data registers of health records, tax-related data, educational statistics, social benefits, criminal records, police and border registers, visas and work permits which allow monitoring of changes to the situation of groups of migrants and estimating migration flows into the country;
- household surveys that can be national and international. These provide detailed information on the socio-economic characteristics of people, their attitudes and experiences of migration, and measure access to services.
Exercise 3.8
Among the largest international surveys that among other topics collect information about migrants, are the following:
- World Values Survey,
- International Social Survey Programme (ISSP),
- Labour Force Survey (LFS),
- European Union Statistics on Income and Living Conditions (EU-SILC),
- European Quality of Life Surveys (EQLS),
- European Social Survey (ESS),
Choose one of these and look for the migration-related characteristics it measures for your country. Alternatively, check the latest census conducted in your country (you can usually find it on the website of your national statistical office) and explore what kind of migration data you can find there.
- What did you learn?
- What kind of information about migrants and migration is not included?
2.2 What are the new data sources?
Innovative data sources not directly related to migration are increasingly used to help estimate migration-related phenomena and to study different groups of migrants.
New migration data sources include (Tjaden 2021, p. 15, IOM-UN Migration 2023):
Mobile phone data (call detail records [CDRs], GPS location, phone location history, also information about the time and associated cell tower of users’ text messages, calls, and data exchanges, which provide information about movements in almost real time at local, regional, and national levels)
Example
The most extensive initiative linking mobile CDRs to social integration has been the Data for Refugees (D4R) Challenge, which focused on Syrian refugees in Türkiye and opened an anonymized data set collected from one million users over an entire year to the research community (Salah et al. 2018).
Social media data (Facebook, Twitter, Instagram, LinkedIn, TikTok, Google) provides information about user activities and positions based on GPS location data, geotagged activities, Internet Protocol addresses and Wi-Fi network locations. Social media data might be useful in estimating changes in friendship/communication networks, in estimating migration stocks and flows, as well as attitudes towards migrants or providing information about migration roots or smuggling services advertised via social media platforms
Example
By combining Facebook API data and traditional data from Eurostat, researchers identified and characterized potential settlement areas of Ukrainians across the main destination countries in Europe after the Russian full-scale invasion (Leonardo et al. 2024).
In another project, The Data for Good at Meta team used Facebook data along with the UNHCR data on arrivals of displaced Ukrainians to other countries to estimate their geographical distribution on a regional and local levels, which made planning of humanitarian response more efficient (Minora et al. 2023, IMPACT Initiatives 2022)
Twitter data was used in a study examining the Italian Twitter landscape during the 2015 Syrian and 2022 Ukrainian refugee crises, with a focus on the evolution of anti-refugee discourse. Through the analysis of 400,000 tweets, researchers identified attitudinal communities, tracked changes in user positions and evaluated the trending potential of the communities (Kiyak et al. 2024).
Ukrainian-language Twitter data was also used in a combination with the news and events database (Armed Conflict Location and Event Data Project) to develop predictive models of forced displacement of Ukrainians to neighbouring countries (Wycoff et al. 2025)
Finally, in this video, based on 117 videos posted between January 2023 and April 2024, you can learn how Luigi Achilli presents his analysis of how migrant smugglers use TikTok to advertise irregular migration services (Migration Policy Centre 2024)
Online search engines, such as Google or Bing, can be monitored by governments to look for the intentions and destinations of potential migrants from specific countries. Although such predictions might approximately indicate aspirations but not necessarily migration plans or their implementation, they are also used as one of the tools in diaspora mapping through the analysis of searches in a particular language or about a particular country from another location
Example
Google Trends enabled tracking the location, needs, and plans of Ukrainian refugees who left their home country following the invasion of the Russian army (Adema and Guha 2022).
Satellite data and drone images can be used to collect information about surface changes, light emission at night, the level of construction/destruction of built structures or infrastructure, estimating local traffic. These types of data can potentially help to estimate the number of residents, seasonal migration/displacement, and infrastructural changes on the ground after a disaster
Example
By using satellite imagery for emergency disaster response, the British Geological Service has a long history of assisting relief efforts by providing satellite maps, data and interpretation to those affected by disasters, helping to identify hazardous areas to avoid.
Air passenger data help to estimate international migration flows and measure the differences between arrivals and returns between countries. They are increasingly used by the authorities to monitor potential terrorist and criminal activities
Example
In December 2024, the EU adopted regulations to improve border security and fight terrorism by establishing the framework for the collection and transfer of advance passenger information (API).
Online news platforms and databases of events can provide us with data about migration events, disasters, migration aspirations or attitudes. They might be especially useful in finding data on new proximate causes of migration, early indicators of possible trigger events (e.g. emerging conflicts, disasters) or be used in combination with other traditional or big data sources (Henningsen 2025).
Among the most notable databases are:
- Armed Conflict Location & Event Data (ACLED)
- Global Data on Events Location and Tone Project (GDELT)
- University of Uppsala’s conflict databases
- Event Registry
- Integrated Crisis Early Warning System (ICEWS)
- The U.S. National Oceanic and Atmospheric Administration databases on weather and natural disasters (NOOA databases)
- The Europe Media Monitor (EMM) project
Artificial intelligence and machine learning should also be included in data innovation in migration research because they can help us analyse large amounts of data from a variety of sources, predict migration flows from specific countries, and evaluate attitudes towards migrants and their experiences.
Example
A Report analyses EU initiatives on developing and deploying artificial intelligence (AI) technologies to improve border control and border security (Dumbrava 2021).
You can also browse Big Data for Migration Alliance Repository of Use Cases for Anticipating Migration Policy to see how big data is used to forecast migration flows and population changes.
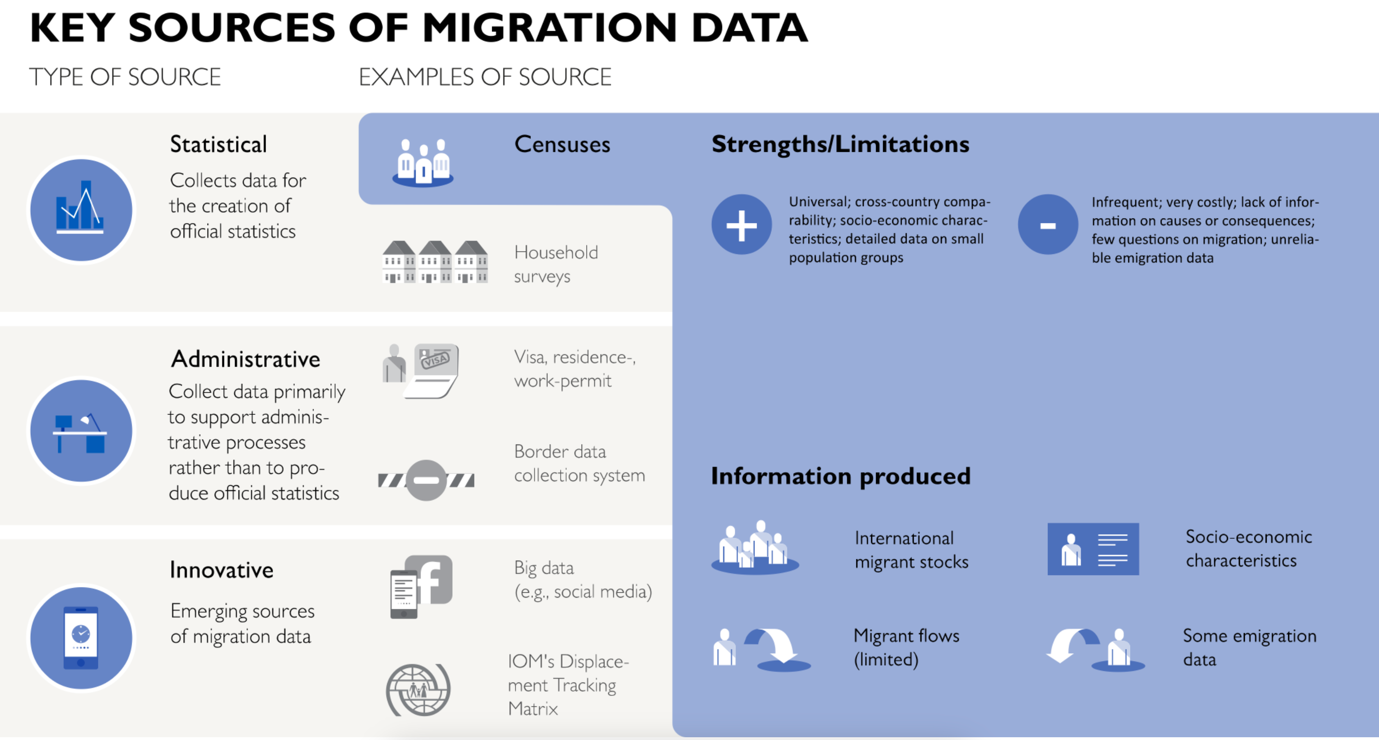
Both traditional and new migration data sources have strengths and limitations we must be aware of when using them.
Exercise 3.9
Check the strengths and limitations of each type of migration data source (as indicated in Figure 3.4) using the interactive Key Sources of Migration Data tool.
What kind of information can they produce?
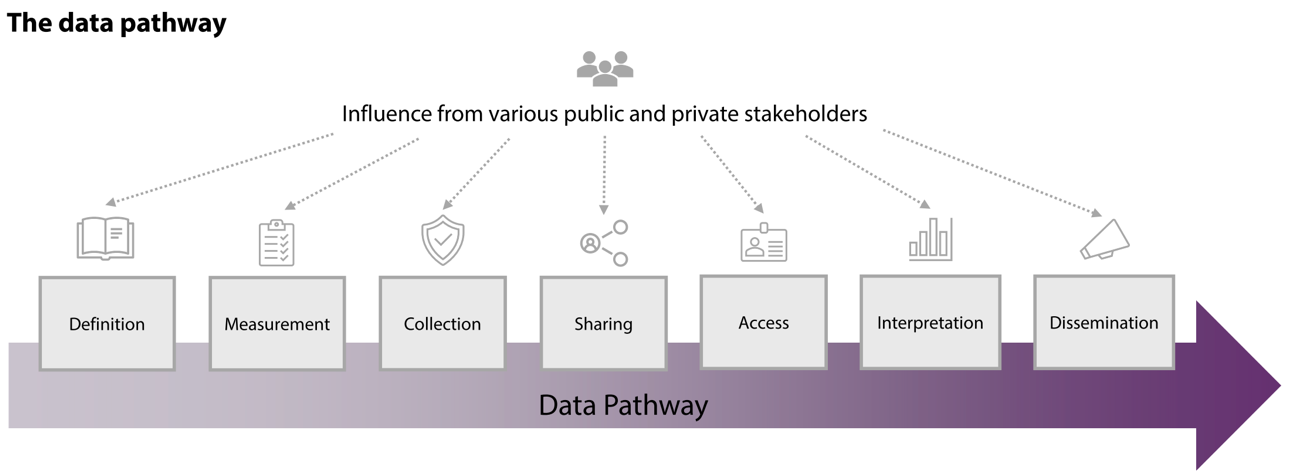
2.3 What are the challenges and gaps in migration data sources?
With respect to traditional migration data sources, challenges can occur throughout the whole data pathway process (see Figure 3.5) starting from the choice of definition as to who is a migrant and what is migration; through the choice of measurement methodology; the methods of data collection; and subsequently due to the challenges of sharing, accessing, interpreting and disseminating migration data.
Migration researchers agree that, despite UN recommendations on the standardisation of definitions, some countries still prefer to use their national definitions of ‘international migrant’, especially with regard to the duration of stay abroad. This impacts on the global comparability of data.
Information on the drivers of migration, geographic distribution, migrants’ socio-demographic characteristics is not always available.
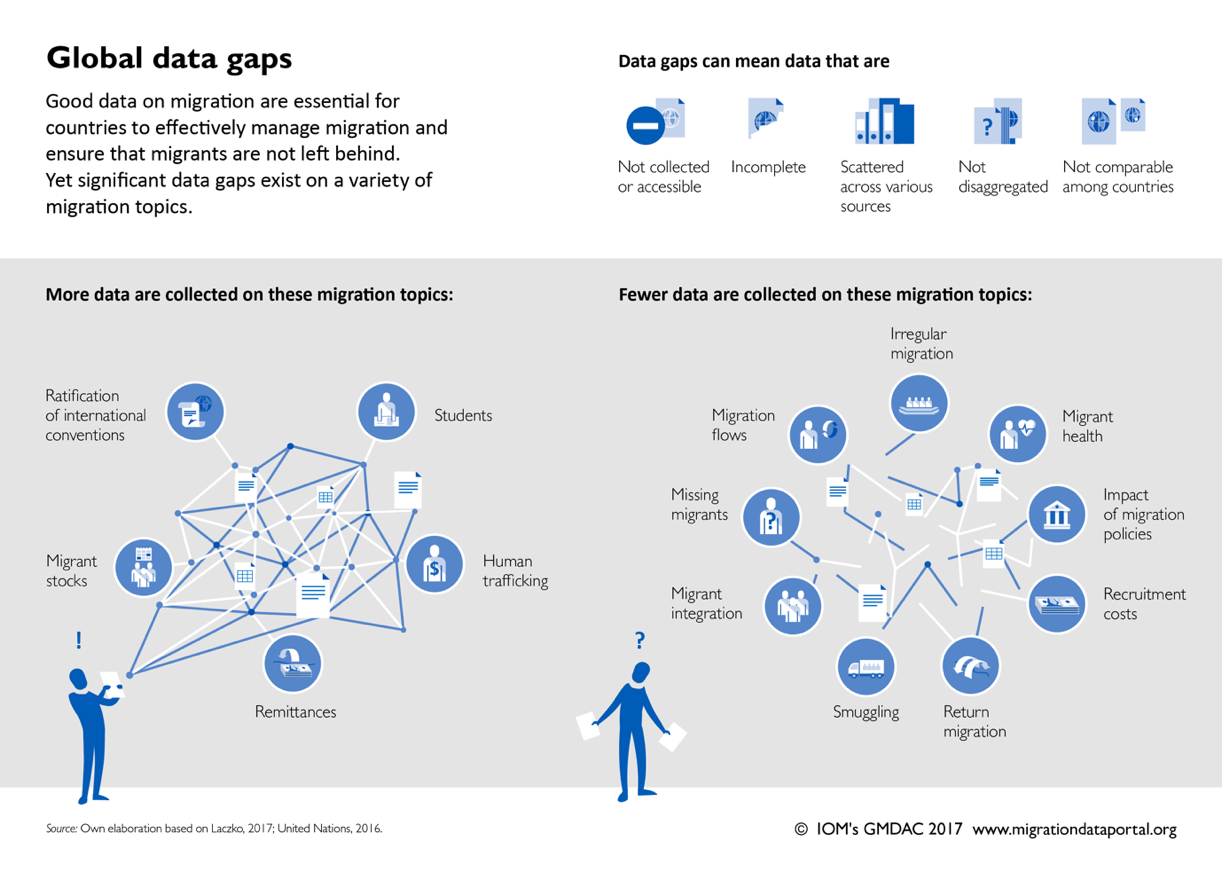
Moreover, the timeliness of migration data, especially derived from censuses, might make such data more difficult for policymakers and practitioners to use efficiently in real time (Allen and Vargas‐Silva 2024, p. 84).
This explains the major gaps we still find in global migration data (see Figure 3.6).
Furthermore, some groups of migrants are difficult to reach and measure. These include:
- people with dual citizenship who might be doubly counted;
- seasonal workers or circular migrants who might not be included in household surveys or censuses;
- persons with irregular legal status who will most likely not be included in data collected by the authorities due to their fear of being detected or deported.
We only have scattered data about the missing migrants.
A further challenge with migration data is fragmentation and poor coordination between the different agencies producing migration data and those using them.
For example, national statistical offices might not have the data needed by the ministries of health or education to evaluate aspects of migrants’ integration or lack the staff and resource capacity to use available data.
Finally, we should also consider the capacities of different actors and agencies to generate, evaluate, exchange and use migration data, as well as being able to assess its quality, comparability and relevance for their activity and policy priorities (Laczko and Vidal 2024). As a result, some data might be underused or not used at all, especially if the data is considered not relevant, not trustworthy or not suitable for specific political agendas.
Migration researchers argue (Laczko, Mosler Vidal, and Rango 2024, p. 74) that gaps in migration data “hinder the ability of policymakers and practitioners to:
- understand past and current migration trends (descriptive analysis);
- identify the drivers of shifts in migration and mobility patterns, as well as their impact on individuals and communities at large (causal analysis);
- make predictions about how these patterns will evolve in the short or long term, or anticipate future shifts (predictive analysis);
- assess the impact of policy and programmatic measures on migration and related areas, as well as monitor the effectiveness of specific policy interventions over time (impact analysis).”
Exercise 3.10
Check the methodology used by the IOM project Missing Migrants and consider the limitations of such data.
What alternative sources in your view could have been used to improve or add to the data to estimate the number of missing migrants?
With regard to the new migration data sources, numerous challenges derive primarily from their digital nature and the ethical challenges it poses ((IOM-UN Migration 2023; Dodevska 2024; Laczko, Mosler Vidal, and Rango 2024, Donato et al. 2025, Yildiz et al. 2025, Zook et al. 2017), in particular:
- concerns about ownership, privacy, security and ethical use of data for research or policy collected without explicit informed consent for such purposes. As new data sources are often collected by private entities, concerns about the reliability and integrity of information from the new data sources should be taken into consideration as well as its potential impact on migrants in vulnerable situations;
- trustworthiness and the extent of regulatory frameworks on the use of new types of data may vary significantly across countries. For example, the European General Data Protection Regulation includes very strict rules for user profiling used to make automated decisions that target individuals and may have legal or other types of personal consequences;
- availability and capacities (analytical and technical) to use and interpret new types and the amount of data by different actors and agencies, the risk of misuse, problems of accessibility and costs;
- selection bias when using social media tools (e.g. the use of different platforms is uneven across countries and different migrant groups; it also changes over time), concerns about continuity and sustainability of using this type of data if platforms cease to function;
- the timeliness of new migration data sources does not always mean it is useful for longer-term forecasting, and there is a risk of misuse or politicization of data;
- combination of traditional and new migration data sources might be difficult due to difficulties in harmonizing data across spatial and temporal scales,
- presumed ‘neutral’ automated screening and analysis of data may lead to real-life decisions that can be biased, discriminatory or wrong because of selection bias, misinterpretation of data or technical failures.
Exercise 3.11
Read about a study on bias in artificial intelligence systems that found that gender identification through facial recognition technology was highly accurate for white men, but not at all for Black women because of algorithms being developed based mainly on white male faces.
Even though new migration data tools, especially artificial intelligence-driven tools, could speed up and improve the analysis of large amounts of various types of data, we should be mindful about its potential limitations, especially:
- which migrant groups are either not covered or are underrepresented in the data;
- which information might be missing;
- the time and geographical limitations of the data collected.
2.3 Are migration data and evidence the same thing?
The two terms ‘data’ and ‘evidence’ are often used interchangeably, but do they mean the same thing? Not really.
Definitions
Evidence is a body of information that “proves whether a hypothesis is true—for example, whether an integration policy is effective” (B. J. Slootjes and Zanzuchi 2023, p.9).
Data is a component of evidence, “raw information that has not been interpreted and is not necessarily being used to prove whether a specific policy is working or not” (ibid).
Different types of data can be used as part of evidence together with stakeholder input, academic research, and many other forms of information that allow policymakers to assess whether policies are effective in improving integration outcomes.
Data does not speak for itself; it needs analysis and interpretation that will contextualize the findings and make them part of a broader picture.
For instance, regarding migration, migration researchers study various aspects of migrant integration from multiple angles combining the use of migration data and other types of information (B. J. Slootjes and Zanzuchi 2023) to evaluate:
Policy inputs, namely:
- what kind of migrant integration policies and practices exist;
- how did they change over time and across countries;
- how were they implemented and how effectively?
Example
The Migrant Integration Policy Index (MIPEX), identifies and measures integration policies across 56 countries. Countries receive a score and are classified based on how well their integration policies cover issues such as securing basic rights, supporting equal opportunities, and leading to positive long-term outcomes. The index includes policies on labour market mobility, education, political participation, access to nationality, family reunion, health, permanent residence, and antidiscrimination.
While this is a useful tool to compare how governments approach promoting the integration of migrants and to assess how integration approaches have changed over time, it does not provide specific information on the policies implemented and their outcomes.
Example
Dataset of World Refugee and Asylum Policies (DWRAP), offers a complete dataset of de jure asylum and refugee policies for all 193 countries for the 70 years from 1951-2022. The DWRAP index aggregates policies from 5 fields: Access; Services; Livelihoods; Movement, and Citizenship and Participation.
Policy outcomes, namely:
- what are the outcomes of migrants’ integration?
- what gaps need to be addressed?
Example
The OECD’s ‘Settling In’ series provides survey data on the integration outcomes of migrants and their children in EU, OECD, and selected G20 countries. The survey has been held every three years since 2012 and collects information on 74 indicators related to labour market and skills, living conditions, and civic engagement and social integration.
Policy impacts, including:
- how are migrant integration policies connected to migrant integration outcomes?
- What are the intended and unintended consequences of policies?
- What makes certain policies effective, for which migrant groups?
Example
The European Website on Integration (EWSI) collects up-to-date information and self-reported good practices on migrant integration.
It also provides information on the European Union’s work on integration, an overview of available EU funding, guidance on how that funding works, and country pages with further information about EU Member States’ integration policies.
Policies in the good practices database can be filtered by date; geographic area; theme; and target population age, gender, reason for migration, and residence status.
Example
The European Migration Network (EMN)’s Research Library, includes policy research reports related to migrant integration, migration, education, international protection, and other integration-related topics.
The EMN is a European expert network that works together to share objective, comparable policy-relevant information.
To sum up, migration data is important but not sufficient to analyse complex and multi-dimensional social phenomenon of migration and integration. Yet data serves as building blocks for testing research hypotheses, evaluating policies and making more informed decisions. Without quality data you can’t have enough evidence.
Exercise 3.12
If you want to learn more about how migration evidence can be used, you can enrol in the free Learning from the Evidence on Forced Displacement e-course (6 hours, registration required) designed by the World Bank-UNHCR Joint Data Center on Forced Displacement.
You have now completed Section 2 of Unit 3. Up next is Section 3: How is migration data politicized?
