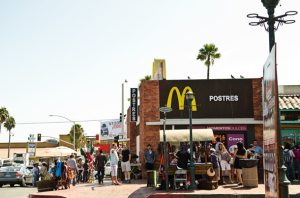
The above image[1] of a McDonald’s in Mexico illustrates the relationship between Hispanic immigration and American globalism. The latter term refers to U.S. world predominance since 1945 (see Chapter 1). McDonald’s—one of many American multinational fast-food (comida rápida) corporations—has long been a global disseminator of American capitalist values such as efficiency, calculability, predictability, and control.[2] (The sign in the photo advertises postres, or “desserts” in Spanish.) Understanding Hispanic immigration requires comparative understanding of Latin America’s relationship to the U.S., as well as U.S. immigration history.
The Immigration and Naturalization Act of 1965 (Hart-Celler Act) ended white-supremacist national origin quotas (earlier revised in the 1952 Magneson Act). American nativism (see Chapter 6) had long imposed racist immigration policies—from the Immigration and Naturalization Act (1790) restricting immigration to whites, to the Chinese Exclusion Act (1882) and anti-Catholic and anti-Jewish Emergency Quota Act (1921). After 1965, the U.S. entered an era of large-scale immigration comparable to the late 1800s and early 1900s. Likewise, Europe in recent years has experienced large-scale immigration from the global South (“Third World”), especially Africa and the Middle East. In the decades following President Carter’s (1976-1980) insistence on human rights as essential to U.S. foreign policy (Chasteen 2001:290), human rights groups have increasingly leveled this criticism against the U.S. itself, flagging its immigration policy in particular as violating international standards. Controversy in recent years over separation of immigrant families by U.S. border authorities is but one example.[3]
Why do so many immigrants and migrants attempt to illegally enter America and other countries of the global North? What connection does recent global South-to-North immigration have with previous centuries of European global colonization (Chapter 4), and with U.S. imperialism in Latin America and the Pacific (Chapter 12)? What is the relationship between U.S. foreign policy in Latin America, and Latin American immigration to the U.S.?
Chapter 13 Learning Objectives
13.1 Cold War Interventionism in Latin America, 1945-1989
- Define American globalism
- List three examples of U.S. intervention in Latin America, 1945-1989
13.2 Hispanics: The Largest Minority[4]
- Understand facts about Hispanics, the largest U.S. ethnic minority group
- Compare and contrast old immigration (1830-1920) and new immigration (since 1965)
13.3 Ambivalent Friendship: Mexico and the United States
- Explain why Mexico and the U.S. have long had a relationship alternating between friendship and hostility
- Define NAFTA
- Understand facts about Mexican political geography
13.4 Mexican Immigration
- Define Chicano
- Understand recurrent themes in Mexican immigration history
- Define America’s love-hate relationship with Mexican labor
Chapter 13 Key Terms (in order of appearance in chapter)
American globalism: since 1945, the U.S. has been the predominant military, economic, cultural, and ideological power in the world, with global commitments, relationships, and interests (see Chapter 1)
The Immigration and Naturalization Act of 1965: Reform of U.S. immigration policy, ending 1920s white-supremacist immigration quotas (see Chapter 6). The 1965 law provided the context for mass immigration from the 1970s onwards.
old immigration: large-scale European immigration from 1830-1920
new immigration: large-scale immigration since 1965, primarily from non-European world regions such as Latin America, Asia, and Africa (e.g., Mexicans, Cubans, Salvadorans, Indians, Koreans, Nigerians, Somalis)
NAFTA: the 1994 North American Free Trade Agreement was a major policy victory for Mexican president Salinas (1988-1994). The commercial treaty significantly increased Canada-U.S.-Mexico economic links, despite harming many rural Mexicans.
sexenio: the six-year term of Mexican presidents. Since the 1930s, it has been taboo for presidents to seek a second term (“No Re-Election”). From 1929-2000, Mexico had one-party rule under PRI (Partido Revolucionario Institucional: the “Institutional Revolutionary Party”).
Chicano: the 1960s-70s saw the rise of Mexican American empowerment as a political movement. The term Chicano, associated with this movement, refers to Mexican Americans. It may have originated as a version of mexicano (“Mexican”).
America’s love-hate relationship with Mexican labor: U.S. economic history alternates between boom and bust. In good times, employers pursue profits by encouraging low-wage immigrant (e.g., Mexican) labor. In hard times (recession), native labor increasingly competes with (Mexican) immigrant labor, fueling nativist hostility to immigration.
13.1 Cold War Interventionism in Latin America, 1945-1989
By 1945, decades of American imperialism in Latin America and the Pacific had prepared one of the foundations of American globalism (see Chapter 12). The term refers to America’s status after 1945 as the world’s predominant military, economic, cultural, and ideological power, with global commitments, relationships, and interests (APAN:II:713; see Chapter 1).
During the Cold War rivalry between the U.S. and USSR (1945-1989), American foreign policy statements often drew upon the nation’s long traditions of exceptionalism and expansion (Chapter 12). For example, McGeorge Bundy, President Kennedy’s (1961-63) national security adviser, declared that “[t]he United States is the engine of mankind, and the rest of the world is the caboose” (quoted in APAN:II:778). This combination of global military and economic might (extensive but not unlimited), on the one hand, and anticommunist ideology on the other, formed the context of Cold War U.S. relations with Third World regions like Latin America.
Unlike other global regions, Latin America shared the continent with the northern superpower. Since at least the Monroe Doctrine (1823),[5] the U.S. had regarded Latin America as a crucial U.S. sphere of influence, against European powers. In the early Cold War, the Soviet Union regularly accused the U.S. of hypocrisy: the Americans were intervening in Eastern Europe, yet warning Moscow to steer clear of affairs in Asia and Latin America. Whereas the U.S. demanded free elections in the USSR sphere of influence (e.g., Eastern Europe), the Americans opposed free elections in Latin American nations ruled by pro-U.S., military dictatorships (APAN:II:721). The two regions were analogous for the two superpowers as historic zones of Russian or U.S. expansion. Like Eastern Europe to the USSR, Latin America was politically, economically, and militarily sensitive to the U.S. As in previous eras, throughout the Cold War, a major foreign policy goal for each superpower was to maintain these spheres of influence through regional domination.
During the Cold War, many Latin American nations had client-governments of the U.S. The term means a government reliant on a more powerful nation’s military or economic aid (APAN:II:722). Like the post-WWII relationship between Britain and Greece, or the USSR and Czechoslovakia, the U.S. had great influence over numerous Latin American governments. When Washington’s wishes were challenged—by revolutions against dictatorships (e.g., Cuba in 1959), or by democratically elected leftists (e.g., Guatemala in 1951; Chile in 1973)—the American response was frequently direct or indirect intervention in that nation’s affairs. Thus, Cold War interventionism in Latin America repeated in significant ways features of pre-1945 U.S. imperialism.
For example, in 1951 Guatemala elected a socialist, Jacobo Arbenz Guzmán, to the presidency (Cullather 1999). A poor country, Guatemala’s largest landowner was an American multinational corporation, the United Fruit Company. The election result threatened U.S. anticommunist containment policy in the region, as well as the United Fruit Company’s extensive land holdings. In mid-1954, with CIA support and U.S. military equipment, the pro-U.S. Guatemalan opposition bombed the capital city, deposed Arbenz, and returned United Fruit’s land. Thus began a civil war in Guatemala (1960-1996) in which over 150,000 people died (APAN:II:737-38; cf. Chasteen 2001:256-57). The Guatemalan case illustrates a larger pattern. All too often during the Cold War, American foreign policy—couched in the language of “democracy,” “national security,” and “freedom”—resulted in military dictatorships and civil wars in U.S. spheres of influence. This was especially the case in Latin America (Chasteen 2001:279).
By Cold War’s end in the late 1980s, much of Latin America was emerging from bureaucratic authoritarianism: rule by U.S.-allied and U.S.-supported military leaders. The region faced major internal and international reckoning for years of extreme anticommunist policy—e.g., rounding up hundreds of “suspects,” whom the police or military then tortured and murdered (ibid:278). As with Guatemala’s civil war following the U.S.-supported proxy force that ousted Arbenz, widespread violence was a result much worse than the alleged communist danger. By 1980, anticommunist dictatorships ruled in most Latin American countries (ibid:288)—an unintended outcome of America’s Cold-War quest to promote global democracy and liberty.
13.2 Hispanics: The Largest Minority
Cold War interventionism in Latin America formed a key part of the context of Hispanic immigration to the U.S. after 1965. The Immigration Act of that year, ending racist national origin quotas, also contributed to increasing Latin American immigration from the 1970s onward (Nazario 2007). Much of the motivation for immigration—insecurity (violence) and limited economic opportunity in immigrants’ homelands—was related, in complex ways, to American Cold War foreign policy.
Since the 1970s, Hispanic immigration has altered the racial-ethnic composition of the United States in history-making ways. Before 1965, the nation’s demographics largely consisted of a large non-Hispanic white majority (88% in 1950) and a much smaller African American minority (10% in 1950). As we’ve seen, the “white” group consisted of WASPs and many white ethnic groups, which by 1950 had largely become whitened (Chapter 7). Hispanics (2% in 1950), in turn, were far fewer than African Americans.
Table 13.1. Year by group percentage of U.S. population[6]
| Year | Non-Hispanic white | Hispanic or Latina/o | African American | Asian and Pacific Islander | Two or more races | Arab American | American Indian |
| 1950 | 88 | 2 | 10 | < 1 | N/A | N/A | < 1 |
| 2010 | 60.3 | 16.4 | 12.2 | 5.0 | 2.9 | 0.5 | 0.7 |
| 2060 projected | 37 | 30.6 | 14.7 | 8.5 | 5.9 | 1.8 | 1.5 |
Sources: Adapted from APAN:II:887-88; Schaefer 2015:4.
As Table 13.1 shows, much changed in the half-century after 1965. The biggest shifts have been the falling percentage of non-Hispanic whites in the population (about 60% in 2020), and the rising share of Hispanics (about 19% in 2020). In 2003, people of Latin American or Spanish ancestry or origin became the second largest racial or ethnic group (after non-Hispanic whites), moving past African Americans (APAN:II:887). The majority of this immigration has been documented and legal in terms of U.S. immigration law. However, undocumented or illegal immigration rose from about 3 million people in 1980 to a peak of 12 million in 2007. In 2005, close to 5% of the nation’s labor force consisted of undocumented workers (ibid).
By 2017, Hispanics totaled 56.5 million, forming more than 17.6% of the U.S. population (321 million).[7] In comparison, the total population of Spain in 2020 was 47 million. After Mexico (126 million in 2020), the U.S. Hispanic population is today the world’s largest, bigger than the total population of countries such as Colombia (48 million in 2018), Argentina (45 million in 2020), or Peru (31 million in 2017).[8] In an important sense, the United States—one of the world’s most multicultural nations—is increasingly both a non-Hispanic country and a Hispanic one. As Table 13.1 indicates, in coming decades Hispanicization is likely to continue reshaping American society even further.
How will non-Hispanic Americans respond to these changes? Surely there is much to be learned from the nation’s long history of large-scale immigration prior to 1920. The 45-year period from 1920 to 1965—during which immigration was low—was in several respects demographically atypical of America’s overall social history.[9] As we’ve seen (Chapter 6), especially in the period 1830-1860, mass immigration visibly changed the face of many northern urban centers. Boston, New York, Philadelphia, and others all became immigrant cities (Blight 2008, Lecture 4, 31:03). Likewise, it bears remembering that, like many Hispanic immigrants today, European white ethnic immigrants in the 1800s and early 1900s (e.g., Irish, Jews, Italians) were often perceived as nonwhite (“off-white”) by white native-born Americans (Ignatiev 1995; Omi & Winant 2014).
13.3 Ambivalent Friendship: Mexico and the United States
Of the various Hispanic national-origin groups in the U.S.—Puerto Ricans, Cubans, Dominicans, Guatemalans, Salvadorans, Hondurans, Panamanians, Colombians, Venezuelans, Argentinians, Peruvians, Chileans, etc.—Mexican Americans are by far the largest, forming 11.1% of the U.S. population in 2017.[10] Accordingly, it’s increasingly essential for diversity students to learn about the Mexico-U.S. relationship and Hispanics of Mexican descent or nationality.
Socially powerful groups often have significant blind spots in relation to less powerful ones (see Chapter 1). Mexico’s relationship with the “Colossus of the North” (the U.S.) is a case in point (Bustamante 1997; Delgado & Stefancic 1998; Velázquez 2010). Whereas the U.S. is the world’s leading economic, military, cultural, and ideological power, Mexico—though in many respects a leading Latin American nation—is greatly overshadowed by American world power and influence. In decision-making, Mexico’s national leadership takes very seriously Washington’s desires; by contrast, American politicians take Mexico much less into account (Castañeda & Pastor 1989; Hernández 2010; Preston & Dillon 2004).
Many North Americans have little awareness of Mexico beyond stereotypes, despite the two nations’ dense commercial, political, and cultural ties (Davis & Moore 2014). Whereas most Mexicans can name basic features of U.S. political geography (New York, Florida, Texas, Chicago, California, etc.), the same can’t be said about most Americans regarding Mexican political geography (Puebla, Oaxaca, Jalisco, Zacatecas, Ciudad Juárez, etc.). Likewise, even though Mexico is geographically part of North America, many Americans see the continent as ending at their southern border. By contrast, Mexicans tend to be quite aware of America’s presence to the north.
Despite such blind spots, Mexico-U.S. ties continued to increase in the early twenty-first century. Perhaps the most fundamental connection—and barrier—is a long border. In fact, at 1,954 miles (3,145 kilometers) it is the world’s longest between a First- and Third-World nation (Fuentes 1995). Economic links increased with the 1994 North American Free Trade Agreement (NAFTA) (APAN:II:866). NAFTA was a major policy victory of Mexican president Carlos Salinas de Gortari’s sexenio, or six-year presidential term, of 1988-1994 (Preston & Dillon 2004). American-educated at Harvard, Salinas was followed at Los Pinos[11] (Mexico’s presidential mansion or White House) by Yale University graduate Ernesto Zedillo (1994-2000). Despite the end of one-party rule marked by Vicente Fox’s (2000-2006) election, a continuity was ongoing American influence: President Fox had worked for many years as an executive in the U.S.-based multinational corporation Coca-Cola (Preston & Dillon 2004; Velázquez 2010).
Mexico and the U.S. have long had a rocky and contentious relationship, one marked by ambivalence and misunderstanding (Castañeda & Pastor 1989; Skerry 1993; Taibo 2011; Velázquez 2010). The relationship has, since at least the U.S. invasion of Mexico in 1846, been marked by U.S. geographical expansion and increasingly global power (see Chapter 12). As Mexican dictator president Porfirio Díaz (1876-1911) allegedly quipped, “Poor Mexico, so far from God, so close to the United States” (Chasteen 2001:194). As we’ve seen, since 1945 the U.S. has been the world’s most powerful nation and largest economy. Mexico’s proximity to the U.S. has long signaled for Mexico both threat and opportunity. For the U.S., Latin America and especially Mexico will likely only increase in economic, political, and cultural importance in coming years (cf. Almada 2012; Cisneros 1984). This is especially due to the growing demographic share of Hispanics in the U.S. population.
Figure 13.1 and Table 13.2 below show facts about Mexican political geography. The figure shows the six northern border states: Baja California, Sonora, Chihuahua, Coahuila, Nuevo León, and Tamaulipas (from west to east). The table lists the 31 Mexican states with their state capitals. The nation’s capital, Mexico City, is a federal entity like the states (though not itself officially a state).[12]
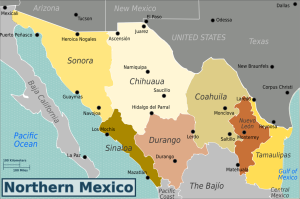
Figure 13.1. Northern Mexico.[13] Note that the western peninsula contains two states (not shown): Baja California (bordering the U.S. state of California) and Baja California Sur. Likewise, the Bajío (Lowlands), Central Mexico, and Pacific Coast (at bottom) are regions composed of various states in the country’s central zone.
Table 13.2. México: Names of States and Capitals
 |
Mexico City (aka La Ciudad de México, CDMX) | Mexico City is the nation’s capital. It is both city and federal entity, similar to Washington, D.C., but much larger.
|
|
| # | Region | Estado (State)
|
State capital city |
| 1 | Southeast | Chiapas | Tuxtla Gutiérrez |
| 2 | Quintana Roo | Chetumal | |
| 3 | Yucatán | Mérida | |
| 4 | Campeche | Campeche | |
| 5 | Tabasco | Villahermosa | |
| 6 | Oaxaca
|
Oaxaca | |
| 7 | South central | Guerrero | Chilpancingo |
| 8 | Morelos | Cuernavaca | |
| 9 | Puebla | Puebla | |
| 10 | Veracruz | Jalapa | |
| 11 | Tlaxcala | Tlaxcala | |
| 12 | México
(Mexico State = Estado de México)
|
Toluca | |
| 13 | Center | Hidalgo | Pachuca |
| 14 | Querétaro | Querétaro | |
| 15 | Guanajuato | Guanajuato | |
| 16 | Aguascalientes | Aguascalientes | |
| 17 | Michoacán | Morelia | |
| 18 | Colima
|
Colima | |
| 19 | West center | Jalisco | Guadalajara |
| 20 | Nayarit | Tepic | |
| 21 | San Luis Potosí | San Luis Potosí | |
| 22 | Zacatecas | Zacatecas | |
| 23 | Durango | Durango | |
| 24 | Sinaloa
|
Culiacán | |
| 25 | North | Baja California Sur | La Paz |
| 26 | Baja California | Mexicali | |
| 27 | Sonora | Hermosillo | |
| 28 | Chihuahua | Chihuahua | |
| 29 | Coahuila | Saltillo | |
| 30 | Nuevo León | Monterrey | |
| 31 | Tamaulipas | Ciudad Victoria |
As with connections, many differences exist between Mexico and the U.S. A striking example of contrast in their social realities (and an example of the social construction of race: Chapter 7) is that racial-ethnic identities change when people cross (al otro lado: “to the other side” of) the border. In Mexico, as in any country, national differences matter: a Mexican citizen is not a Guatemalan, Honduran, Salvadoran, or Nicaraguan national. Likewise, levels of education, wealth (class), and skin color[14] are all consequential for social stratification (Bustamante 1997; Chasteen 2001). However, these different types of people—in crossing to the U.S. by plane, car, bus, boat, bike, or foot—all become “Hispanic,” the U.S. catch-all ethnic term highlighting broad cultural similarities such as Spanish language and Latin American origin (Gómez 2018). As noted in Chapter 3, the term “Hispanic” was created by Congress in 1976, and is not used in Latin America.
13.4 Mexican Immigration
A major theme in the Mexican American story—whether in the 2000s or the 1800s—has been low-wage immigrant labor (Skerry 1993). Race (or ethnicity) and class have long worked together to marginalize people of Mexican ancestry or nationality in the U.S.
As with African American civil rights (Chapters 9-11), Mexican Americans after 1965 saw breaks as well as continuities with older forms of exclusion. A key break with the past was the Chicano movement during the 1960s-70s, which partly built on and partly rejected older styles of group identity (Villanueva 1980). The term, referring to empowered and proud Mexican American identity, may have originated as a version of mexicano (“Mexican”). Today, Americans of Mexican ancestry usually take pride in this heritage.
By contrast, a crucial continuity has been America’s ongoing demand for low-wage immigrant labor, especially from Mexico. With much capital, many natural resources, and expanding geography, America in many stages of its economic development has depended on low-wage immigrants. Mexicans have often found themselves entangled in a recurrent historical pattern: America’s love-hate relationship with Mexican labor.[15] The cycle alternates between (1) economic boom (in expanding economic times, employers seek larger profits by hiring cheap immigrant labor), and (2) economic bust (in recessions, increased competition for existing jobs fuels nativist hostility to immigration).
The cycle is deeply influenced by U.S. class conflict. On the one hand, capital demands cheap immigrant labor; on the other hand, native labor (especially whites competing for jobs with nonwhite immigrants) rejects it. Given that U.S. politics and law tend to prioritize the interests of capital over those of labor, immigrants have often found themselves caught in the middle of this class conflict. The result has been a long history of mixed signals, as America lurches between seeking to entice immigrant labor, and a few years later rejecting it with anti-immigrant nativism (see Chapter 6).
For example, the Great Depression (1929-1941) was an era of bust: historic economic shrinkage. Native-born Americans used nativist politics to blame Mexican immigrants as scapegoats for their woes. In the Southwest in particular, non-Hispanic whites (Anglo-Americans) felt that their jobs had been stolen by foreign laborers (APAN:II:653). Anti-immigration campaigns harmed not only newcomers from Mexico, but also many U.S. citizens of Mexican ancestry, some of whom had ancestries in the Southwest predating the 1800s. In the early 1930s, President Roosevelt’s Labor Department announced a plan of mass deportation of illegal immigrants, to make more jobs available to U.S. citizens. However, authorities in the 1930s roundups and deportations frequently made mistakes, such as deporting people lacking papers but who were in fact citizens, as well as children born in the United States. From 1929 to 1935, the government officially deported some 82,000 people to Mexico, with many more (close to 500,000) leaving voluntarily or because someone forced or misled them into thinking the policy applied to them (ibid). Many of these deportees and emigrants were more American than Mexican, having no knowledge of Mexico or of the particular part of northern Mexico where they were sent.[16]
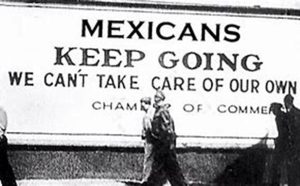
Figure 13.2.[17] During the 1930s Great Depression, the U.S. deported tens of thousands of Hispanics, including many U.S. citizens. The official rationale (“We can’t take care of our own”) presumed white nationalism—the assumption that nonwhite Hispanics were not “real Americans.”
By contrast, World War II created a boom: a greatly expanding economy, driven by government-sponsored war production. Immense demand for unskilled agricultural workers meant seeking cheap immigrant labor again from Mexico, as before the Depression. Despite the recent deportations, the U.S. government now did an about-face, offering short-term contracts to bring approximately 200,000 Mexicans to the Southwest for agricultural jobs as braceros (hired hands; APAN:II:694). A telling fact is that, in 1941, not a single Mexican American was employed at the Los Angeles shipyards; however, in 1944 about 17,000 were employed there (ibid).
Following WWII, Mexican immigrants endured much rural poverty between 1945 and 1960. The U.S. bracero program continued to bring inexpensive migrant labor to the Southwest and West. By 1959, close to a million Mexican laborers entered the U.S. legally (APAN:II:771).
However, in 1978 an amendment to the 1965 Immigration Act added a per-nation quota, which significantly decreased the number of immigrants authorized to enter from Mexico. But since U.S. employers continued to demand cheap immigrant labor, the new policy created a surge in the numbers of “illegal” immigrants (Telles & Ortiz 2008:94). Whereas about 85% of Mexican Americans in the mid-1960s were born in the U.S. (ibid:xxiii), since the 1980s the foreign-born percentage of Mexicans and Mexican Americans in the U.S. has greatly increased.
In sum, Hispanic immigration must be understood in terms of its relationship to U.S. foreign policy, U.S. economic demand, and shifting categorizations (legal vs. illegal) in U.S. immigration law. The timeline below (Table 13.3) shows the history of Mexican immigration (in particular), providing additional examples of U.S. ambivalence toward Mexican labor.
Table 13.3. Mexico-U.S. Immigration Timeline (to 2001)[18]
| Year(s)
|
Event description |
| 1519-1700s | Colonial period of New Spain (Mexico). European founding of colonial regions now known as California, Nevada, Arizona, Colorado, New Mexico, Texas. Founded: towns or forts of San Francisco, Monterey, Los Angeles, San Diego, Tucson, Santa Fe, Albuquerque, Las Cruces, El Paso del Norte, San Antonio, Laredo, etc. Geographical features receive European names: San Francisco Bay, Monterey Bay, El Mar de Cortez (Gulf of California), El Río Bravo (Rio Grande).
|
| 1798 | US Law on Illegal Immigrants and Sedition. Prohibits the entrance of “illegal immigrants” that put in danger the national peace and security, and makes possible their expulsion.
|
| 1830-40 | Catholic, German, Irish immigrants are attacked. The anti-immigrant and nationalist “Know Nothing” party is formed.
|
| 1846 | US invades Mexico. The Mexican War lasts 1846-48, culminating with US occupation of Mexico City under General Winfield Scott. |
| 1821-1848 | Period of Mexican Independence prior to territorial losses to US in 1848 (Treaty of Guadalupe Hidalgo), 1853 (Gadsden Purchase). Including Texas, Mexico loses half of its claimed territory to US in 17 years (1836-1853). Treaty of Guadalupe Hidalgo makes Mexican citizens US citizens and guarantees land ownership protection. The resulting Mexico-US border is 3145 km (1954 mi) long.
|
| 1860-70 | New immigrants to US from China and Ireland are attacked. The majority of US citizens of Mexico origin (in US Southwest) see their land taken and civil rights ignored. Some are lynched. Such actions violate the Treaty of Guadalupe Hidalgo.
|
| 1882 | The Chinese Exclusion Act suspends immigration and naturalization of Chinese, who are mostly manual laborers. The number of Mexican immigrants increases.
|
| 1891 | US Immigration Law. The first exhaustive law in US attempting national control of immigration.
|
| 1898 | Spanish-American War. US invades and/or claims control over former Spanish colonies such as Puerto Rico and Cuba (in Caribbean) and Philippines and Guam (in Pacific). Today, Puerto Rico remains a US colony (“protectorate,” “territory”), with Puerto Ricans being US citizens.
|
| 1900-33 | About 1/8 of the entire Mexican population moves to US territory. Primarily this is due to the violence and economic uncertainty of the Mexican Revolution (1910-20). US is the major arms supplier to the various Mexican armies.
|
| 1907 | US economic depression. Roosevelt’s Gentleman’s Agreement pact prohibits entry of Japanese workers.
|
| 1909 | Pact between Mexico and US brings Mexican workers to California for agricultural labor.
|
| 1914 | US marines occupy Veracruz (Mexico).
|
| 1917 | US again imports Mexican workers, facing the scarcity of labor due to entrance of US in WWI. The Immigration Law restricts entry of Asians, and introduces literacy tests and a tax of 8 dollars per head for entrance. Such practices make it difficult for poor and uneducated people to enter legally. US population of German descent and German immigrants viewed with suspicion during WWI and afterwards.
|
| 1920-21 | US Congress proposes a cap or limit of number of Mexican citizens permitted legal entry. US Provisional Quota Law takes a first step toward immigration quotas.
|
| 1924 | US Immigration Law imposes the first system of permanent quotas of different national origins. Privileged are those from Western and Northern Europe. This law lasts until 1952. Also, law establishes the US Border Patrol (la Patrulla Fronteriza), and provides for the deportation of those who become a public burden, violate US laws, or participate in anarchist and seditious acts.
|
| 1929 | The quota system guarantees that most US immigrants are white Europeans. Also, law now provides penalty for undocumented re-entry of previously deported illegal immigrant.
|
| 1930s | Mexicans are one of the scapegoats blamed for Great Depression. Called the “Mexican Menace,” people of Mexican origin are rounded up and deported to Mexico by the tens of thousands. The roundups are chaotic, with many US citizens among the deported.
|
| 1933 | US Labor Department consolidates separated functions of immigration and naturalization, giving origin to the INS (Immigration and Naturalization Service).
|
| 1941 | Mexican immigration increases during WWII. Some of these immigrants enroll in US military, either voluntarily or are drafted. As with African American veterans, many of these Mexican veterans experience racial discrimination (or hate crimes) in the post-war years. Pressured by US, Mexico joins Allies in WWII. In 1945, US Congress awards more Medals of Honor to Mexican and Mexican American veterans than to any other nonwhite racial/ethnic group.
|
| 1942
|
Tens of thousands of US citizens of Japanese origin (Japanese Americans) are despoiled of their property, rounded up and interned in camps supervised by US military. Also, tens of thousands of Jewish refugees are denied US entry. INS is transferred to the Justice Department.
|
| 1942 | The Braceros (“Hired Hands”) Program provides for entry of 5 million Mexican workers to US employers, especially agricultural, during 1940s, 50s, and 60s.
|
| 1943 | Chinese Exclusion Act is ended. The so-called “Zoot Suit Riots” or “Military Disturbances” in LA: for weeks, US military personnel hunt down and beat people of Mexican ancestry in LA.
|
| 1949 | US economic recession sparks large dragnets (roundups) of undocumented workers. When recession returns in 1954, so do the dragnets.
|
| 1952-53 | US Immigration Law. National origin quotas continue. Likewise, quotas continue for immigrants categorized as performing “necessary” services (e.g., Braceros Program). Joseph M. Swing is named head of INS. Swing explicitly proclaims a “professional hatred of Mexicans.” Swing solicits $10 million to construct a 150-mile long barrier along border. Mexicans are targeted for roundups, arrests, and deportation campaigns throughout the 1950s.
|
| 1954 | CIA directs overthrow of democratically elected government in Guatemala.
|
| 1961 | CIA-directed Cuban-exile invasion of Cuba fails.
|
| 1965 | The Immigration and Nationality Law is amended. Discriminatory, pro-white national origin quotas are revoked. A system of family reunification is instituted. A limit of 20,000 per country for the Eastern Hemisphere, and another limit for the Western Hemisphere.
|
| 1965-67 | US marines land in Dominican Republic during DR election campaign. US Green Berets intervene against rebels in Guatemala.
|
| 1968 | Bilingual Education Act is passed by Congress (Telles & Ortiz 2008:318).
|
| 1969 | National Chicano Liberation Youth Conference, held in Denver (APAN:II:808).
|
| 1973 | US troops leave Vietnam. Chicano soldiers (Mexican Americans) receive the highest number of medals for bravery per capita among various ethnic groups. They also die in disproportionately higher numbers, given their enrolled numbers.
|
| 1973 | CIA-backed coup ousts democratically elected president in Chile.
|
| 1975 | Indian Self-Determination and Education Assistance Act passed by Congress, responding to pressure from Native American activists (APAN:II:808).
|
| 1978 | The Immigration and Nationality Law is amended. Limits to 20,000 the number of legal visas offered to Mexican immigrants each year.
|
| 1980 | Refugees Law. Establishes the first permanent US procedure for the admission of refugees. Refugee status is defined in agreement with international terms.
|
| 1981-90 | CIA directs exile (Contra) invasions in Nicaragua.
|
| 1981-92
|
El Salvador civil war: US military advisers and flyovers aid anti-rebels.
|
| 1983-84 | US invasion of Grenada (Caribbean island nation).
|
| 1986 | Immigration Reform and Control Act (IRCA). Authorizes US employers to knowingly contract (hire) undocumented immigrants. Creates programs for legalization; offers amnesty to foreigners who can verify continual US residence since 1982. Also intensifies border scrutiny, increasing militarization of border.
|
| 1990 | Immigration Law increases the limit of legal immigration. Establishes a condition of temporary protection for refugees of armed conflict or natural disaster in country of origin.
|
| 1996 | Rise of punitive criminal justice policy starting with President Reagan’s first term (e.g., War on Drugs). Mandatory detention of anyone seeking asylum in US who lacks valid documentation. Greater enforcement of immigration law at border. A border barrier of 14 miles at Tijuana/San Diego is built. The penalty for smuggling contraband is increased, and for using false documents to cross.
|
| 1997 | The bipartisan Commission for Immigration Reform, appointed by Congress and President Bush in 1990, recommends to abolish the INS and distribute its functions to other federal agencies.
|
| 2000-2003 | US Census (2000) shows that Hispanic and Asian immigrants are transforming the face of many US regions. Hispanics become largest US ethnic minority group by 2003.
|
| 2001 | September 11 attacks lead US to further restrict border entries. Also, former US Bracero Program workers demand compensation for unpaid labor during the Program (1940s-60s).
|
Chapter 13 and Unit IV Summary
Chapter 13 discussed the relationship between post-1945 American globalism and Hispanic immigration. Section 13.1 built on Chapter 12 by discussing U.S. interventionism in Latin America since 1945. The Cold War (1945-1991) continued in many ways earlier U.S. imperialism in Latin America. U.S. military and economic activities had many relationships with post-1965 Hispanic immigration.
Section 13.2 discussed Hispanics, after 2003 the largest U.S. ethnic minority group. Mexican Americans have always been the most numerous of the various Hispanic national-origin groups such as Puerto Ricans, Cubans, Dominicans, etc.
Section 13.3 introduced the relationship of the U.S. with Mexico, its southern neighbor. Their relation has a long history of ambivalence, marked by periods of friendship alternating with ones of hostility. Knowledge about Mexico is increasingly essential for diversity students, given the large and growing proportion of Americans of Mexican ancestry.
Section 13.4 provided an overview of Mexican immigration. One of the major continuities with the pre-1965 period is America’s ongoing love-hate relationship with Mexican labor.
Overall, Unit IV presented the background and current state of immigration from Latin America. It emphasized the relationship between American globalism and post-1965 Hispanic immigration. After a historical review of U.S. imperialism and colonialism to 1945, it introduced modern immigration in comparative perspective, discussing U.S. Cold War interventionism in Latin America and the Mexico-U.S. relationship.
[1] Image credit: Creative Commons (“McDonalds Mexico” by viinzography is licensed under CC BY-NC 2.0)
[2] Source: Wikipedia, “George Ritzer: McDonaldization.” See Ritzer 2013; Weber 1905.
[3] See, e.g., Human Rights Watch. Accessed 3/11/19. https://www.hrw.org/world-report/2018/country-chapters/united-states
[4] Source of phrase “Hispanics, the largest minority”: Schaefer 2015
[5] President Monroe’s (1817-1825) foreign policy of regarding European political involvement in Latin America as a possible aggression against the U.S. Source: Wikipedia, “Monroe Doctrine.” Accessed 7/16/21.
[6] Table 13.1 replicates Table 1.1 for convenience.
[7] Source: Wikipedia, “Demographics of the United States.” Accessed 7/15/21.
[8] Source: Wikipedia, “Demographics of Spain/ Mexico/ Colombia/ Argentina/ Peru.” Accessed 7/15/21.
[9] E.g., post-WWII low female and male age at first marriage, and low proportion of multigenerational households with grandparents (see Coontz 2016). Immigration restrictions, the Great Depression, and WWII all kept immigration low.
[10] Source: Wikipedia, “Demographics of the United States.” Accessed 7/15/21.
[11] “The Pine Trees,” located in Chapultepec Park, Mexico City.
[12] Source: Adapted from Wikipedia, “List of states of Mexico.” Accessed 7/15/21.
[13] Image credit: Wikivoyage (Creative Commons license).
[14] For example, Mexican advertising and television have long featured lighter-skinned people far out of proportion to their numbers in local and national populations. This has also been a longstanding pattern in Brazil (Telles 2004:155).
[15] In contrast to Skerry’s (1993) emphasis on Mexican American ambivalence toward the U.S., I emphasize U.S. ambivalence toward Mexican Americans.
[16] Two recent discussions of 1930s deportation are:
(2) https://www.history.com/news/great-depression-repatriation-drives-mexico-deportation
