13
Understanding standardized testing is very important for beginning teachers as K-12 teaching is increasingly influenced by the administration and results of standardized tests. Teachers also need to be able to help parents and students understand test results. Consider the following scenarios.
a. Vanessa, a newly licensed physical education teacher, is applying for a job at a middle school. During the job interview the principal asks how she would incorporate key sixth grade math skills into her PE and health classes as the sixth grade students in the previous year did not attain Adequate Yearly Progress in mathematics.
b. Danielle, a first year science teacher in Ohio, is asked by Mr Volderwell, a recent immigrant from Turkey and the parent of a tenth grade son Marius, to help him understand test results. When Marius first arrived at school he took the Test of Cognitive Skills and scored on the eighty- fifth percentile whereas on the state Science Graduation test he took later in the school year he was classified as “proficient” .
c. James, a third year elementary school teacher, attends a class in gifted education over summer as standardized tests from the previous year indicated that while overall his class did well in reading the top 20 per cent of his students did not learn as much as expected.
d. Miguel, a 1st grade student, takes two tests in fall and the results indicate that his grade equivalent scores are 3.3 for reading and 3.0 for math. William’s parents want him immediately promoted into the second grade arguing that the test results indicate that he already can read and do math at the 3rd grade level. Greg, a first grade teacher explains to William’s parents that a grade equivalent score of 3.3 does not mean William can do third grade work.
Understanding standardized testing is difficult as there are numerous terms and concepts to master and recent changes in accountability under the No Child Left Behind Act of 2001 (NCLB) have increased the complexity of the concepts and issues. In this chapter we focus on the information that beginning teachers need to know and start with some basic concepts.
Basic concepts
Standardized tests are created by a team—usually test experts from a commercial testing company who consult classroom teachers and university faculty—and are administered in standardized ways. Students not only respond to the same questions they also receive the same directions and have the same time limits. Explicit scoring criteria are used. Standardized tests are designed to be taken by many students within a state, province, or nation, and sometimes across nations. Teachers help administer some standardized tests and test manuals are provided that contain explicit details about the administration and scoring. For example, teachers may have to remove all the posters and charts from the classroom walls, read directions out loud to students using a script, and respond to student questions in a specific manner.
Criterion referenced standardized tests measure student performance against a specific standard or criterion. For example, newly hired firefighters in the Commonwealth of Massachusetts in the United States have to meet physical fitness standards by successfully completing a standardized physical fitness test that includes stair climbing, using a ladder, advancing a hose, and simulating a rescue through a doorway (Human Resources Division, nod.). Criterion referenced tests currently used in US schools are often tied to state content standards and provide information about what students can and cannot do. For example, one of the content standards for fourth grade reading in Kentucky is “Students will identify and describe the characteristics of fiction, nonfiction, poetry or plays” (Combined Curriculum Document Reading 4.1, 2006) and so a report on an individual student would indicate if the child can accomplish this skill. The report may state that number or percentage of items that were successfully completed (e.g. 15 out of 20, i.e. 75 per cent) or include descriptions such as basic, proficient, or advanced which are based on decisions made about the percent of mastery necessary to be classified into these categories.
Norm referenced standardized tests report students’ performance relative to others. For example, if a student scores on the seventy-second percentile in reading it means she outperforms 72 percent of the students who were included in the test’s norm group. A norm group is a representative sample of students who completed the standardized test while it was being developed. For state tests the norm group is drawn from the state whereas for national tests the sample is drawn from the nation. Information about the norm groups is provided in a technical test manual that is not typically supplied to teachers but should be available from the person in charge of testing in the school district.
Reports from criterion and norm referenced tests provide different information. Imagine a nationalized mathematics test designed to basic test skills in second grade. If this test is norm referenced, and Alisha receives a report indicating that she scored in the eighty-fifth percentile this indicates that she scored better than 85 per cent of the students in the norm group who took the test previously. If this test is criterion-referenced Alisha’s report may state that she mastered 65 per cent of the problems designed for her grade level. The relative percentage reported from the norm-referenced test provides information about Alisha’s performance compared to other students whereas the criterion referenced test attempts to describe what Alisha or any student can or cannot do with respect to whatever the test is designed to measure. When planning instruction classroom teachers need to know what students can and cannot do so criterion referenced tests are typically more useful (Popham, 2004). The current standard-based accountability and NCLB rely predominantly on criterion based tests to assess attainment of content-based standards. Consequently the use of standardized norm referenced tests in schools has diminished and is largely limited to diagnosis and placement of children with specific cognitive disabilities or exceptional abilities (Haertel & Herman, 2005).
Some recent standardized tests can incorporate both criterion-referenced and norm referenced elements in to the same test (Linn & Miller, 2005). That is, the test results not only provide information on mastery of a content standard but also the percentage of students who attained that level of mastery.
Standardized tests can be high stakes i.e. performance on the test has important consequences. These consequences can be for students, e.g. passing a high school graduation test is required in order to obtain a diploma or passing PRAXIS II is a prerequisite to gain a teacher license. These consequences can be for schools, e.g. under NCLB an increasing percentage of students in every school must reach proficiency in math and reading each year. Consequences for schools who fail to achieve these gains include reduced funding and restructuring of the school building. Under NCLB, the consequences are designed to be for the schools not individual students (Popham, 2005) and their test results may not accurately reflect what they know because students may not try hard when the tests have low stakes for them (Wise & DeMars, 2005).
Uses of standardized tests
Standardized tests are used for a variety of reasons and the same test is sometimes used for multiple purposes.
Assessing students’ progress in a wider context
Well-designed teacher assessments provide crucial information about each student’s achievement in the classroom. However, teachers vary in the types of assessment they use so teacher assessments do not usually provide information on how students’ achievement compares to externally established criteria. Consider two eighth grade students, Brian and Joshua, who received As in their middle school math classes. However, on the standardized norm referenced math test Brian scored in the fiftieth percentile whereas Joshua scored in the ninetieth percentile. This information is important to Brian and Joshua, their parents, and the school personnel. Likewise, two third grade students could both receive Cs on their report card in reading but one may pass 25 per cent and the other 65 per cent of the items on the Criterion Referenced State Test.
There are many reasons that students’ performance on teacher assessments and standardized assessments may differ. Students may perform lower on the standardized assessment because their teachers have easy grading criteria, or there is poor alignment between the content they were taught and that on the standardized test, or they are unfamiliar with the type of items on the standardized tests, or they have test anxiety, or they were sick on the day of the test. Students may perform higher on the standardized test than on classroom assessments because their teachers have hard grading criteria, or the student does not work consistently in class (e.g. does not turn in homework) but will focus on a standardized test, or the student is adept at the multiple choice items on the standardized tests but not at the variety of constructed response and performance items the teacher uses. We should always be very cautious about drawing inferences from one kind of assessment.
In some states, standardized achievement tests are required for home-schooled students in order to provide parents and state officials information about the students’ achievement in a wider context. For example, in New York home-schooled students must take an approved standardized test every other year in grades four through eight and every year in grades nine through twelve. These tests must be administered in a standardized manner and the results filed with the Superintendent of the local school district. If a student does not take the tests or scores below the thirty-third percentile the home schooling program may be placed on probation (New York State Education Department, 2005).
Diagnosing student’s strengths and weaknesses
Standardized tests, along with interviews, classroom observations, medical examinations, and school records are used to help diagnose students’ strengths and weaknesses. Often the standardized tests used for this purpose are administered individually to determine if the child has a disability. For example, if a kindergarten child is having trouble with oral communication, a standardized language development test could be administered to determine if there are difficulties with understanding the meaning of words or sentence structures, noticing sound differences in similar words, or articulating words correctly (Peirangelo & Guiliani, 2002). It would also be important to determine if the child was a recent immigrant, had a hearing impairment or mental retardation. The diagnosis of learning disabilities typically involves the administration of at least two types of standardized tests—an aptitude test to assess general cognitive functioning and an achievement test to assess knowledge of specific content areas (Peirangelo & Guiliani, 2006). We discuss the difference between aptitude and achievement tests later in this chapter.
Selecting students for specific programs
Standardized tests are often used to select students for specific programs. For example, the SAT (Scholastic Assessment Test) and ACT (American College Test) are norm referenced tests used to help determine if high school students are admitted to selective colleges. Norm referenced standardized tests are also used, among other criteria, to determine if students are eligible for special education or gifted and talented programs. Criterion referenced tests are used to determine which students are eligible for promotion to the next grade or graduation from high school. Schools that place students in ability groups including high school college preparation, academic, or vocational programs may also use norm referenced or criterion referenced standardized tests. When standardized tests are used as an essential criteria for placement they are obviously high stakes for students.
Assisting teachers’ planning
Norm referenced and criterion referenced standardized tests, among other sources of information about students, can help teachers make decisions about their instruction. For example, if a social studies teacher learns that most of the students did very well on a norm referenced reading test administered early in the school year he may adapt his instruction and use additional primary sources. A reading teacher after reviewing the poor end-of- the-year criterion referenced standardized reading test results may decide that next year she will modify the techniques she uses. A biology teacher may decide that she needs to spend more time on genetics as her students scored poorly on that section of the standardized criterion referenced science test. These are examples of assessment for learning which involves data-based decision making. It can be difficult for beginning teachers to learn to use standardized test information appropriately, understanding that test scores are important information but also remembering that there are multiple reasons for students’ performance on a test.
Accountability
Standardized tests results are increasingly used to hold teachers and administrators accountable for students’ learning. Prior to 2002, many States required public dissemination of students’ progress but under NCLB school districts in all states are required to send report cards to parents and the public that include results of standardized tests for each school. Providing information about students’ standardized tests is not new as newspapers began printing summaries of students’ test results within school districts in the 1970s and 1980s (Popham, 2005). However, public accountability of schools and teachers has been increasing in the US and many other countries and this increased accountability impacts the public perception and work of all teachers including those teaching in subjects or grade levels not being tested.
For example, Erin, a middle school social studies teacher, said:
“As a teacher in a ‘non-testing’ subject area, I spend substantial instructional time suporting the standardized testing requirements. For example, our school has instituted ‘word of the day’, which encourages teachers to use, define, and incorporate terminology often used in the tests (e.g. “compare”, “oxymoron” etc.). I use the terms in my class as often as possible and incorporate them into written assignments. I also often use test questions of similar formats to the standardized tests in my own subject assessments (e.g. multiple choice questions with double negatives, short answer and extended response questions) as I believe that practice in the test question formats will help students be more successful in those subjects that are being assessed.”
Accountability and standardized testing are two components of Standards Based Reform in Education that was initiated in the USA in 1980s. The two other components are academic content standards which are described later in this chapter and teacher quality which was discussed in Chapter 1.
Types of standardized tests
Achievement tests
Summarizing the past: K-12 achievement tests are designed to assess what students have learned in a specific content area. These tests include those specifically designed by states to access mastery of state academic content standards (see more details below) as well as general tests such as the California Achievement Tests, The Comprehensive Tests of Basic Skills, Iowa Tests of Basic Skills, Metropolitan Achievement Tests, and the Stanford Achievement Tests. These general tests are designed to be used across the nation and so will not be as closely aligned with state content standards as specifically designed tests. Some states and Canadian Provinces use specifically designed tests to assess attainment of content standards and also a general achievement test to provide normative information.
Standardized achievement tests are designed to be used for students in kindergarten though high school. For young children questions are presented orally, and students may respond by pointing to pictures, and the subtests are often not timed. For example, on the Iowa Test of Basic Skills (http://www.riverpub.com/) designed for students are young as kindergarten the vocabulary test assesses listening vocabulary. The teacher reads a word and may also read a sentence containing the word. Students are then asked to choose one of three pictorial response options.
Achievement tests are used as one criterion for obtaining a license in a variety of professions including nursing, physical therapy, and social work, accounting, and law. Their use in teacher education is recent and is part of the increased accountability of public education and most States require that teacher education students take achievement tests in order to obtain a teaching license. For those seeking middle school and high school licensure these are tests are in the content area of the major or minor (e.g. mathematics, social studies); for those seeking licenses in early childhood and elementary the tests focus on knowledge needed to teach students of specific grade levels. The most commonly used tests, the PRAXIS series, tests I and II, developed by Educational Testing Service, include three types of tests (www.ets.org):
-
- Subject Assessments, these test on general and subject-specific teaching skills and knowledge. They include both multiple-choice and constructed-response test items.
-
- Principles of Learning and Teaching (PLT) Tests assess general pedagogical knowledge at four grade levels: Early Childhood, K-6, 5-9, and 7-12. These tests are based on case studies and include constructed-response and multiple-choice items. Much of the content in this textbook is relevant to the PLT tests.
-
- Teaching Foundations Tests assess pedagogy in five areas: multi-subject (elementary), English, Language Arts, Mathematics, Science, and Social Science.
These tests include constructed-response and multiple-choice items which tests teacher education students. The scores needed in order to pass each test vary and are determined by each state.
Diagnostic tests
Profiling skills and abilities: Some standardized tests are designed to diagnose strengths and weaknesses in skills, typically reading or mathematics skills. For example, an elementary school child may have difficult in reading and one or more diagnostic tests would provide detailed information about three components: (1) word recognition, which includes phonological awareness (pronunciation), decoding, and spelling; (2) comprehension which includes vocabulary as well as reading and listening comprehension, and (3) fluency (Joshi 2003). Diagnostic tests are often administered individually by school psychologists, following standardized procedures. The examiner typically records not only the results on each question but also observations of the child’s behavior such as distractibility or frustration. The results from the diagnostic standardized tests are used in conjunction with classroom observations, school and medical records, as well as interviews with teachers, parents and students to produce a profile of the student’s skills and abilities, and where appropriate diagnose a learning disability.
Aptitude tests
Predicting the future: Aptitude tests, like achievement tests, measure what students have learned, but rather than focusing on specific subject matter learned in school (e.g. math, science, English or social studies), the test items focus on verbal, quantitative, problem solving abilities that are learned in school or in the general culture (Linn & Miller, 2005). These tests are typically shorter than achievement tests and can be useful in predicting general school achievement. If the purpose of using a test is to predict success in a specific subject (e.g. language arts) the best prediction is past achievement in language arts and so scores on a language arts achievement test would be useful. However when the predictions are more general (e.g. success in college) aptitude tests are often used. According to the test developers, both the ACT and SAT Reasoning tests, used to predict success in college, assess general educational development and reasoning, analysis and problem solving as well as questions on mathematics, reading and writing (http://www.collegeboard.com; http://www.act.org/). The SAT Subject Tests that focus on mastery of specific subjects like English, history, mathematics, science, and language are used by some colleges as entrance criteria and are more appropriately classified as achievement tests than aptitude tests even though they are used to predict the future.
Tests designed to assess general learning ability have traditionally been called Intelligence Tests but are now often called learning ability tests, cognitive ability tests, scholastic aptitude tests, or school ability tests. The shift in terminology reflects the extensive controversy over the meaning of the term intelligence and that its traditional use was associated with inherited capacity (Linn & Miller 2005). The more current terms emphasize that tests measure developed ability in learning not innate capacity. The Cognitive Abilities Test assesses K-12 students’ abilities to reason with words, quantitative concepts, and nonverbal (spatial) pictures. The Woodcock Johnson III contains cognitive abilities tests as well as achievement tests for ages 2 to 90 years (http://www.riverpub.com).
High-stakes testing by states
While many States had standardized testing programs prior to 2000, the number of state-wide tests has grown enormously since then because NCLB required that all states test students in reading and mathematics annually in grades third through eighth and at least once in high school by 2005-6. Twenty-three states expanded their testing programs during 2005-6 and additional tests are being added as testing in science is required by 2007-8. Students with disabilities and English language learners must be included in the testing and provided a variety of accommodations so the majority of staff in school districts are involved in testing in some way (Olson, 2005). In this section we focus on these tests and their implications for teachers and students.
Standards based assessment
Academic content standards
NCLB mandates that states must develop academic content standards that specify what students are expected to know or be able to do at each grade level. These content standards used to be called goals and objectives and it is not clear why the labels have changed (Popham, 2004). Content standards are not easy to develop—if they are too broad and not related to grade level, teachers cannot hope to prepare students to meet the standards.
An example, a broad standard in reading is:
“Students should be able to construct meaning through experiences with literature, cultural events and philosophical discussion” (no grade level indicated). (American Federation of Teachers, 2006, p. 6).
Standards that are too narrow can result in a restricted curriculum. An example of a narrow standard might be:
Students can define, compare and contrast, and provide a variety of examples of synonyms and antonyms.
A stronger standard is:
“Students should apply knowledge of word origins, derivations, synonyms, antonyms, and idioms to determine the meaning of words (grade 4) (American Federation of Teachers, 2006, p. 6).
The American Federation of Teachers conducted a study in 2005-6 and reported that some of the standards in reading, math and science were weak in 32 states. States set the strongest standards in science followed by mathematics. Standards in reading were particularly problematic and with one-fifth of all reading standards redundant across the grade levels, i.e. word-by-word repetition across grade levels at least 50 per cent of the time (American Federation of Teachers, 2006).
Even if the standards are strong, there are often so many of them that it is hard for teachers to address them all in a school year. Content standards are developed by curriculum specialists who believe in the importance of their subject area so they tend to develop large numbers of standards for each subject area and grade level. At first glance, it may appear that there are only several broad standards, but under each standard there are subcategories called goals, benchmarks, indicators or objectives (Popham, 2004). For example, Idaho’s first grade mathematics standard, judged to be of high quality (AFT 2000) contains five broad standards, including 10 goals and a total of 29 objectives (Idaho Department of Education, 2005-6).
Alignment of standards, testing and classroom curriculum
The state tests must be aligned with strong content standards in order to provide useful feedback about student learning. If there is a mismatch between the academic content standards and the content that is assessed then the test results cannot provide information about students’ proficiency on the academic standards. A mismatch not only frustrates the students taking the test, teachers, and administrators it undermines the concept of accountability and the “theory of action” (See box “Deciding for yourself about the research”) that underlies the NCLB. Unfortunately, the 2006 Federation of Teachers study indicated that in only 11 states were all the tests aligned with state standards (American Federation of Teachers, 2006).
State standards and their alignment with state assessments should be widely available—preferably posted on the states websites so they can be accessed by school personnel and the public. A number of states have been slow to do this.Table 43 summarizes which states had strong content standards, tests that were aligned with state standards, and adequate documents on online. Only 11 states were judged to meet all three criteria in 2006.
Table 43: Strong content standards, alignment, and transparency: evaluation for each state in 2006 (Adapted from American Federation of Teachers, 2006).
|
|
Standards are strong |
Test documents match standards |
Testing documents online |
|
Alabama |
|
|
+ |
|
Alaska |
|
+ |
+ |
|
Arizona |
|
+ |
+ |
|
Arkansas |
|
+ |
|
|
California |
+ |
+ |
+ |
|
Colorado |
|
|
|
|
Connecticut |
|
|
|
|
Delaware |
|
+ |
|
|
District of Columbia |
+ |
+ |
|
|
Florida |
|
+ |
+ |
|
Georgia |
+ |
|
+ |
|
Hawaii |
|
+ |
|
|
Idaho |
+ |
|
|
|
Illinois |
|
|
+ |
|
Indiana |
|
+ |
+ |
|
Iowa |
|
+ |
|
|
Kansas |
|
+ |
+ |
|
Kentucky |
|
+ |
+ |
|
Louisiana |
+ |
+ |
+ |
|
Maine |
|
+ |
|
|
Maryland |
|
+ |
|
|
Massachusetts |
+ |
+ |
|
|
Michigan |
+ |
+ |
|
|
Minnesota |
|
+ |
+ |
|
Mississippi |
|
|
+ |
|
Missouri |
|
|
|
|
Montana |
|
|
|
|
Nebraska |
|
|
|
|
Nevada |
+ |
+ |
+ |
|
New Hampshire |
|
+ |
+ |
|
New Jersey |
+ |
|
|
|
New Mexico |
+ |
+ |
+ |
|
New York |
+ |
+ |
+ |
|
North Carolina |
+ |
|
|
|
North Dakota |
+ |
+ |
|
|
Ohio |
+ |
+ |
+ |
|
Oklahoma |
|
+ |
+ |
|
Oregon |
|
+ |
+ |
|
Pennsylvania |
|
|
+ |
|
Rhode Island |
|
+ |
+ |
|
South Carolina |
|
|
|
|
South Dakota |
+ |
|
+ |
|
Tennessee |
+ |
+ |
+ |
|
Texas |
|
+ |
+ |
|
Utah |
|
|
+ |
Sampling content
When numerous standards have been developed it is impossible for tests to assess all of the standards every year, so the tests sample the content, i.e. measure some but not all the standards every year. Content standards cannot be reliably assessed with only one or two items so the decision to assess one content standard often requires not assessing another. This means if there are too many content standards a significant proportion of them are not measured each year. In this situation, teachers try to guess which content standards will be assessed that year and align their teaching on those specific standards. Of course if these guesses are incorrect students will have studied content not on the test and not studied content that is on the test. Some argue that this is a very serious problem with current state testing and Popham (2004) an expert on testing even said: “What a muddleheaded way to run a testing program.” (p. 79)
Adequate Yearly Progress (AYP)
Under NCLB three levels of achievement, basic, proficient and advanced, must be specified for each grade level in each content area by each state. States were required to set a time table from 2002 that insured an increasing percentage of students would reach the proficient levels such that by 2013-14, soevery child is performing at or the proficient level. Schools and school districts who meet this timetable are said to meet adequate yearly progress (AYP).
Because every child must reach proficiency by 2013-14 greater increases are required for those schools that had larger percentages of initially lower performing students.
Exhibit 16 illustrates the progress needed in three hypothetical schools. School A, initially the lowest performing school, has to increase the number of students reaching proficiency by an average of 6 per cent each year, the increase is 3 per cent for School B, and the increase is only 1 per cent for School C. Also, the checkpoint targets in the timetables are determined by the lower performing schools. This is illustrated on the figure by the arrow—it is obvious that School A has to make significant improvements by 2007-8 but School C does not have to improve at all by 2007-8. This means that schools that are initially lower performing are much more likely to fail to make AYP during the initial implementation years of NCLB.
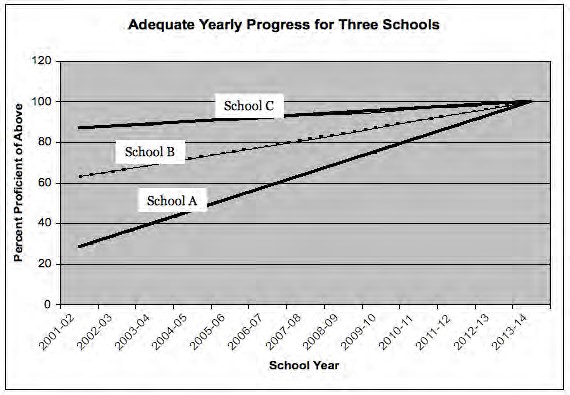
Exhibit 15: Adequate Yearly Progress requires greater student improvement in schools with lower levels of initial proficiency
Schools A, B and C all must reach 10 per cent student proficiency by 2013-14. However the school that initially has the lowest level of performance (A) has to increase the percentage of students proficient at a greater rate than schools with middle (B) or high (C) levels of initial proficiency rates.
Subgroups
For a school to achieve AYP not only must overall percentages of the students reach proficiency but subgroups must also reach proficiency in a process called desegregation. Prior to NCLB state accountability systems typically focused on overall student performance but this did not provide incentives for schools to focus on the neediest students, e.g. those children living below the poverty line (Hess & Petrilli, 2006). Under NCLB the percentages for each racial/ethnic group in the school (white, African American, Latino, Native American etc.), low income students, students with limited English proficiency, and students with disabilities are all calculated if there are enough students in the subgroup. A school may fail AYP if one group, e.g. English language learners do not make adequate progress. This means that it is more difficult for large diverse schools (typically urban schools) that have many subgroups to meet the demands of AYP than smaller schools with homogeneous student body (Novak & Fuller, 2003). Schools can also fail to make AYP if too few students take the exam. The drafters of the law were concerned that some schools might encourage low-performing students to stay home on the days of testing in order to artificially inflate the scores. So on average at least 95 per cent of any subgroup must take the exams each year or the school may fail to make AYP (Hess & Petrilli, 2006).
Sanctions
Schools failing to meet AYP for consecutive years, experience a series of increasing sanctions. If a school fails to make AYP for two years in row it is labeled “in need of improvement” and school personnel must come up with a school improvement plan that is based on “scientifically based research”. In addition, students must be offered the option of transferring to a better performing public school within the district. If the school fails for three consecutive years, free tutoring must be provided to needy students. A fourth year of failure requires “corrective actions” which may include staffing changes, curriculum reforms or extensions of the school day or year. If the school fails to meet AYP for five consecutive years the district must “restructure” which involves major actions such as replacing the majority of the staff, hiring an educational management company, turning the school over to the state.
Growth or value added models
One concern with how AYP is calculated is that it is based on an absolute level of student performance at one point in time and does not measure how much students improve during each year. To illustrate this, Exhibit 16 shows six students whose science test scores improved from fourth to fifth grade. The circle represents a student’s score in fourth grade and the tip of the arrow the test score in fifth grade. Note that students 1, 2, and 3 all reach the level of proficiency (the horizontal dotted line) but students 4, 5 and 6 do not. However, also notice that students 2, 5 and 6 improved much more than students 1, 3, and 4. The current system of AYP rewards students reaching the proficiency level rather than students’ growth. This is a particular problem for low performing schools who may be doing an excellent job of improving achievement (students 5 and 6) but do not make the proficiency level. The US Department of Education in 2006 allowed some states to include growth measures into their calculations of AYP. While growth models traditionally tracked the progress of individual students, the term is sometimes used to refer to growth of classes or entire schools (Shaul, 2006).
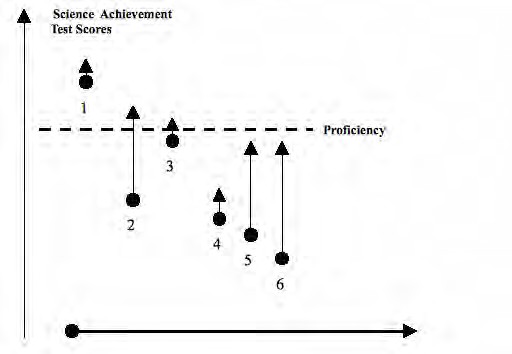
Exhibit 16: An illustration of value added vs proficiency approach to assessment. Each arrow represents the mathematics achievement results of one student who was tested in the fourth grade (shown by the dot) and also the fifth grade (shown by the tip of the arrow).
Some states include growth information on their report cards. For example, Tennessee (http://www.k- 12.state.tn.us/rptcrd05/) provides details on which schools meet the AYP but also whether the students’ scores on tests represent average growth, above average, or below average growth within the state. Exhibit 17 illustrates in a simple way the kind of information that is provided. Students in schools A, B, and C all reached proficiency and AYP but in Schools D, E, and F did not. However, students in schools A and D had low growth, in schools B and E average growth, in schools C and F high growth. Researchers have found that in some schools students have high levels of achievement but do not grow as much as expected (School A), and also that in some schools, the achievement test scores are not high but the students are growing or learning a lot (School F). These are called “school effects” and represent the effect of the school on the learning of the students.
| Achievement |
School A |
School B |
School C |
Proficiency |
|
School D |
School E |
School F |
||
| Low growth | Average growth | High growth | ||
| Exhibit 17: Proficiency and growth information | ||||
Growth over one year
Schools can vary on overall school achievement (proficiency) as well as the amount of growth in student learning, For example schools A, B, and C all have high achievement levels but only in School C do students have, on average, high growth. Schools D, C, and F all have low levels of proficiency but only in school D do students, on average, have low growth.
Growth models have intuitive appeal to teachers as they focus on how much a student learned during the school year—not what the student knew at the start of the school year. The current research evidence suggests that teachers matter a lot—i.e. students learn much more with some teachers than others. For example, in one study low-achieving fourth grade students in Dallas, Texas were followed for three years and 90 per cent of those who had effective teachers passed the seventh grade math test whereas only 42 per cent of those with ineffective teachers passed (cited in Bracey, 2004). Unfortunately, the same study reported that low achieving students were more likely to be assigned to ineffective teachers for three years in a row than high achieving students. Some policy makers believe that teachers who are highly effective should receive rewards including higher salaries or bonuses and that a primary criterion of effectiveness is assessed by growth models, i.e. how much students learn during a year (Hershberg, 2004). However, using growth data to make decisions about teachers is controversial as there is much more statistical uncertainty when using growth measures for a small group or students (e.g. one teacher’s students) than larger groups (e.g. all fourth graders in a school district).
Growth models are also used to provide information about the patterns of growth among subgroups of students that may arise from the instructional focus of the teachers. For example, it may be that highest performing students in the classroom gain the most and the lowest performing students gain the least. This suggests that the teacher is focusing on the high achieving students and giving less attention to low achieving students. In contrast, it may be the highest performing students gain the least and the low performing students grow the most suggesting the teacher focuses on the low performing students and paying little attention to the high performing students. If the teacher focuses on the students “in the middle” they may grow the most and the highest and lowest performing students grow the least. Proponents of the value-added or growth models argue that teachers can use this information to help them make informed decisions about their teaching (Hershberg, 2004).
Differing state standards
Under NCLB each state devises their own academic content standards, assessments, and levels of proficiency. Some researchers have suggested that the rules of NCLB have encouraged states to set low levels of proficiency so it is easier to meet AYP each year (Hoff, 2002). Stringency of state levels of proficiency can be examined by comparing state test scores to scores on a national achievement test called the National Assessment of Educational Progress (NAEP). NCLB requires that states administer reading and math NAEP tests to a sample of fourth and eighth grade students every other year. The NAEP is designed to assess the progress of students at the state-wide or national level not individual schools or students and is widely respected as a well designed test that uses current best practices in testing. A large percentage of each test includes constructed-response questions and questions that require the use of calculators and other materials (http://nces.ed.gov/nationsreportcard).
Exhibit 18 illustrates that two states, Colorado and Missouri had very different state performance standards for the fourth grade reading/language arts tests in 2003. On the state assessment 67 per cent of the students in Colorado but only 21 per cent of the students in Missouri were classified as proficient. However, on the NAEP tests 34 per cent of Colorado students and 28 per cent of Missouri students were classified as proficient (Linn 2005). These differences demonstrate that there is no common meaning in current definitions of “proficient achievement” established by the states.
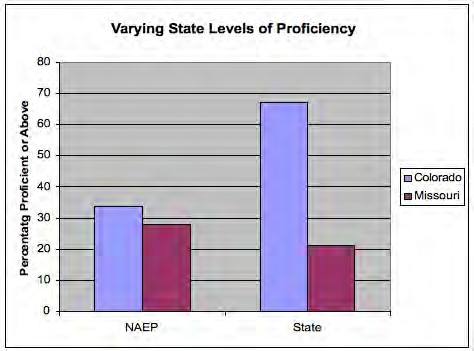
Exhibit 18: Relationship between state proficiency levels and scores on NAEP (Adapted from Linn 2005)
Implications for beginning teachers:
Dr Mucci is the principal of a suburban fourth through sixth grade school in Ohio that continues to meet AYP. We asked her what beginning teachers should know about high stakes testing by the states. “I want beginning teachers to be familiar with the content standards in Ohio because they clearly define what all students should know and be able to do. Not only does teaching revolve around the standards, I only approve requests for materials or professional development if these are related to the standards. I want beginning teachers to understand the concept of data-based decision making. Every year I meet with all the teachers in each grade level (e.g. fourth grade) to look for trends in the previous year’s test results and consider remedies based on these trends. I also meet with each teacher in the content areas that are tested and discuss every student’s achievement in his or her class so we can develop an instructional plan for every student. All interventions with students are research based. Every teacher in the school is responsible for helping to implement these instructional plans, for example the music or art teachers must incorporate some reading and math into their classes. I also ask all teachers to teach test taking skills, by using similar formats to the state tests, enforcing time limits, making sure students learn to distinguish between questions that required an extended response using complete sentences versus those that only requires one or two words, and ensuring that students answer what is actually being asked. We begin this early in the school year and continue to work on these skills, so by spring, students are familiar with the format, and therefore less anxious about the state test. We do everything possible to set each student up for success.”
The impact of testing on classroom teachers does not just occur in Dr Mucci’s middle school. A national survey of over 4,000 teachers indicated that the majority of teachers reported that the state mandated tests were compatible with their daily instruction and were based on curriculum frameworks that all teachers should follow. The majority of teachers also reported teaching test taking skills and encouraging students to work hard and prepare. Elementary school teachers reported greater impact of the high stakes tests: 56 per cent reported the tests influenced their teaching daily or a few times a week compared to 46 per cent of middle school teacher and 28 per cent of high school teachers. Even though the teachers had adapted their instruction because of the standardized tests they were skeptical about them with 40 per cent reporting that teachers had found ways to raise test scores without improving student learning and over 70 per cent reporting that the test scores were not an accurate measure of what minority students know and can do (Pedulla, Abrams, Madaus, Russell, Ramos, & Miao; 2003).
International testing
Testing in the Canadian provinces
Canada has developed a system of testing in the provinces as well as national testing. Each province undertakes its own curriculum based assessments. At the elementary school level provinces assess reading and writing (language arts) as well as mathematics (also called numeracy). In the middle grades science and social studies is often assessed in addition to language arts and mathematics. Summary results of these tests are published but there are no specific consequences for poor performance for schools. In addition, these tests are not high stakes for students. At the secondary school level high stakes curriculum based exit tests are common (http://edudata.educ.ubc.ca/Data_Pages/PanCan.htm).
Canada has developed pan-Canada assessment in mathematics, reading and writing, and science that are administered to a random sample of schools across the country. These assessments are intended to determine whether, on average, students across Canada reach similar levels of performance at about the same age (http://www.cmec.ca/pcap/indexe.stm). They are not intended to provide individual feedback to students are similar in purpose to the NAEP tests administered in the United States.
International comparisons
Along with the increasing globalization has come an interest with international comparisons in educational achievement and practices and more than 40 countries participate in two major testing initiatives. The Trends in International Mathematics and Science Study (TIMSS) have assessed students in fourth and eighth grades four times through 2007. The Programme for International Assessment (PISA) have assessed 15-year-olds in reading, mathematical and science literacy in more than forty countries on three times since 2000. The items on both series of tests include multiple choice, short answer and constructed response formats and are translated into more than 30 languages.
Policy makers are often interested in the comparison of average students’ scores across countries. For example, in eighth grade science on the 2003 TIMMS students from Canada, United States, Hong Kong, and Australia scored significantly higher than the international average whereas students from Egypt, Indonesia, and the Philippines scored significantly below the international average (TIMMS 2003). On the mathematics test in the 2003 PISA, 15- year-old students from Hong Kong, China and Finland scored higher than students from Canada and New Zealand who in turn scored higher than the students from United States and Spain, who in turn scored higher than the student from Mexico and Brazil (OECD, 2004).
Both series of tests also collect survey data from students, teachers or school principals allowing for information about instructional practices and student characteristics. For example, teachers from the Philippines report spending almost twice as much time teaching science to fourth graders than in the United States (Martin, Mullis, Gonzalez, & Chrostowski, (2004). Student reports from PISA indicate that there is considerable cross-country variation in how much students feel anxiety when doing mathematics. Students in France, Italy, Japan, Korea report feeling the most anxious whereas students in Denmark, Finland and Netherlands and Sweden feel the least anxious (OECD 2004).
Understanding test results
In order to understand test results from standardized tests it is important to be familiar with a variety of terms and concepts that are fundamental to “measurement theory”, the academic study of measurement and assessment. Two major areas in measurement theory, reliability and validity, were discussed in the previous chapter; in this chapter we focus on concepts and terms associated with test scores.
The basics
Frequency distributions
A frequency distribution is a listing of the number of students who obtained each score on a test. If 31 students take a test, and the scores range from 11 to 30 then the frequency distribution might look like Table 44. We also show the same set of scores on a histogram or bar graph in Exhibit 20. The horizontal (or x axis) represents the score on the test and the vertical axis (y axis) represents the number or frequency of students. Plotting a frequency distribution helps us see what scores are typical and how much variability there are in the scores. We describe more precise ways of determining typical scores and variability next.
Table 44: Frequency distribution for 30 scores
|
Score on test |
Frequency |
Central tendency measures |
|
17 |
1 |
|
|
18 |
1 |
|
|
19 |
0 |
|
|
20 |
3 |
|
|
21 |
2 |
|
|
22 |
6 |
Mode |
|
23 |
3 |
Median |
|
24 |
2 |
Mean |
|
25 |
0 |
|
|
26 |
2 |
|
|
27 |
6 |
Mode |
|
28 |
2 |
|
|
29 |
2 |
|
|
30 |
1 |
|
|
TOTAL |
31 |
|
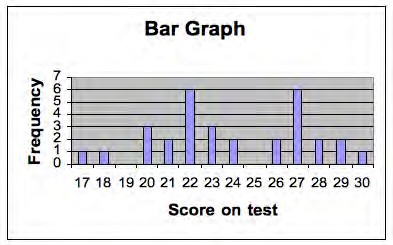
Exhibit 19: Tests scores from Table 44 represented as a bar graph
Central tendency and variability
There are three common ways of measuring central tendency or which score(s) are typical. The mean is calculated by adding up all the scores and dividing by the number of scores. In the example in Table 44, the mean is 24. The median is the “middle” score of the distribution—that is half of the scores are above the median and half are below. The median on the distribution is 23 because 15 scores are above 23 and 15 are below. The mode is the score that occurs most often. In Table 44 there are actually two modes 22 and 27 and so this distribution is described as bimodal. Calculating the mean, median and mode are important as each provides different information for teachers. The median represents the score of the “middle” students, with half scoring above and below, but does not tell us about the scores on the test that occurred most often. The mean is important for some statistical calculations but is highly influenced by a few extreme scores (called outliers) but the median is not. To illustrate this, imagine a test out of 20 points taken by 10 students, and most do very well but one student does very poorly. The scores might be 4, 18, 18, 19, 19, 19, 19, 19, 20, 20. The mean is 17.5 (170/10) but if the lowest score (4) is eliminated the mean is now is 1.5 points higher at 19 (171/9). However, in this example the median remains at 19 whether the lowest score is included. When there are some extreme scores the median is often more useful for teachers in indicating the central tendency of the frequency distribution.
The measures of central tendency help us summarize scores that are representative, but they do not tell us anything about how variable or how spread out are the scores. Exhibit 20 illustrates sets of scores from two different schools on the same test for fourth graders. Note that the mean for each is 40 but in School A the scores are much less spread out. A simple way to summarize variability is the range, which is the lowest score subtracted from the lowest score. In School A with low variability the range is (45—35) = 10; in the school B the range is ( 55- 22 = 33).
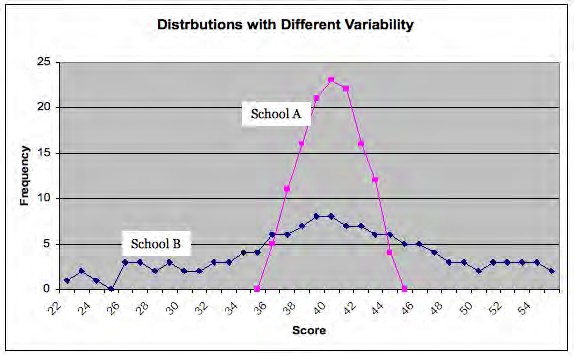
Exhibit 20: Fourth grade math scores in two different schools with the same mean but different variability.
However, the range is only based on two scores in the distribution, the highest and lowest scores, and so does not represent variability in all the scores. The standard deviation is based on how much, on average, all the scores deviate from the mean. In the example in Exhibit 17 the standard deviations are 7.73 for School A and 2.01 for School B. In the exercise below we demonstrate how to calculate the standard deviation.
Calculating a standard deviation
Example: The scores from 11 students on a quiz are 4, 7, 6, 3, 10, 7, 3, 7, 5, 5, and 9
- Order scores.
- Calculate the mean score.
- Calculate the deviations from the mean.
- Square the deviations from the mean.
- Calculate the mean of the squared deviations from the mean (i.e. sum the squared deviations from the mean then divide by the number of scores). This number is called the variance.
- Take the square root and you have calculated the standard deviation.
|
Score (Step 1, order) |
Deviation from the mean |
Squared deviation from the mean |
|
|
3 |
-3 |
9 |
|
|
3 |
-3 |
9 |
|
|
4 |
-2 |
4 |
(Step 4-5, complete the calculations) |
|
5 |
-1 |
1 |
Formula: |
|
5 |
-1 |
1 |
∑ Score−Mean2 Standard deviation= N = Number of scores |
|
6 |
0 |
0 |
|
|
7 |
1 |
1 |
|
|
7 |
1 |
1 |
|
|
7 |
1 |
1 |
|
|
9 |
3 |
9 |
|
|
10 |
4 |
4 |
|
|
TOTAL = 66 |
|
40 |
|
|
(Step 2, calculate mean) MEAN 66 /11=6 |
|
(Step 3, calculate deviations) Mean=40 /11=3.64 |
(Step 6, find the standard deviation) Standard deviation=3.64 =1.91 |
| Exhibit 21: Calculating a standard deviation |
The normal distribution
Knowing the standard deviation is particularly important when the distribution of the scores falls on a normal distribution. When a standardized test is administered to a very large number of students the distribution of scores is typically similar, with many students scoring close to the mean, and fewer scoring much higher or lower than the mean. When the distribution of scores looks like the bell shape shown in Exhibit 19 it is called a normal distribution. In the diagram we did not draw in the scores of individual students as we did in Exhibit 20, because distributions typically only fall on a normal curve when there are a large number of students; too many to show individually. A normal distribution is symmetric, and the mean, median and mode are all the same.
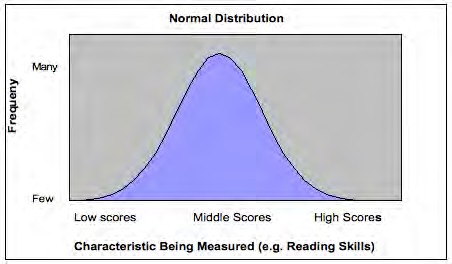
Exhibit 22: Bell shaped curve of normal distribution
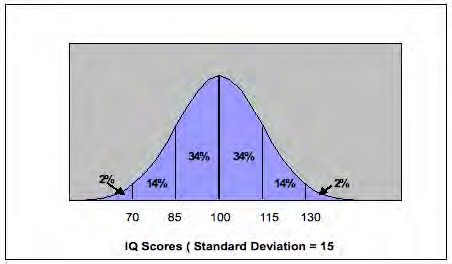
Exhibit 23: Normal distribution for an IQ test with mean 100 and standard deviation 15
Normal curve distributions are very important in education and psychology because of the relationship between the mean, standard deviation, and percentiles. In all normal distributions 34 per cent of the scores fall between the mean and one standard deviation of the mean. Intelligence tests often are constructed to have a mean of 100 and standard deviation of 15 and we illustrate that in Exhibit 15.
In this example, 34 per cent of the scores are between 100 and 115 and as well, 34 per cent of the scores lie between 85 and 100. This means that 68 per cent of the scores are between -1 and +1 standard deviations of the mean (i.e. 85 and 115). Note than only 14 per cent of the scores are between +1 and +2 standard deviations of the mean and only 2 per cent fall above +2 standard deviations of the mean.
In a normal distribution a student who scores the mean value is always in the fiftieth percentile because the mean and median are the same. A score of +1 standard deviation above the mean (e.g. 115 in the example above) is the 84 per cent tile (50 per cent and 34 per cent of the scores were below 115). In Exhibit 10 we represent the percentile equivalents to the normal curve and we also show standard scores. 1
Kinds of test scores
A standard score expresses performance on a test in terms of standard deviation units above of below the mean (Linn & Miller, 2005). There are a variety of standard scores:
Z-score: One type of standard score is a z-score, in which the mean is 0 and the standard deviation is 1. This means that a z-score tells us directly how many standard deviations the score is above or below the mean. For example, if a student receives a z score of 2 her score is two standard deviations above the mean or the eighty- fourth percentile. A student receiving a z score of -1.5 scored one and one half deviations below the mean. Any score from a normal distribution can be converted to a z score if the mean and standard deviation is known. The formula is:
Z-score
| Z−score= | Score−mean score |
| Standard deviation |
So, if the score is 130 and the mean is 100 and the standard deviation is 15 then the calculation is:
| Z = |
130−100 =2 |
| 15 |
If you look at Exhibit 15 you can see that this is correct—a score of 130 is 2 standard deviations above the mean and so the z score is 2.
T-score: A T-score has a mean of 50 and a standard deviation of 10. This means that a T-score of 70 is two standard deviations above the mean and so is equivalent to a z-score of 2.
Stanines: Stanines (pronounced staynines) are often used for reporting students’ scores and are based on a standard nine point scale and with a mean of 5 and a standard deviation of 2. They are only reported as whole numbers and Figure 11-10 shows their relation to the normal curve.
Grade equivalent sores
A grade equivalent score provides an estimate of test performance based on grade level and months of the school year (Popham, 2005, p. 288). A grade equivalent score of 3.7 means the performance is at that expected of a third grade student in the seventh month of the school year. Grade equivalents provide a continuing range of grade levels and so can be considered developmental scores. Grade equivalent scores are popular and seem easy to understand however they are typically misunderstood. If, James, a fourth grade student, takes a reading test and the grade equivalent score is 6.0; this does not mean that James can do sixth grade work. It means that James performed on the fourth grade test as a sixth grade student is expected to perform. Testing companies calculate grade equivalents by giving one test to several grade levels. For example a test designed for fourth graders would also be given to third and fifth graders. The raw scores are plotted and a trend line is established and this is used to establish the grade equivalents.
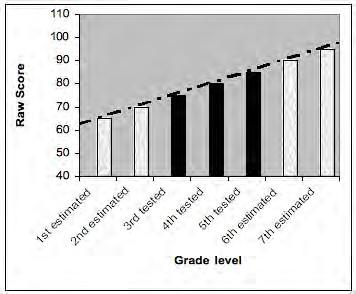
Exhibit 24: Using trend lines to estimate grade equivalent scores
Grade equivalent scores also assume that the subject matter that is being tested is emphasized at each grade level to the same amount and that mastery of the content accumulates at a mostly constant rate (Popham, 2005). Many testing experts warn that grade equivalent scores should be interpreted with considerable skepticism and that parents often have serious misconceptions about grade equivalent scores. Parents of high achieving students may have an inflated sense of what their child’s levels of achievement.
Issues with standardized tests
Many people have very strong views about the role of standardized tests in education. Some believe they provide an unbiased way to determine an individual’s cognitive skills as well as the quality of a school or district. Others believe that scores from standardized tests are capricious, do not represent what students know, and are misleading when used for accountability purposes. Many educational psychologists and testing experts have nuanced views and make distinctions between the information standardized tests can provide about students’ performances and how the tests results are interpreted and used. In this nuanced view, many of the problems associated with standardized tests arise from their high stakes use such as using the performance on one test to determine selection into a program, graduation, or licensure, or judging a school as high vs low performing.
Are standardized tests biased?
In a multicultural society one crucial question is: Are standardized tests biased against certain social class, racial, or ethnic groups? This question is much more complicated than it seems because bias has a variety of
meanings. An everyday meaning of bias often involves the fairness of using standardized test results to predict potential performance of disadvantaged students who have previously had few educational resources. For example, should Dwayne, a high school student who worked hard but had limited educational opportunities because of the poor schools in his neighborhood and few educational resources in his home, be denied graduation from high school because of his score on one test. It was not his fault that he did not have the educational resources and if given a chance with a change his environment (e.g. by going to college) his performance may blossom. In this view, test scores reflect societal inequalities and can punish students who are less privileged, and are often erroneously interpreted as a reflection of a fixed inherited capacity. Researchers typically consider bias in more technical ways and three issues will be discussed: item content and format; accuracy of predictions, and stereotype threat.
Item content and format. Test items may be harder for some groups than others. An example of social class bias in a multiple choice item asked students the meaning of the term field. The students were asked to read the initial sentence in italics and then select the response that had the same meaning of field (Popham 2004, p. 24):
My dad’s field is computer graphics.
a. The pitcher could field his position
b. We prepared the field by plowing it
c. The doctor examined my field of vision
d. What field will you enter after college?
Children of professionals are more likely to understand this meaning of field as doctors, journalists and lawyers have “fields”, whereas cashiers and maintenance workers have jobs so their children are less likely to know this meaning of field. (The correct answer is D).
Testing companies try to minimize these kinds of content problems by having test developers from a variety of backgrounds review items and by examining statistically if certain groups find some items easier or harder. However, problems do exist and a recent analyses of the verbal SAT tests indicated that whites tend to scores better on easy items whereas African Americans, Hispanic Americans and Asian Americans score better on hard items (Freedle, 2002). While these differences are not large, they can influence test scores. Researchers think that the easy items involving words that are used in every day conversation may have subtly different meanings in different subcultures whereas the hard words (e.g. vehemence, sycophant) are not used in every conversation and so do not have these variations in meaning. Test formast can also influence test performance. Females typically score better at essay questions and when the SAT recently added an essay component, the females overall SAT verbal scores improved relative to males (Hoover, 2006).
Accuracy of predictions
Standardized tests are used among other criteria to determine who will be admitted to selective colleges. This practice is justified by predictive validity evidence—i.e. that scores on the ACT or SAT are used to predict first year college grades. Recent studies have demonstrated that the predictions for black and Latino students are less accurate than for white students and that predictors for female students are less accurate than male students (Young, 2004). However, perhaps surprisingly the test scores tend to slightly over predict success in college for black and Latino students, i.e. these students are likely to attain lower freshman grade point averages than predicted by their test scores. In contrast, test scores tend to slightly under predict success in college for female students, i.e. these students are likely to attain higher freshman grade point averages than predicted by their test scores. Researchers are not sure why there are differences in how accurately the SAT and ACT test predict freshman grades.
Stereotype threat
Groups that are negatively stereotyped in some area, such as women’s performance in mathematics, are in danger of stereotype threat, i.e. concerns that others will view them through the negative or stereotyped lens (Aronson & Steele, 2005). Studies have shown that test performance of stereotyped groups (e.g. African Americans, Latinos, women) declines when it is emphasized to those taking the test that (a) the test is high stakes, measures intelligence or math and (b) they are reminded of their ethnicity, race or gender (e.g. by asking them before the test to complete a brief demographic questionnaire). Even if individuals believe they are competent, stereotype threat can reduce working memory capacity because individuals are trying to suppress the negative stereotypes. Stereotype threat seems particularly strong for those individuals who desire to perform well. Standardized test scores of individuals from stereotyped groups may significantly underestimate actual their competence in low- stakes testing situations.
Do teachers teach to the tests?
There is evidence that schools and teachers adjust the curriculum so it reflects what is on the tests and also prepares students for the format and types of items on the test. Several surveys of elementary school teachers indicated that more time was spent on mathematics and reading and less on social studies and sciences in 2004 than 1990 (Jerald, 2006). Principals in high minority enrollment schools in four states reported in 2003 they had reduced time spent on the arts. Recent research in cognitive science suggests that reading comprehension in a subject (e.g. science or social studies) requires that students understand a lot of vocabulary and background knowledge in that subject (Recht & Leslie, 1988). This means that even if students gain good reading skills they will find learning science and social studies difficult if little time has been spent on these subjects.
Taking a test with an unfamiliar format can be difficult so teachers help students prepare for specific test formats and items (e.g. double negatives in multiple choice items; constructed response). Earlier in this chapter a middle school teacher, Erin, and Principal Dr Mucci described the test preparation emphasis in their schools. There is growing concern that the amount of test preparation that is now occurring in schools is excessive and students are not being educated but trained to do tests (Popham, 2004).
Do students and educators cheat?
It is difficult to obtain good data on how widespread cheating is but we know that students taking tests cheat and others, including test administrators, help them cheat (Cizek, 2003; Popham 2006). Steps to prevent cheating by students include protecting the security of tests, making sure students understand the administration procedures, preventing students from bringing in their notes or unapproved electronic devices as well as looking at each others answers. Some teachers and principals have been caught using unethical test preparation practices such as giving actual test items to students just before the tests, giving students more time than is allowed, answering students’ questions about the test items, and actually changing students’ answers (Popham, 2006). Concerns in Texas about cheating led to the creation of an independent task force in August 2006 with 15 staff members from the Texas
Education Agency assigned investigate test improprieties. (Jacobson, 2006). While the pressure on schools and teachers to have their student perform well is large these practices are clearly unethical and have lead to school personnel being fired from their jobs (Cizek, 2003).
Chapter summary
Standardized tests are developed by a team of experts and are administered in standard ways. They are used for a variety of educational purposes including accountability. Most elementary and middle school teachers are likely to be responsible for helping their students attain state content standards and achieve proficiency on criterion- referenced achievement tests. In order for teachers to interpret test scores and communicate that information to students and parents they have to understand basic information about measures of central tendency and variability, the normal distribution, and several kinds of test scores. Current evidence suggests that standardized tests can be biased against certain groups and that many teachers tailor their curriculum and classroom tests to match the standardized tests. In addition, some educators have been caught cheating.
Key terms
|
Achievement tests Aptitude tests AYP (Annual Yearly Progress) Criterion referenced tests Diagnostic tests Frequency distribution Grade equivalent scores
|
High stakes tests Mean Median Mode Norm referenced tests Range Standard deviation Stanine Z-score |
On the Internet
<http://www.cse.ucla.edu/> The National Center for Research on Evaluation, Standards, and Student Testing (CRESST) at UCLA focuses on research and development that improves assessment and accountability systems. It has resources for researchers, K-12 teachers, and policy makers on the implications of NCLB as well as classroom assessment.
<www.ets.org> This is the home page of Educational Testing services which administers the PRAXIS II series of tests and has links to the testing requirements for teachers seeking licensure in each state District of Columbia and the US Virgin Islands.
<http://www.ed.gov/nclb/landing.jhtml> This is US Department of Education website devoted to promoting information and supporting and NCLB. Links for teachers and the summaries of the impact of NCLB in each state are provided.
References
American Federation of Teachers (2006, July) Smart Testing: Let’s get it right. AFT Policy Brief. Retrieved August 8th 2006 from http://www.aft.org/presscenter/releases/2006/smarttesting/Testingbrief.pdf
Aronson, J., & Steele, C. M. (2005). Stereotypes and the Fragility of Academic Competence, Motivation, and Self-Concept. In A. J. Elliott & C. S. Dweck (Eds.). Handbook of competence and motivation. (pp.436- 456) Guilford Publications, New York.
Bracey, G. W. (2004). Value added assessment findings: Poor kids get poor teachers. Phi Delta Kappan, 86, 331- 333
Cizek, G. J. (2003). Detecting and preventing classroom cheating: Promoting integrity in assessment. Corwin Press, Thousand Oaks, CA.
Combined Curriculum Document Reading 4.1 (2006). Accessed November 19, 2006 from http://www.education.ky.gov/KDE/Instructional+Resources/Curriculum+Documents+and+Resources/ Teaching+Tools/Combined+Curriculum+Documents/default.htm
Freedle, R. O. (2003). Correcting the SAT’s ethnic and social–class bias: A method for reestimating SAT scores. Harvard Educational Review, 73 (1), 1-42.
Fuhrman, S. H. (2004). Introduction, In S. H. Fuhrman & R. F. Elmore (Eds). Redesigning accountability systems for education. (pp. 3-14). New York: Teachers College Press.
Haertel, E. & Herman, J. (2005) A historical perspective on validity arguments for accountability testing. In J. L.Herman & E. H. Haertel (Eds.) Uses and misuses of data for educational accountability and improvement. 104th Yearbook of the National Society for the Study of Education. Malden, MA: Blackwell
Hershberg, T. (2004). Value added assessment: Powerful diagnostics to improve instruction and promote student achievement. American Association of School Administrators, Conference Proceedings. Retrieved August 21 2006 from www.cgp.upenn.edu/ope_news.html
Hess, F. H. Petrilli, M. J. (2006). No Child Left Behind Primer. New York: Peter Lang. Hoff, D. J. (2002) States revise meaning of proficient. Educational Week, 22,(6) 1,24-25.
Hoover, E. (2006, October 21). SAT scores see largest dip in 31 years. Chronicle of Higher Education, 53(10), A1.
Human Resources Division (n. d.). Firefighter Commonwealth of Massachusetts Physical Abilities Test (PAT) Accessed November, 19, 2006 from http://www.mass.gov/?pageID=hrdtopic&L=2&L0=Home&L1=Civil+Service&sid=Ehrd
Idaho Department of Education (2005-6). Mathematics Content standards and assessment by grade level. Accessed November 22 2006 from http://www.sde.idaho.gov/instruct/standards/
Jacobson, L. (2006). Probing Test irregularities: Texas launches inquiry into cheating on exams. Education Week, 28(1), 28
Jerald, C. D (2006,August).The Hidden costs of curriculum narrowing. Issue Brief, Washington DC: The Center for Comprehensive School Reform and Improvement. Accessed November 21, 2006 from www.centerforcsri.org/
Joshi, R. M. (2003). Misconceptions about the assessment and diagnosis of reading disability. Reading Psychology, 24, 247-266.
Linn, R. L., & Miller, M. D. (2005). Measurement and Assessment in Teaching 9th ed. Upper Saddle River, NJ: Pearson .
Linn, R. L. (2005). Fixing the NCLB Accountability System. CRESST Policy Brief 8. Accessed September 21, 2006 from http://www.cse.ucla.edu/products/policybriefs_set.htm
New York State Education Department (2005). Home Instruction in New York State. Accessed on November 19, 2006 from http://www.emsc.nysed.gov/nonpub/part10010.htm
Martin, M.O., Mullis, I.V.S., Gonzalez, E.J., & Chrostowski, S.J. (2004). Findings From IEA’s Trends in International Mathematics and Science Study at the Fourth and Eighth Grades Chestnut Hill, MA: TIMSS & PIRLS International Study Center, Boston College. Accessed September 23, 2006 from http://timss.bc.edu/timss2003i/scienceD.html
Novak, J. R. & Fuller, B (2003, December), Penalizing diverse schools? Similar test scores, but different students bring federal sanctions. Policy analysis for policy education. University of California, Berkeley School of Education: Berkeley CA. Accessed on September 21, 2006 from http://pace.berkeley.edu/pace_index.html
(OECD 2004). Learning for Tomorrow’s World—First Results from PISA 2003. Accessed on September 23, 2006 from http://www.pisa.oecd.org/document/
Olson, L. (2005, November 30th). State test program mushroom as NCLB kicks in. Education Week 25(13) 10-12.
Pedulla, J Abrams, L. M. Madaus, G. F., Russell, M. K., Ramos, M. A., & Miao, J. (2003). Perceived effects of state-mandated testing programs on teaching and learning: Findings from a national survey of teachers. Boston College, Boston MA National Board on Educational Testing and Public Policy. Accessed September 21 2006 from http://escholarship.bc.edu/lynch_facp/51/
Popham, W. J. (2004). America’s “failing” schools. How parents and teachers can copy with No Child Left Behind. New York: Routledge Falmer.
Popham, W. J. (2005). Classroom Assessment: What teachers need to know. Boston:, MA: Pearson. Popham, W. J. (2006). Educator cheating on No Child Left Behind Tests. Educational Week, 25 (32) 32-33.
Recht, D. R. & Leslie, L. (1988). Effect of prior knowledge on good and poor readers’ memory of text. Journal of Educational Psychology 80, 16-20.
Shaul, M. S. (2006). No Child Left Behind Act: States face challenges measuring academic growth.
Testimony before the House Committee on Education and the Workforce Government Accounting Office. Accessed September 25, 2006 from www.gao.gov/cgi-bin/getrpt?GAO-06-948T
Stiggins, R (2004). New Assessment Beliefs for a New School Mission, Phi Delta Kappan, 86 (1) 22 -27.
Wise, S. L. & DeMars, C. W. (2005). Low examinee effort in low-stakes assessment: Problems and potential solutions. Educational Assessment 10(1), 1-17.
Young, J. W. (2004). Differential validity and prediction: Race and sex differences in college admissions testing. In R. Zwick (Ed). Rethinking the SAT: The future of standardized testing in university admissions. New York (pp. 289-301). Routledge Falmer.
