1
Learning Objectives
- Understand the principles of geographic study
- Summarize the key physical and human features of the world
- Distinguish between different types of regions
- Understand the major subfields of geography and their key conceptual frameworks
- Describe the process of globalization and the principal measures of inequality
1.1 The Where and the Why
What is “geography”? It might seem like a simple enough term to define. In middle school or high school, your answer might have been something to do with the study of maps, of where things were located in the world. In fact, much of primary and secondary school geography is explicitly focused on the where, answering questions like where a particular country is located, what a country’s capital is, and where major landforms are located. Just as simple arithmetic operations form the backbone of mathematics as a discipline, these kinds of questions are foundational to geographic study. However, one wouldn’t likely define math as the study of calculators or of multiplication tables. Similarly, there is much more to geography and geographic inquiry than the study of maps.
Geographers seek to answer both the “where” and the “why.” Simply knowing where a country is located is certainly helpful, but geographers dig deeper: why is it located there? Why does it have a particular shape, and how does this shape affect how it interacts with its neighbors and its access to resources? Why do the people of the country have certain cultural features? Why does the country have a specific style of government? The list goes on and on, and as you might notice, incorporates a variety of historical, cultural, political, and physical features. This synthesis of the physical world and human activity is at the heart of the regional geographic approach.
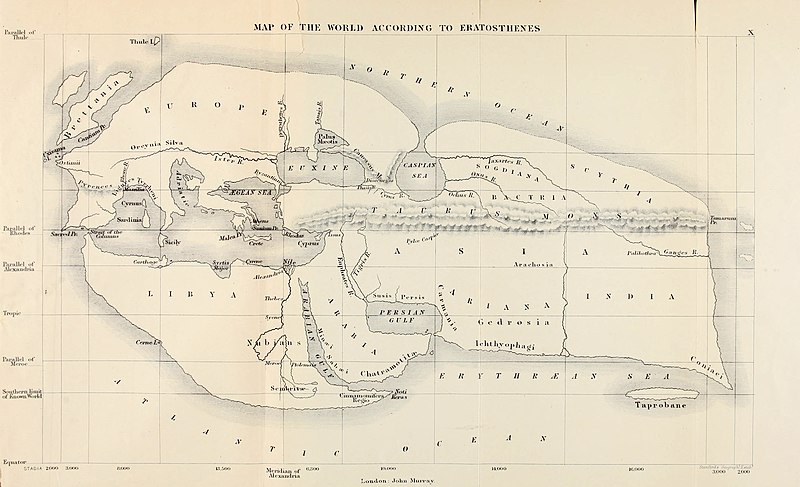
The term “geography” comes from the Greek term geo meaning “the earth” and graphia meaning “to write,” and many early geographers did exactly that: they wrote about the world. Ibn Battuta, for example, was a scholar from Morocco and traveled extensively across Africa and Asia in the 14th century CE. Eratosthenes is commonly considered to be the “Father of Geography,” and in fact, he quite literally wrote the book on the subject in the third century BCE. His three-volume text, Geographica, included maps of the entire known world (see Figure 1.1), including different climate zones, the locations of hundreds of different cities, and a coordinate system. This was a revolutionary and highly regarded text, especially for the time period. Eratosthenes is also credited as the first person to calculate the circumference of the Earth. Many early geographers, like Eratosthenes, were primarily cartographers, referring to people who scientifically study and create maps, and early maps, such as those used in Babylon, Polynesia, and the Arabian Peninsula, were often used for navigation. In the Middle Ages, as academic inquiry in Europe declined with the fall of the Roman Empire, Muslim geographer Muhammad al-Idrisi created one of the most advanced maps of pre-modern times, inspiring future geographers from the region.
Geography today, though using more advanced tools and techniques, draws on the foundations laid by these predecessors. What unites all geographers, whether they are travelers writing about the world’s cultures or cartographers mapping new frontiers, is an attention to the spatial perspective. As geographer Harm deBlij once explained, there are three main ways to look at the world. One way is chronologically, as a historian might examine the sequence of world events. A second way is systematically, as a sociologist might explore the societal systems in place that help shape a given country’s structures of inequality. The third way is spatially, and this is the geographic perspective. Geographers, when confronted with a global problem, immediately ask the questions “Where?” and “Why?” Although geography is a broad discipline that includes quantitative techniques like statistics and qualitative methods like interviews, all geographers share this common way of looking at the world from a spatial perspective.
1.2 The Spatial Perspective
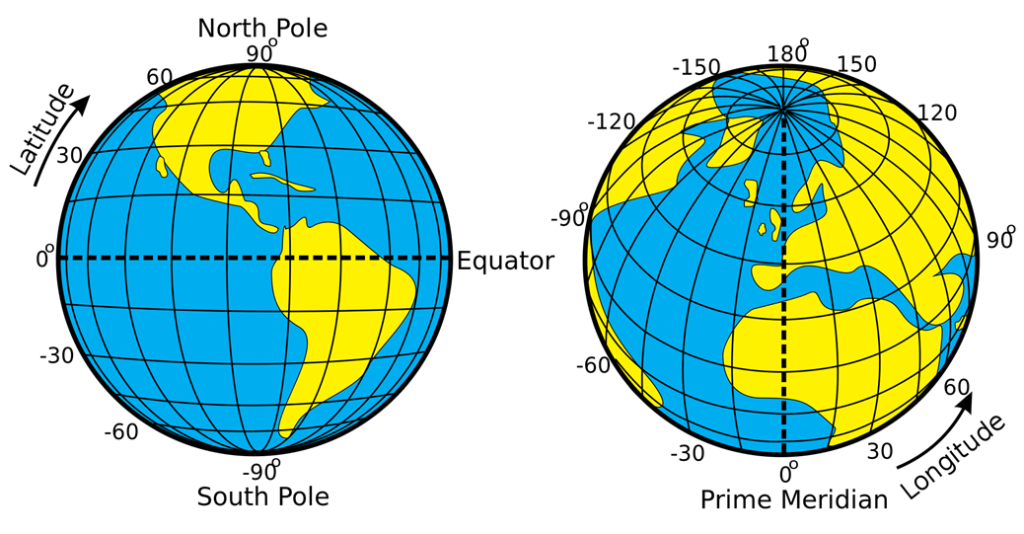
At the heart of the spatial perspective is the question of “where,” but there are a number of different ways to answer this question. Relative location refers to the location of a place relative to other places, and we commonly use relative location when giving directions to people. We might instruct them to turn “by the gas station on the corner,” or say that we live “in the dorm across from the fountain.” Another way to describe a place is by referring to its absolute location. Absolute location references an exact point on Earth and commonly uses specific coordinates like latitude and longitude. Lines of latitude and longitude are imaginary lines that circle the globe and form the geographic coordinate system (see Figure 1.2). Lines of latitude run laterally, parallel to the equator, and measure distances north or south of the equator. Lines of longitude, on the other hand, converge at the poles and measure distances east and west of the prime meridian.
Every place on Earth has a precise location that can be measured with latitude and longitude. The location of the White House in Washington, DC, for example, is located at latitude 38.8977 °N and longitude 77.0365°W. Absolute location might also refer to details like elevation. The Dead Sea, located on the border of Jordan and Israel, is the lowest location on land, dipping down to 1,378 feet below sea level.
Historically, most maps were hand-drawn, but with the advent of computer technology came more advanced maps created with the aid of satellite technology. Geographic information science (GIS), sometimes also referred to as geographic information systems,uses computers and satellite imagery to capture, store, manipulate, analyze,manage, and present spatial data. GIS essentially uses layers of information and is often used to make decisions in a wide variety of contexts. An urban planner might use GIS to determine the best location for a new fire station, while a biologist might use GIS to map the migratory paths of birds. You might use GIS to get navigation directions from one place to another, layering place names, buildings, and roads.
One difficulty with map-making, even when using advanced technology, is that the earth is roughly a sphere while maps are generally flat. When converting the spherical Earth to a flat map, some distortion always occurs. A map projection , or a representation of Earth’s surface on a flat plane, always distorts at least one of these four properties: area, shape, distance, and direction. Some maps preserve three of these properties, while significantly distorting another, while other maps seek to minimize overall distortion but distort each property somewhat. So which map projection is best? That depends on the purpose of the map. The Mercator projection , while significantly distorting the size of places near the poles, preserves angles and shapes, making it ideal for navigation (see Figure 1.3).

The Winkel tripel projection is so-named because its creator, Oswald Winkel, sought to minimize three kinds of distortion: area, direction, and distance (see Figure 1.4). It has been used by the National Geographic Society since 1998 as the standard projection of world maps.

When representing the Earth on a manageable-sized map, the actual size of location is reduced. Scale is the ratio between the distance between two locations on a map and the corresponding distance on Earth’s surface. A 1:1000 scale map, for example, would mean that 1 meters on the map equals 1000 meters, or 1 kilometer, on Earth’s surface. Scale can sometimes be a confusing concept for students, so it’s important to remember that it refers to a ratio. It doesn’t refer to the size of the map itself, but rather, how zoomed in or out the map is. A 1:1 scale map of your room would be the exact same size of your room – plenty of room for significant detail, but hard to fit into your glove compartment. As with map projections, the “best” scale for a map depends on what it’s used for. If you’re going on a walking tour of a historic town, a 1:5,000 scale map is commonly used. If you’re a geography student looking at a map of the entire world, a 1:50,000,000 scale map would be appropriate. “Large” scale and “small” scale refer to the ratio, not to the size of the landmass on the map. 1 divided by 5,000 is 0.0002, which is a larger number than 1 divided by 50,000,000 (which is 0.00000002). Thus, a 1:5,000 scale map is considered “large” scale while 1:50,000,000 is considered “small” scale.
All maps have a purpose, whether it’s to guide sailing ships, help students create a more accurate mental map of the world, or tell a story. The map projection, color scheme, scale, and labels are all decisions made by the mapmaker. Some argued that the widespread use of the Mercator projection, which made Africa look smaller relative to North America and Eurasia, led people to minimize the importance of Africa’s political and economic issues. Just as texts can be critiqued for their style, message, and purpose, so too can maps be critiqued for the information and message they present.
The spatial perspective, and answering the question of “where,” encompasses more than just static locations on a map. Often, answering the question of “where” relates to movement across space. Diffusion refers to the spreading of something from one place to another, and might relate to the physical movement of people or the spread of disease, or the diffusion of ideas, technology, or other intangible phenomena. Diffusion occurs for different reasons and at different rates. Just as static features of culture and the physical landscape can be mapped, geographers can also map the spread of various characteristics or ideas to study how they interact and change.
1.3 Core and Periphery
One way of considering the location of places relative to one another is by examining their spatial interaction. In a given region, there is generally a core area, sometimes known as the central business district (CBD) and a hinterland, a German term literally meaning “the land behind” (see Figure 1.5). The hinterland is more sparsely populated than the core and is often where goods sold in the core are manufactured. It might include rural farmland, for example.
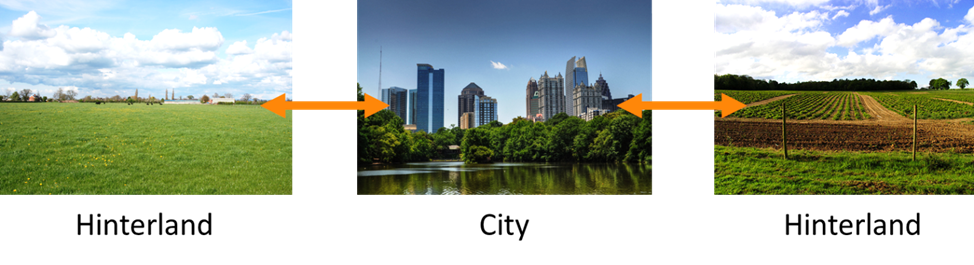
The core, on the other hand, is the commercial focus for the area where most goods and services are exchanged. The hinterland relies on the central city to sell its goods, but similarly the city relies on the hinterland to produce raw materials. Consider where the hinterland is located around your closest city; the hinterland is characteristically rural, while the core is urban. All countries contain core areas and hinterlands.
Globally, we can apply the hinterland-city model to an understanding of a global core and a global periphery (see Figure 1.6). The core areas are places of dominance, and these areas exert control over the surrounding periphery. Core areas are typically more developed and industrialized whereas the periphery is more rural and generally less developed. Unlike the interactions between the city and the hinterland, economic exchange between the core and periphery is characteristically one-sided, creating wealth for the core and patterns of uneven development. However, these interactions do contribute to economic stability in the periphery. Some argue that it benefits the core countries to keep the periphery peripheral; in other words, if the periphery can remain underdeveloped, they are more likely to sell cheap goods to the core. This generates more wealth for core areas and contributes to their continued influence and economic strength.

1.4 The Physical Setting
When we describe places, we can discuss their absolute and relative location and their relationship and interaction with other places. As regional geographers, we can dig deeper and explore both the physical and human characteristics that make a particular place unique. Geographers explore a wide variety of spatial phenomena, but the discipline can roughly be divided into two branches: physical geography and human geography. Physical geography focuses on natural features and processes, such as landforms, climate, and water features. Human geography is concerned with human activity, such as culture, language, and religion. However, these branches are not exclusive. You might be a physical geographer who studies hurricanes, but your research includes the human impact from these events. You might be a human geographer who studies food, but your investigations include the ecological impact of agricultural systems. Regional geography takes this holistic approach, exploring both the physical and human characteristics of the world’s regions.
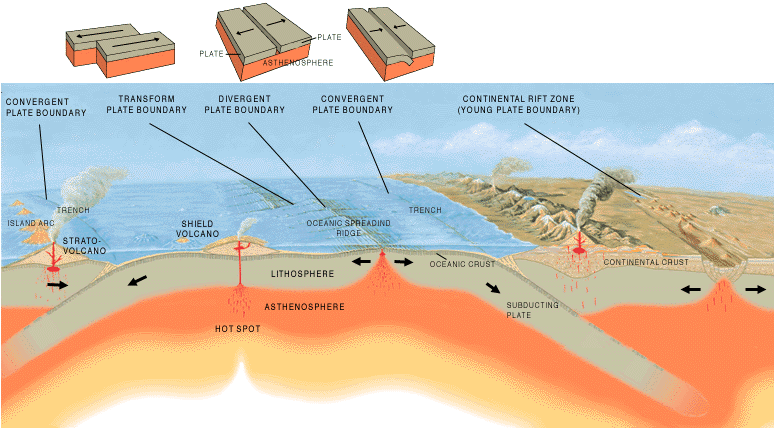
Much of Earth’s physical landscape, from mountains to volcanoes to earthquakes to valleys, has resulted from the movement of tectonic plates. As the theory of plate tectonics describes, these rigid plates are situated on top of a bed of molten, flowing material, much like a cork floating in a pot of boiling water. There are seven major tectonic plates and numerous minor plates (see Figure 1.7).

Where two tectonic plates meet is known as a plate boundary and boundaries can interact in three different ways (see Figure 1.8). Where two plates slide past one another is called a transform boundary. The San Andreas Fault in California is an example of a transform boundary. A divergent plate boundary is where two plates slide apart from one another. Africa’s Rift Valley was formed by this type of plate movement. Convergent plate boundaries occur when two plates slide towards one another. In this case, where two plates have roughly the same density, upward movement can occur, creating mountains. The Himalaya Mountains, for example, were formed from the Indian plate converging with the Eurasian plate. In other cases, subduction occurs and one plate slides below the other. Here, deep, under-ocean trenches can form. The 2004 Indian Ocean earthquake and tsunami occurred because of a subducting plate boundary off the west coast of Sumatra, Indonesia.
Interaction between tectonic plates and historical patterns of erosion and deposition have generated a variety of landforms across Earth’s surface. Each of the world’s regions has identifiable physical features, such as plains, valleys, mountains, and major water bodies. Topography refers to the study of the shape and features of the surface of the Earth. Areas of high relief have significant changes in elevation on the landscape, such as steep mountains, while areas of low relief are relatively flat.
Another key feature of Earth’s physical landscape is climate. Weather refers to the short-term state of the atmosphere. We might refer to the weather as partly sunny or stormy, for example. Climate, on the other hand, refers to long-term weather patterns and is affected by a place’s latitude, terrain, altitude, and nearby water bodies. Explained another way, “weather” is what you’re wearing today while “climate” is all the clothes in your closet. Geographers commonly use the Köppen climate classification system to refer to the major climate zones found in the world (see Figure 1.9).

Each climate zone in the Köppen climate classification system is assigned a letteredcode, referring to the temperature and precipitation patterns found in the particular region. Climate varies widely across Earth. Cherrapunji, India, located in the Cwb climate zone, receives over 11,000 mm (400 in) of rain each year. In contrast, the Atacama Desert (BWk), situated along the western coast of South America across Chile, Peru, Bolivia, and Argentina, typically receives only around 1 to 3 mm (0.04 to 0.12 in) of rain each year.
Earth’s climate has gone through significant changes historically, alternating between long periods of warming and cooling. Since the industrial revolution in the 1800s, however, global climate has experienced a warming phase. 95 percent of scientists agree that this global climate change has resulted primarily from human activities, particularly the emission of greenhouse gases like carbon dioxide (see Figure 1.10). 17 of the 18 warmest years ever recorded have occurred since 2000. Overall, this warming has contributed to rising sea levels as the polar ice caps melt, changing precipitation patterns, and the expansion of deserts. The responses to global climate change, and the impacts from it, vary by region.

1.5 The Human Setting
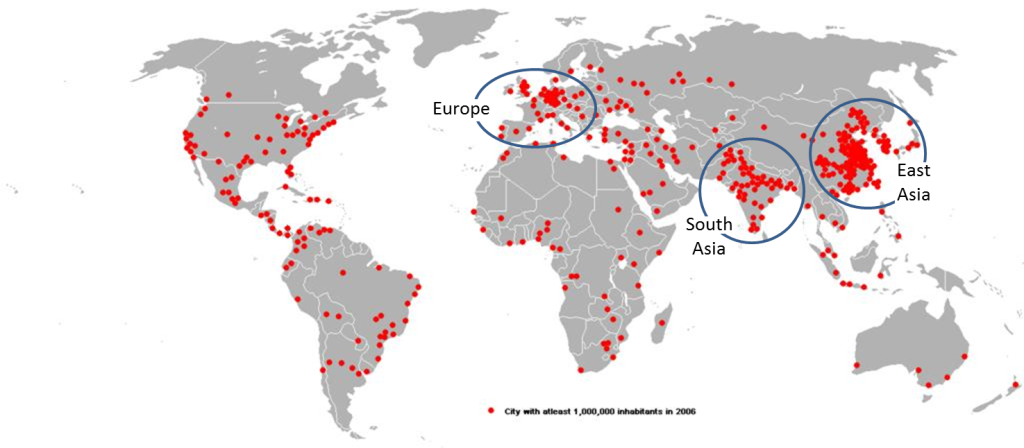
The physical setting of the world’s places has undoubtedly influenced the human setting, just as human activities have shaped the physical landscape. There are currently around 7.4 billion people in the world, but these billions of people are not uniformly distributed. When we consider where people live in the world, we tend to cluster in areas that are warm and are near water and avoid places that are cold and dry. As shown in Figure 1.11, there are three major population clusters in the world: East Asia, South Asia, and Europe.
Just as geographers can discuss “where” people are located, we can explore “why” population growth is occurring in particular areas. All of the 10 most populous cities in the world are located in countries traditionally categorized as “developing.” These countries typically have high rates of population growth. A population grows, quite simply, when more people are born than die. The birth rate refers to the total number of live births per 1,000 people in a given year. In 2012, the average global birth rate was 19.15 births per 1,000 people.
Subtracting the death rate from the birth rate results in a country’s rate of natural increase (RNI). For example, Madagascar has a birth rate of 32.9 per 1,000 (as of 2017) and a death rate of 6.19 per 1,000. 32.9 minus 6.19 is 26.71 per 1,000. If you divide the result by 10, you’d get 2.671 per 100, or 2.671 percent. In essence, this means that Madagascar’s population is increasing at a rate of 2.671 percent per year. The natural increase rate does not include immigration. Some countries in Europe, in fact, have a negative natural increase rate, but their population continues to increase due to immigration.
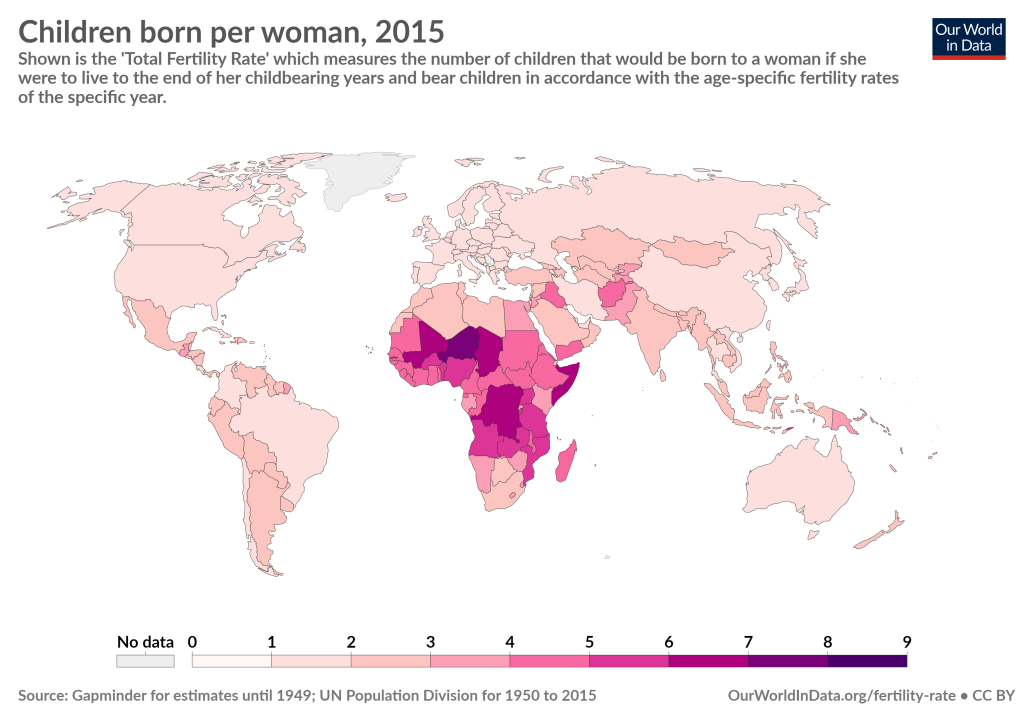
The birth rate is directly affected by the total fertility rate (TFR), which is the average number of children born to a woman during her child-bearing years (see Figure 1.12). In developing countries, the total fertility rate is often 4 or more children, contributing to high population growths. In developed countries, on the other hand, the total fertility rate may be only 1 or 2 children, which can ultimately lead to population decline.
A number of factors influence the total fertility rate, but it is generally connected to a country’s overall level of development. As a country develops and industrializes, it generally becomes more urbanized. Children are no longer needed to assist with family farms, and urban areas might not have large enough homes for big families. Women increasingly enter the workforce, which can delay childbearing and further restrict the number of children a family desires. Culturally, a shift occurs as industrialized societies no longer value large family sizes. As women’s education increases, women are able to take control of their reproductive rights. Contraceptive use becomes more widespread and socially acceptable.
This shift in population characteristics as a country industrialized can be represented by the demographic transition model (DTM) (see Figure 1.13). This model demonstrates the changes in birth rates, death rates, and population growth over time as a country develops. In stage one, during feudal Europe, for example, birth rates and death rates were very high. Populations were vulnerable to drought and disease and thus population growth was minimal. No country remains in stage one today. In stage two, a decline in death rates leads to a rise in population. This decline in death rates occurred as a result of agricultural productivity and improvements in public health. Vaccines, for example, greatly reduced the mortality from childhood diseases.
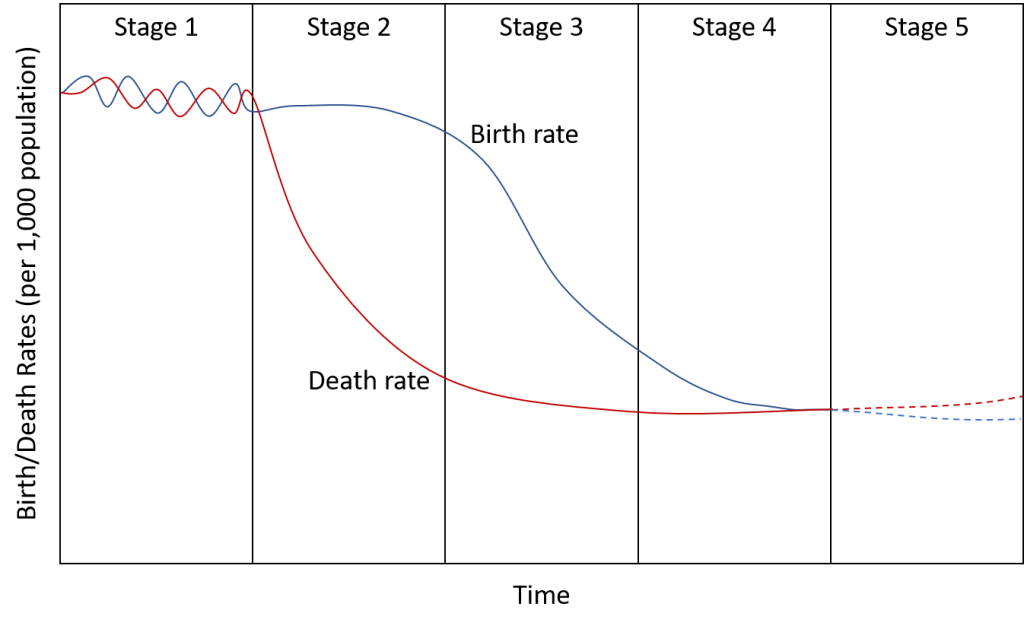
Stage two countries are primarily agricultural, and thus there is a cultural and historical preference for large families, so birth rates remain high. Most of Sub-Saharan Africa is in stage two. In stage three, urbanization and increasing access to contraceptives leads to a decline in the birth rate. As country industrializes, women enter the workforce and seek higher education. The population growth begins to slow. Much of Middle and South America as well as India are in stage three.
In stage four, birth rates approach the death rates. Women have increased independence as well as educational and work opportunities, and families may choose to have a small number of children or none at all. Most of Europe as well as China are in stage four. Some have proposed a stage five of the demographic transition model. In some countries, the birth rate has fallen below the death rate as families choose to only have 1 child. In these cases, a population will decline unless there is significant immigration. Japan, for example, is in stage five and has a total fertility rate of 1.41. Although this is only a model, and each country passes through the stages of demographic transition at different rates, the generalized model of demographic transition holds true for most countries of the world.
As countries industrialize and become more developed, they shift from primarily rural settlements to urban ones. Urbanization refers to the increased proportion of people living in urban areas. As people migrate out of rural, agricultural areas, the proportion of people living in cities increases. As people living in cities have children, this further increases urbanization. For most of human history, we have been predominantly rural. By the middle of 2009, however, the number of people living in urban areas surpassed the number of people living in rural areas for the first time. In 2014, 54 percent of the world’s population lived in urban areas. This figure is expected to increase to 66 percent by 2050.
The number of megacities, cities with 10 million people or more, has also increased. In 1990, there were 10 megacities in the world. In 2014, there were 28 megacities. Tokyo-Yokohama is the largest metropolitan area in the world with over 38 million inhabitants.
1.6 The World’s Regions
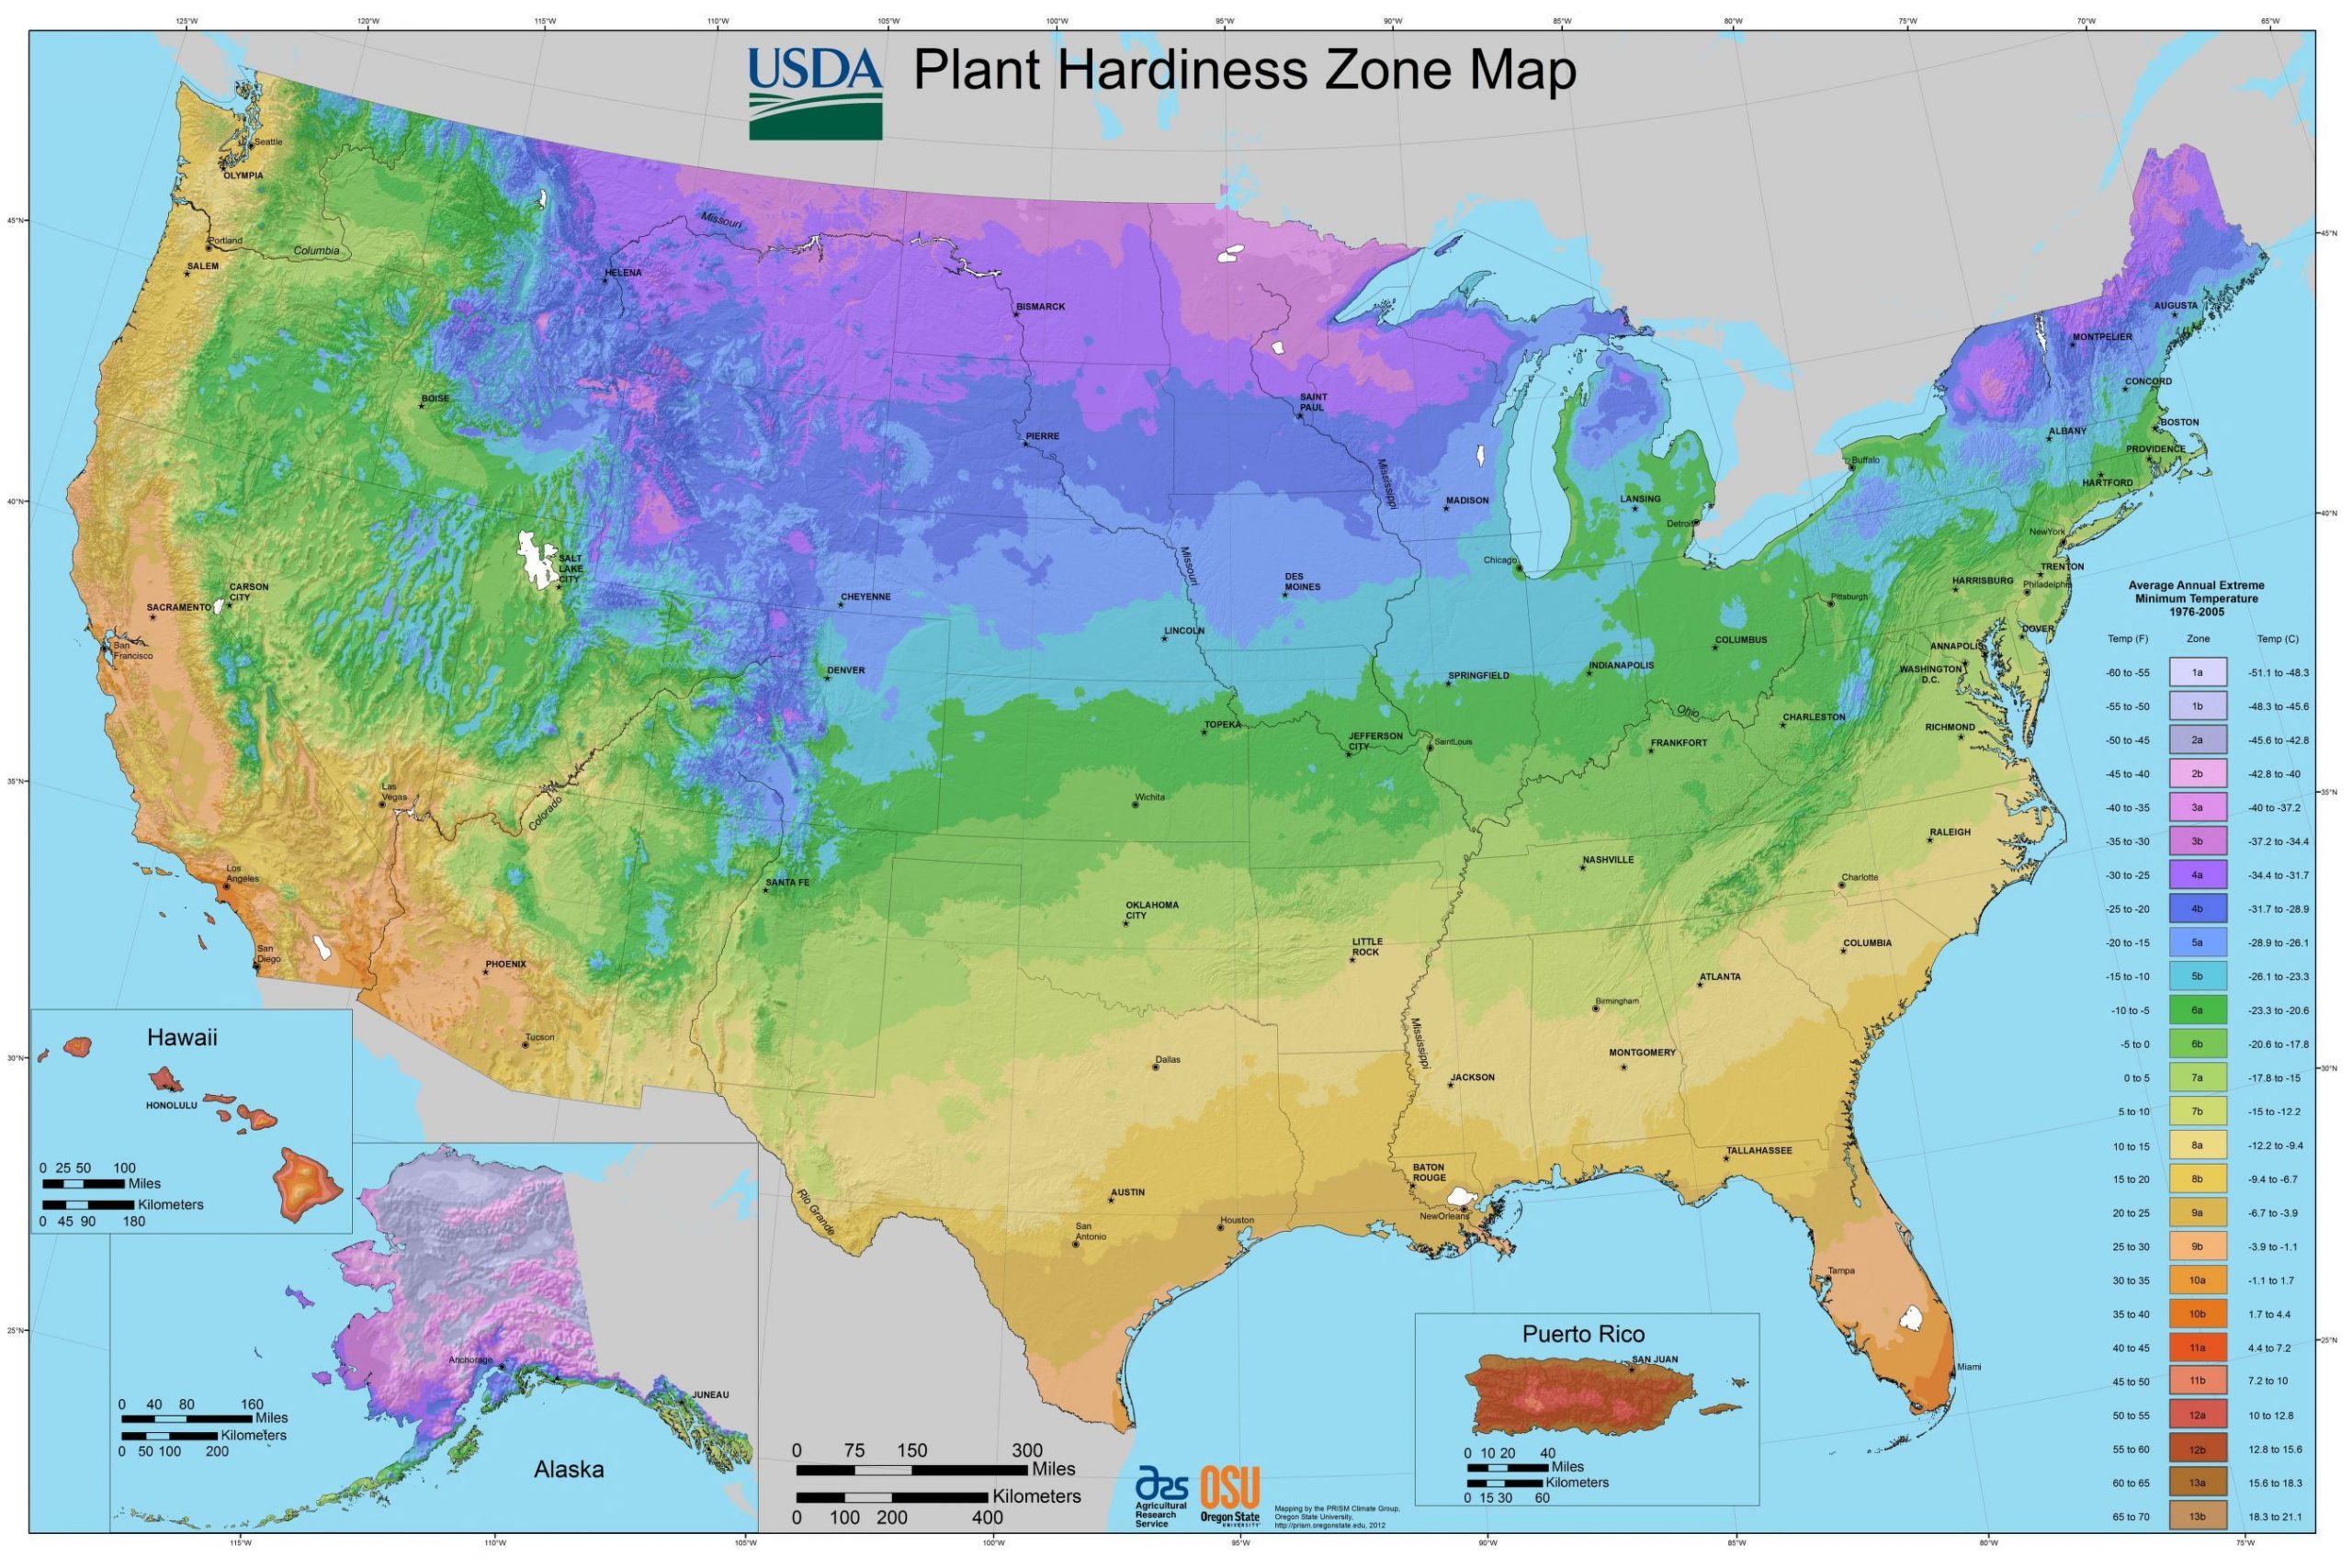
The world can be divided into regions based on human and/or physical characteristics. Regions simply refer to spatial areas that share a common feature. There are three types of regions: formal, functional, and vernacular. Formal regions, sometimes called homogeneous regions, have at least one characteristic in common. A map of plant hardiness regions, as in Figure 1.14, for example, divides the United States into regions based on average extreme temperatures, showing which areas particular plants will grow well. This isn’t to say that everywhere within a particular region will have the same temperature on a particular day, but rather that in general, a region experiences the same ranges of temperature. Other formal regions might include religious or political affiliation, agricultural crop zones, or ethnicity. Formal regions might also be established by governmental organizations, such as the case with state or provincial boundaries.
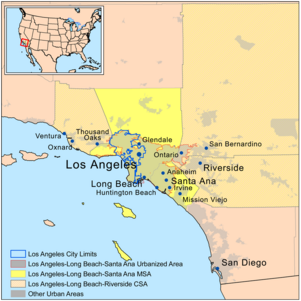
Functional regions, unlike formal regions, are not homogenous in the sense that they do not share a single cultural or physical characteristic. Rather, functional regions are united by a particular function, often economic. Functional regions are sometimes called nodal regions and have a nodal arrangement, with a core and surrounding nodes. A metropolitan area, for example, often includes a central city and its surrounding suburbs. We tend to think of the area as a “region” not because everyone is the same religion or ethnicity, or has the same political affiliation, but because it functions as a region. Los Angeles, for example, is the second-most populous city in the United States. However, the region of Los Angeles extends far beyond its official city limits as show in Figure 1.15. In fact, over 471,000 workers commute into Los Angeles County from the surrounding region every day. Los Angeles, as with all metropolitan areas, functions economically as a single region and is thus considered a functional region. Other examples of functional regions include church parishes, radio station listening areas, and newspaper subscription areas.
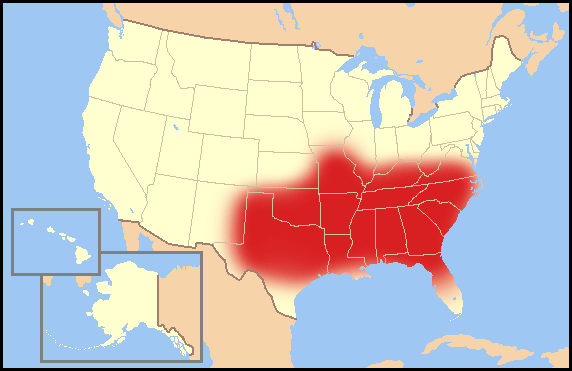
Vernacular regions are not as well-defined as formal or functional regions and are based on people’s perceptions. The southeastern region of the United States is often referred to as “the South,” but where the exact boundary of this region is depends on individual perception (see Figure 1.16). Some people might include all of the states that formed the Confederacy during the Civil War. Others might exclude Missouri or Oklahoma. Vernacular regions exist at a variety of scales. In your hometown, there might be a vernacular region called “the west side.” Internationally, regions like the Midlands in Britain or the Swiss Alps are considered vernacular. Similarly “the Middle East” is a vernacular region. It is perceived to exist as a result of religious and ethnic characteristics, but people wouldn’t necessarily agree on which countries to include. Vernacular regions are real in the sense that our perceptions are real, but their boundaries are not uniformly agreed upon.
As geographers, we can divide the world into a number of different regions based upon formal criteria and functional interaction. However, there is a matter of perception, as well. We might divide the world based on landmasses, since landmasses often share physical and cultural characteristics. Sometimes water connects people more than land, though. In the case of Europe, for example, the Mediterranean Sea historically provided economic and cultural links to the surrounding countries though we consider them to be three separate continents. Creating regions can often be a question of “lumpers and splitters;” who do you lump together and who do you split apart? Do you have fewer regions united by only a couple characteristics, or more regions that share a great deal in common?
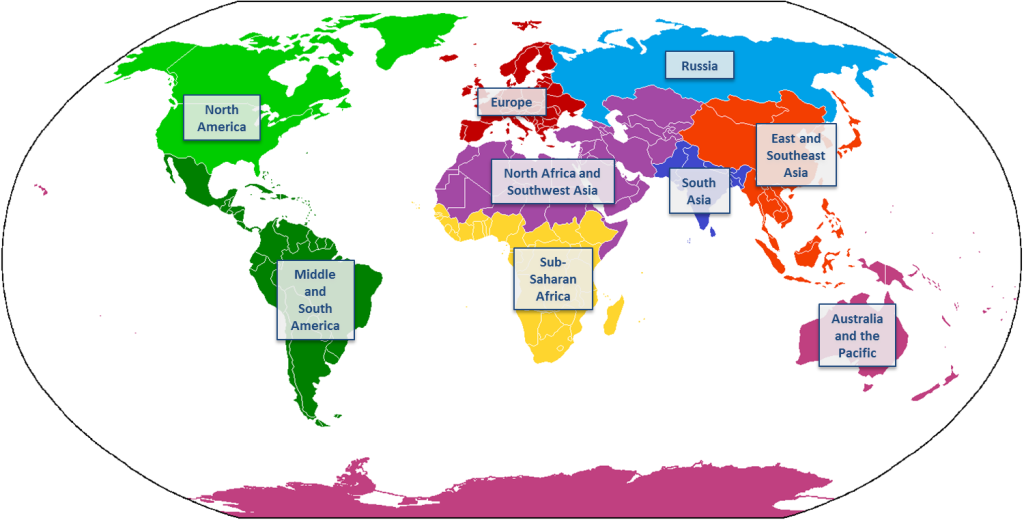
This text takes a balanced approach to “lumping and splitting,” identifying nine distinct world regions (see Figure 1.17). These regions are largely vernacular, however. Where does “Middle” America end and “South” America begin, and why is it combined into a single region? Why is Pakistan, a predominantly Muslim country, characterized as “South” Asia and not “Southwest” Asia? Why is Russia its own region? You might divide the world into entirely different regions, maybe seven based on the continents, or just two: the “core” and the “periphery.” These nine regions are not universally agreed-upon; they are simply foundations for discussing the different areas of the world.
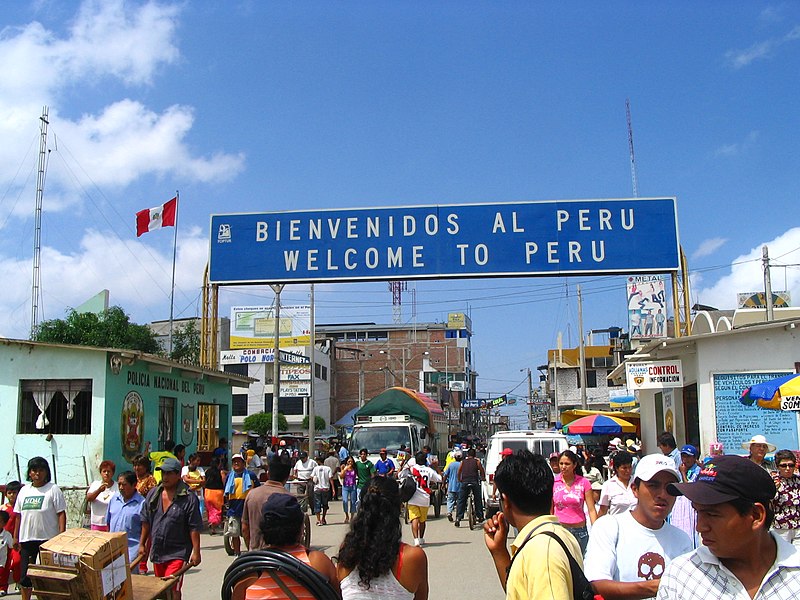
Furthermore, while it might seem like there are clear boundaries between the world’s regions, in actuality, where two regions meet are zones of gradual transition. These transition zones are marked by gradual spatial change. Moscow, Russia, for example, is quite similar to other areas of Eastern Europe, though they are considered two different regions on the map. Were it not for the Rio Grande and a large border fence dividing the cities of El Paso, Texas and Ciudad Juárez, Mexico, you might not realize that this metropolitan area stretches across two countries and world regions. Even within regions, country borders often mark spaces of gradual transition rather than a stark delineation between two completely different spaces. The border between Peru and Ecuador, for example, is quite relaxed as international borders go and residents of the countries can move freely across the boundary to the towns on either side (see Figure 1.18).
1.7 Sub-disciplines of Geography
Geography has two primary branches, physical and human geography, but numerous sub-disciplines, many of which include both physical and human elements. Furthermore, as with world regions, it’s often difficult to make precise boundaries between fields of study. A geographer might be a human geographer who specializes in culture who further specializes in religion. That same geographer might also conduct side research on environmental issues. And she might, in her spare time, investigate geographies of fictional landscapes. One benefit of geography is that its breadth offers a wide array of phenomena to explore. Everything happens somewhere, and thus everything is geographical.
Within physical geography, the main sub-disciplines are: biogeography (the study of the spatial distribution of plants and animals), climatology (the study of climate), hydrology (the study of water), and geomorphology (the study of Earth’s topographic features). This list is not inclusive, however. Some geographers study geodesy, the scientific measurement and representation of Earth. Others study pedology, the exploration of soils. What unites physical geographers is an emphasis on the scientific study of the physical features of Earth in all of its many forms.
Human geography, too, consists of a number of sub-disciplines that often overlap and interact. The main sub-disciplines of human geography include: cultural geography (the study of the spatial dimension of culture), economic geography (the study of the distribution and spatial organization of economic systems), medical geography (the study of the spatial distribution of health and medicine), political geography (the study of the spatial dimension of political processes), population geography (also known as demography, the study of the characteristics of human populations), and urban geography (the study of urban systems and landscapes). Human geographers essentially explore how humans interact with and affect the earth.
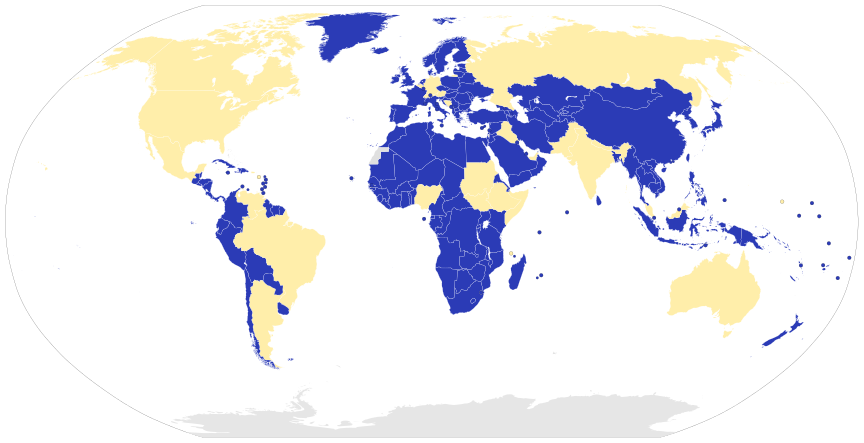
Political geography provides the foundation for investigating what many people understand as geography: countries and governmental structures. Political geographers ask questions like “Why does a particular state have a conflict with its neighbor?” and “How does the government of a country affect its voting patterns?” When political geographers study the world, they refer to states, which are independent, or sovereign, political entities recognized by the international community. States are commonly called “countries” in the United States; Germany, France, China, and South Africa are all “states.” So how many states are there in the world? The question is not as easy to answer as it might seem. What if a state declares itself independent, but is not recognized by the entirety of the international community? What if a state collaborates so closely with its neighbor that it gives up some of its sovereignty? What happens if a state is taken over by another state? As of 2019, there are 206 states that could be considered sovereign, though some are disputed and are only recognized by one other country. Only 193 states are members of the United Nations. Others, like Palestine, are characterized as “observer states.” The United States Department of State recognizes 195 states as independent, including the Holy See, often known as Vatican City, and Kosovo, a disputed state in Southeastern Europe.
In addition to questions of sovereignty, political geographers investigate the various forms of government found around the world (see Figure 1.19). States govern themselves in a variety of ways, but the two main types of government are unitary and federal. In a unitary state, the central government has the most power. Local or regional governments might have some decision-making power, but only at the command of the central government. Most of the states of the world have unitary systems. A federal state, on the other hand, has numerous regional governments or self-governing states in addition to a national government. Several large states like the United States, Russia, and Brazil are federations.
Economic geographers explore the spatial distribution of economic activities. Why are certain states wealthier than others? Why are there regional differences related to economic development within a country? All countries have some sort of economic system but have different resources, styles of development, and government regulations. So how can we compare countries in terms of economic development? One way is by examining a country’s gross domestic product (GDP), the value of all the goods and services produced in a country in a given year. Often, it is helpful to divide GDP by the number of people in a country; this is known as GDP per capita and it roughly equates to average income. However, goods have different costs in different countries, so GDP per capita is generally given in terms of purchasing power parity (PPP), meaning that each country’s currency is adjusted so that it has roughly the same purchasing power. Thus, GDP per capita in terms of PPP simply refers to the amount of goods and services produced in a country divided by the number of people in that country and then adjusted for how much goods and services actually cost in that country.
One limitation of GDP is that it only takes into account the goods and services produced domestically. However, many businesses today have locations and production facilities in other countries. Gross national income (GNI) is a way to measure a country’s economic activity that includes all the goods and services produced in a country (GDP) as well as income received from overseas.
1.8 Globalization and Inequality
When we start to explore the spatial distribution of economic development, we find that there are stark differences between and within world regions. Some countries have a very high standard of living and high average incomes, while others have few resources and high levels of poverty. Politically, some countries have stable, open governments, while others have long-standing authoritarian regimes. Thus, world regional geography is, in many ways, a study of global inequality. But the geographic study of inequality is more than just asking where inequalities are present, it is also digging deeper and asking why those inequalities exist.
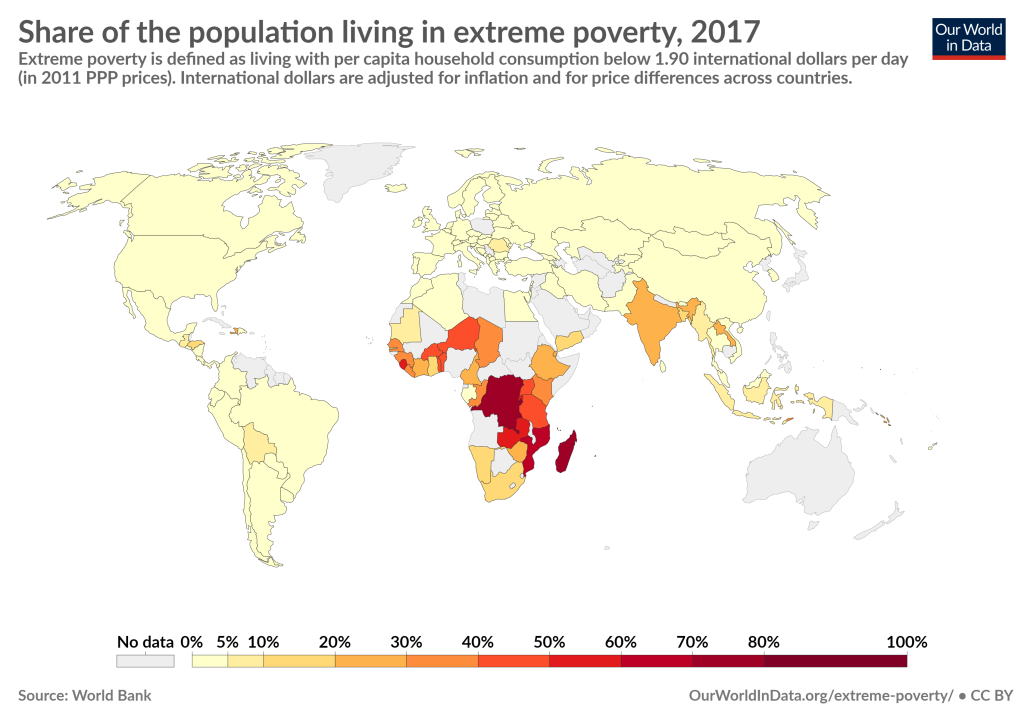
How can we measure inequality? Generally, inequality refers to uneven distributions of wealth, which can actually be challenging to measure. By some accounts, the wealthiest one percent of people in the world have as much wealth as the bottom 99 percent. Wealth inequality is just one facet of global studies of inequality, however. There are also differences in income: around half of the world survives on less than $2 per day, and around one-fifth have less than $1 per day (see Figure 1.20). There are also global differences in literacy, life expectancy, and healthcare. There are differences in the rights and economic opportunities for women compared to men. There are differences in the way resources are distributed and conserved.
Furthermore, these differences don’t exist in a bubble. The world is increasingly interconnected, a process known as globalization. This increased global integration is economic but also cultural. An economic downturn in one country can affect its trading partners half a world away. A Hollywood movie might be translated in dozens of different languages and distributed worldwide. Today, it is quite easy for a businesswoman in the United States to video chat with her factory manager in a less developed country. For many, the relative size of the world is shrinking as a result of advances in transportation and communications technology.
For others, though, particularly those in the poorest, most debt-ridden countries, the world is not flat. As global poverty rates have decreased over the past few decades, the number of people living in poverty within Sub-Saharan Africa has increased. In addition, while global economic integration has increased, most monetary transactions still occur within rather than between countries. The core countries can take advantage of globalization, choosing from a variety of trading partners and suppliers of raw materials, but the same cannot always be said of those in the periphery. Globalization has often led to cultural homogenization, as “Western” culture has increasingly become the global culture. American fast food chains can now be found in a majority of the world’s countries. British and American pop music plays on radio stations around the world. The Internet in particular has facilitated the rapid diffusion of cultural ideas and values. But how does globalization affect local cultures? Some worry that as global culture has become more homogenized, local differences are slowly erasing. Traditional music, clothing, and food preferences might be replaced by foreign cultural features, which can lead to conflict. There is thus a tension between globalization, and the benefits of global connectivity, and local culture.
It is the uniqueness of the world’s regions, the particular combination of physical landscapes and human activities, that has captivated geographers from the earliest explorers to today’s researchers. And while it might simply be interesting to read about distant cultures and appreciate their uniqueness, geographers continue to dig deeper and ask why these differences exist. Geography matters. Even as we have become more culturally homogeneous and economically interconnected, there remain global differences in the geography of countries and these differences can have profound effects. Geographic study helps us understand the relationship between the world’s communities, explain global differences and inequalities, and better address future challenges.
the location of a place relative to other places
references an exact point on Earth and commonly uses specific coordinates like latitude and longitude
imaginary lines that run laterally, parallel to the equator, around the earth and measure distances north or south of the equator
imaginary lines that circle the earth and converge at the poles, measuring distances east and west of the Prime Meridian
also referred to as geographic information systems, or GIS; a program that uses computers and satellite imagery to capture, store, manipulate, analyze, manage, and present spatial data
changes that occur in area, shape, distance, and/or direction when representing a spherical Earth on the flat surface of a map
the ratio between the distance between two locations on a map and the corresponding distance on Earth’s surface
refers to the spreading of an idea, object, or feature from one place to another
a theory that describes the movement of rigid, tectonic plates above a bed of molten, flowing material
global changes in temperature and the patterns of weather over an extended period of time
the measure of a country’s population growth calculated by subtracting its death rate from its birth rate, also referred to as RNI
the average number of children born to a woman during her childbearing years, also referred to as TFR
a model that demonstrates the changes in birth rates, death rates, and population growth over time as a country develops, also referred to as the DTM
the increased proportion of people living in urban areas
a region that shares at least one common characteristic, sometimes also called homogeneous regions
a region united by a particular function, often economic, sometimes also called nodal regions
n area between two regions that is marked by a gradual spatial change
an independent and sovereign political entity recognized by the international community
a political system characterized by a powerful central government
a political system characterized by regional governments or self-governing states
the value of all the goods and services produced in a country in a given year
the value of all the goods and services produced in a country in a given year and the income received from overseas
the increasing interconnectedness and integration of the countries of the world resulting from advances in communication and transportation technology
