8
Chapter Learning Outcomes
- Define social stratification, and compare and contrast class and caste systems of stratification. Explain the means through which systems of social stratification change and are maintained.
- Define social class, outline the strata of the social class system in the U.S. and discuss and provide examples of the consequences of social class position.
- Review and explain trends in the distribution of income and wealth in the U.S., and outline factors associated with inequality.
- Define and outline the types of social mobility.
- Define poverty and review and assess how poverty is measured in the U.S.
- Outline and explain the patterns of poverty in the U.S. and assess the theories on the cause of poverty.
8.1 Systems of Stratification
Sociologists use the term social stratification to describe the ranking members of society into socioeconomic tiers based on factors like wealth, income, race, gender, education, and power. Except for pre-agrarian societies, every society is stratified to some extent, and some societies are more stratified than others. In industrial and post-industrial societies, stratification is usually determined by income and other forms of wealth, such as stocks and bonds, but resources such as power and prestige also matter. No matter what determines it, a society’s stratification has significant consequences for its members’ opportunities, attitudes and behavior. Sociologist Max Weber (1864-1920) coined the term life chances to describe patterns of intergenerational mobility and status consistency. Weber suggested that the social class we are born into largely determines the social class we end up in by either providing opportunities or barriers to success. Life chances often determine how well people do in such areas as education, income and health.
In the United States, people like to believe everyone has an equal chance at success, which perpetuates the belief that people control their own social standing. However, sociologists recognize that social stratification is a society-wide system. While there are always inequalities between individuals, sociologists are interested in larger social patterns. Stratification Is not about individual inequalities, but about systematic inequalities based on group membership, classes, and the like. No individual, rich or poor, can be blamed for social inequalities. The structure of society affects a person’s social standing. Although individuals may support or fight inequalities, social stratification is created and supported by society as a whole. We will see examples of the consequences of social stratification in the pages ahead. (OpenStax, Sociology 2e, Attribution International (CC BY 4.0); download for free at http://cnx.org/contents/ 02040312-72c8-441e-a685-20e9333f3e1d@10.1).
Sociologists have identified two major types of systems of stratification, closed and opened. In closed systems of stratification, an individual has virtually no chance of moving up or down, therefore in such systems, placement into strata (or layers) of the system is ascribed (assigned at birth). Open systems of stratification have more vertical mobility, as some people, and perhaps many people, can move up or even down the stratification ladder. If a system of stratification is truly open, one’s position in such a system would be an achieved status. That said, a key question is how much vertical mobility, upward or downward movement in the system of stratification, really exists in these societies. Even in systems that are considered to be open, placement is the system is typically influenced by both achievement and ascription.
Caste Systems
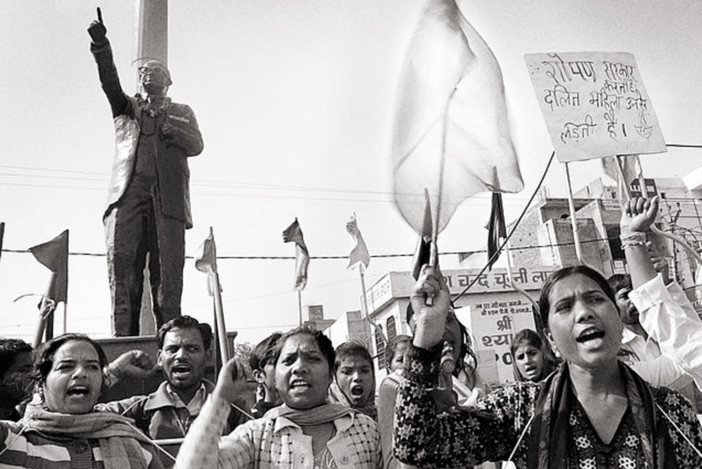
In a caste system, people are born into unequal groups based on their parents’ status and remain in these groups for the rest of their lives. For many years, the best-known caste system was in India, where, supported by Hindu beliefs emphasizing the acceptance of one’s fate in life, several major castes dictated one’s life chances from the moment of birth, especially in rural areas (Kerbo, 2009). People born in the lower castes lived in abject poverty throughout their lives. Another caste, the untouchables, or Dalit, was considered so low that technically it was not thought to be a caste at all. People in this caste were called the untouchables because they were considered unclean and were prohibited from coming near to people in the higher castes. Traditionally, caste membership in India almost totally determined an individual’s life, including what job you had and whom you married; for example, it was almost impossible to marry someone in another caste. After India won its independence from Britain in 1949, its new constitution granted equal rights to the Dalit. Modern communication, mounting industrialization and migration into cities further weakened the caste system, as members of different castes now had more contact with each other. Still, caste prejudice remains a problem in India, particularly in rural communities, and illustrates the continuing influence of its traditional system of social stratification.
A country that used to have a caste system is South Africa. In the days of apartheid, from 1950 to 1990, a small group of white Afrikaners (South Africans of Dutch descent) ruled the country. Black South Africans constituted more than three-quarters of the nation’s population and thus greatly outnumbered Afrikaners, but they were assigned the worst jobs, could not vote and lived in poor, segregated neighborhoods. Afrikaners bolstered their rule with the aid of South African police, which used terror tactics to intimidate blacks (Berger, 2009). This form of caste is referred to as a racial caste system, since race determines position in the stratification system.
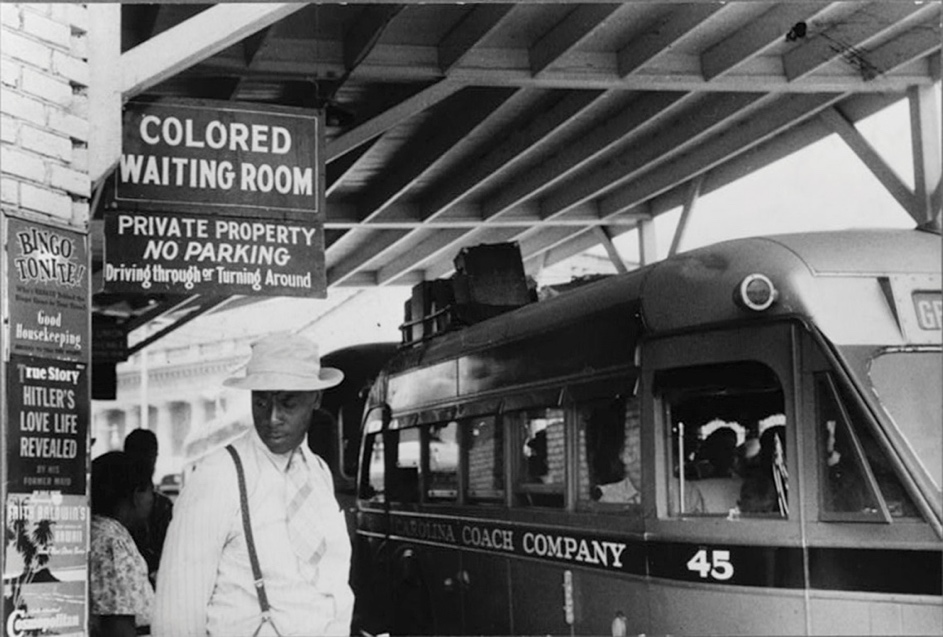
Similarly, a system of racial caste existed in the United States beginning with slavery as Black people were born into slavery and had no opportunity to change their social class standing. After the ending of chattel slaver, in 1877 at the end of the period of Reconstruction and lasting until the civil rights movement of the 1960’s, which ended de jure (legal) segregation. A segregated system called Jim Crow dominated the South, and even though Black Americans had some rights, including the right to vote, granted to them by the 13th, 14th and 15th Amendments of the Constitution, these rights were denied in practice. Terror tactics, such as lynchings, were common practice, and the southern police and court systems bolstered white rule in the South just as the South African system bolstered white rule in that country (Litwack, 2009).
Class Systems
Many societies, including all industrial and post-industrial ones, have class systems. In this system of stratification, a person is born into a social ranking but can move up or down in rank more readily in comparison to closed systems of stratification. This movement in either direction can result from a person’s own effort, knowledge and skills, or lack of them. Although these qualities do not aid upward movement in estate, caste or slave societies, they can enable upward movement in class societies. Of the three systems of stratification discussed so far, class systems are by far the most open, meaning they have the most vertical mobility. We will look later at social class in the United States and discuss the extent of vertical mobility in American society.
Sociologist Max Weber had much to say about class systems of stratification. Such systems, he wrote, are based on three dimensions of stratification: wealth, power, and prestige. Wealth (sometimes referred to as property) is the total value of an individual or family, including income, stocks, bonds, real estate, and other assets; power is the ability to influence others to do your bidding, even if they do not want to; and prestige refers to the status and esteem people hold in the eyes of others. It is important to note that wealth is not the same as income. Income is defined as the amount of money someone has coming in from work wages or investments. Income is not inherited, but wealth can be passed down from generation to generation.
In discussing these three dimensions, Weber disagreed somewhat with Karl Marx, who said our ranking in society depends on whether we own the means of production. Marx thus felt that the primary dimension of stratification in class systems was economic. Weber readily acknowledged the importance of this economic dimension but thought power and prestige also matter. He further said that although wealth, power, and prestige usually go hand-in-hand, they do not always overlap. For example, although the head of a major corporation has a good deal of wealth, power, and prestige, we can think of many other people who are high on one dimension but not on the other two. A professional athlete who makes millions of dollars a year has little power in the political sense that Weber meant it. An organized crime leader might also be very wealthy but have little prestige outside the criminal underworld. Conversely, a scientist or professor may enjoy much prestige but not be very wealthy.
Classless Societies
Although, as noted earlier, all societies except perhaps for the earliest ones are stratified, some large nations have done their best to eliminate stratification by developing classless societies. Marx, of course, predicted that one day the proletariat would rise up and overthrow the bourgeoisie and create a classless society, by which he meant everyone had roughly the same amount of wealth, power, and prestige. In Russia, China, and Cuba, revolutions inspired by Marx’s vision occurred in the 20th century. These revolutions resulted in societies not only with less economic inequality than in the United States and other class systems but also with little or no political freedom. Moreover, governing elites in these societies enjoyed much more wealth, power, and prestige than the average citizen. Overall, the communist experiments in Russia, China, and Cuba failed to achieve Marx’s vision of an egalitarian society.
Some Western European nations, such as Sweden and Denmark, have developed social democracies, which mix capitalism and socialism together. Although a few have nominal monarchies, these nations have much political freedom and less economic inequality than the United States and other class societies. They also typically rank much higher than the United States on various social and economic indicators. Although these nations are not truly classless, they indicate it is possible, to have a society that begins to fulfill Marx’s egalitarian vision but where political freedom still prevails (Sandbrook, Edelman, Heller, & Teichman, 2007).
8.2 Explaining Stratification
Why is stratification so common? Is it possible to have a contemporary society without stratification? Sociologists trying to answer these questions have developed two very different macro explanations of stratification, while symbolic interactionists have examined the differences that stratification produces for everyday interaction. Table 8.2 “Theory Snapshot” summarizes these three approaches.
Table 8.2 Theory Snapshot
|
Theoretical Perspective |
Major Assumption |
| Functionalism | Stratification is necessary to motivate people with special intelligence, knowledge and skills to enter the most important occupations. For this reason, stratification is necessary and inevitable. |
| Conflict | Stratification, which is neither necessary nor inevitable, results from lack of opportunity and prejudice and discrimination against the poor, women and BIPoC by the dominant group who aim to keep power, prestige and wealth to themselves. |
|
Symbolic Interactionism |
Stratification affect’s people’s beliefs, lifestyles, daily interactions and conceptions of themselves. |
The Functionalist View
Recall from Chapter 1 that functionalist theory assumes that the various structures and processes in society exist because they serve important functions for society’s stability and continuity. In line with this view, functionalist theorists in sociology assume that stratification exists because it also serves important functions for society. This explanation was developed more than 60 years ago by Kingsley Davis and Wilbert Moore (Davis & Moore, 1945) in the form of several logical assumptions that imply stratification is both necessary and inevitable. When applied to American society, their assumptions would be as follows:
Some jobs are more important than other jobs. For example, the job of a brain surgeon is more important than the job of shoe-shining.
Some jobs require more skills and knowledge than other jobs. To stay with our example, it takes more skills and knowledge to do brain surgery than to shine shoes.
Relatively few people have the ability to acquire the skills and knowledge that are needed to do these important, highly skilled jobs. Most of us would be able to do a decent job of shining shoes, but very few of us would be able to become brain surgeons.
To induce the people with the skills and knowledge to do the important, highly skilled jobs, society must promise them higher incomes or other rewards. If this is true, some people automatically end up higher in society’s ranking system than others, and stratification is thus necessary and inevitable. To illustrate this, say we have a society where shining shoes and doing brain surgery both give us incomes of $150,000 per year. (This example is very hypothetical, but please keep reading.) If you decide to shine shoes, you can begin making this money at age 16, but if you decide to become a brain surgeon, you will not start making this same amount until about age 35, as you first must go to college and medical school and then acquire several more years of medical training. While you have spent 19 additional years beyond age 16 getting this education and training and taking out tens of thousands of dollars in student loans, you could have spent these 19 years shining shoes and making $150,000 a year, or $2.85 million overall. Which job would you choose?
As this example suggests, many people might not choose to become brain surgeons unless considerable financial and other rewards awaited them. By extension, we might not have enough people filling society’s important jobs unless they know they will be similarly rewarded. If this is true, we must have stratification. This all sounds very logical, but a few years after Davis and Moore published their functionalist theory of stratification, other sociologists pointed out some serious problems in their argument (Tumin, 1953; Wrong, 1959).
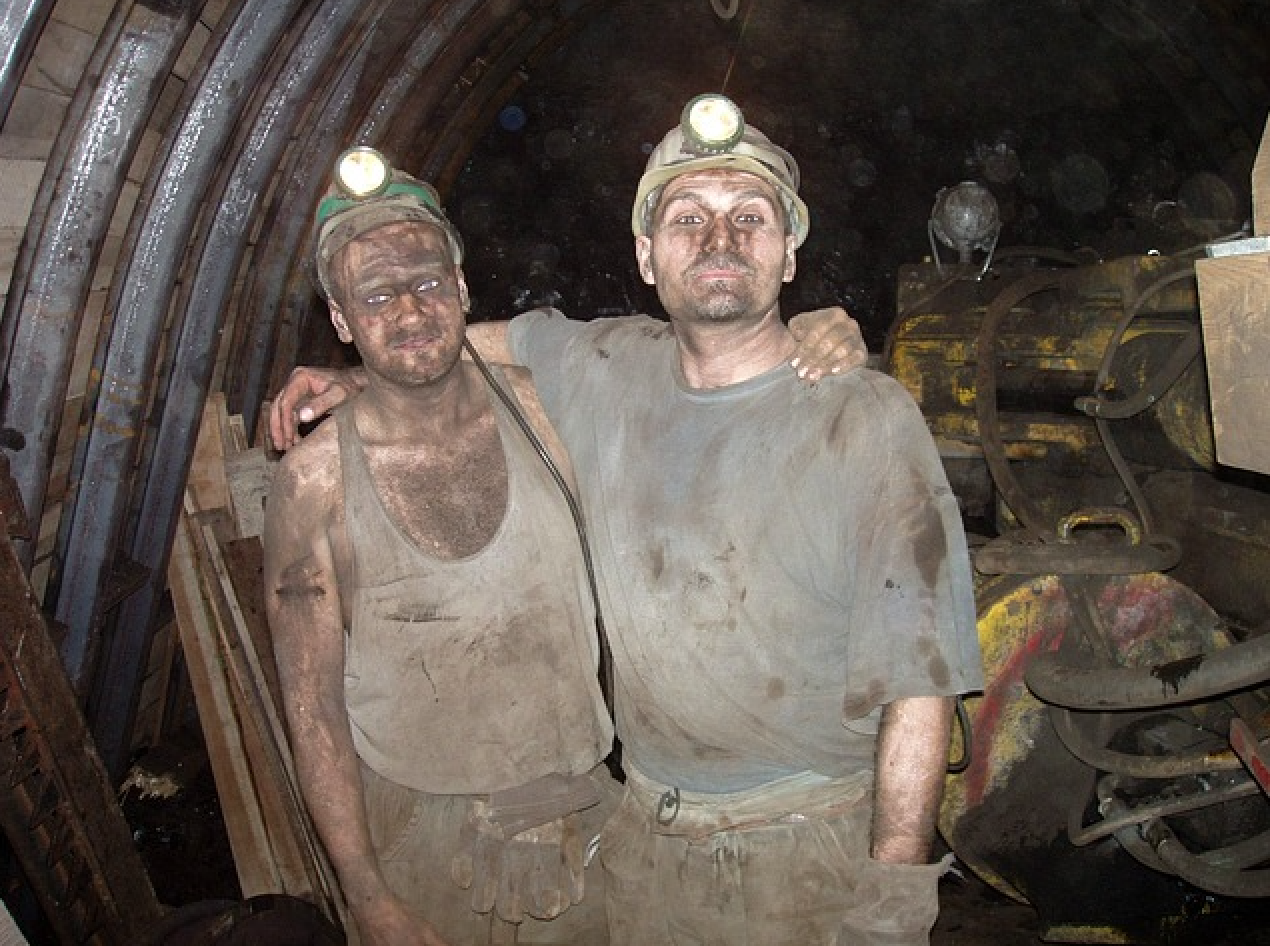
First, it is difficult to compare the importance of many types of jobs. For example, which is more important, doing brain surgery or mining coal? Although you might be tempted to answer “brain surgery,” if no coal were mined, much of our society could not function.
Second, the functionalist explanation implies that the most important jobs have the highest incomes and the least important jobs the lowest incomes, but many examples, including the ones just mentioned, counter this view. Coal miners make much less money than physicians, and professors, for better or worse, earn much less on the average than lawyers. A professional athlete making millions of dollars a year earns many times the income of the president of the United States, but who is more important to the nation? Elementary school teachers do a very important job in our society, but their salaries are much lower than those of sports agents, advertising executives, and many other people whose jobs are far less essential.
Third, the functionalist view also implies that people move up the economic ladder based on their abilities, skills, knowledge, and, more generally, their merit. If this is true, another implication is that if they do not move up the ladder, they lack the necessary merit. This view ignores the fact that much of our stratification stems from lack of equal opportunity, as our Monopoly example at the beginning of the chapter made clear. Because of their race, ethnicity, gender, and class standing at birth, some people have less opportunity than others to acquire the skills and training they need to fill the types of jobs addressed by the functionalist approach.
Finally, the functionalist explanation might make sense up to a point, but it does not justify the extremes of wealth and poverty found in the United States and other nations. Even if we do have to promise higher incomes to get enough people to become physicians, does that mean we also need the amount of poverty we have? In order to get enough qualified people to become CEOs, do they really need to make 271 times more than the average worker, as they did at the at the largest 350 companies in the U.S. in 2016 (Donnelly, 2017)? Don’t people take on a CEO job or other high-paying job at least partly because of the challenge, working conditions, and other positive aspects they offer? The functionalist view does not answer these questions adequately.
While sociologists have been critiquing the Kingsley Davis and Wilbert Moore functionalist approach for decades, perhaps one of more scathing critiques comes from Herbert Gans (1971) who documents 13 different functions of poverty that contribute to the stability of a capitalist economic system. Among them are that having a significant portion of the population in poverty ensures that the “dirty work” will get done by people who are too desperate to say no. Also, having a significant poor population creates jobs for people who provide them services such as social workers, and people who work in the criminal justice system and non-profit sector jobs. Another “need” met by poverty is that the poor provide entertainment for the non-poor and provide an outlet for the wealthy to do charitable, philanthropic work, both of which allow the non-poor to feel superior. Gans’s 13 functions of poverty might be perfectly “functional” but they also could be considered insulting, and the last half of his analysis provides alternatives that are not as exploitative of the poor. For more information, do an online search for – The Uses of Poverty: The Poor Pay All, by Herbert Gans.
The Conflict View
Conflict theory’s explanation of stratification draws on Karl Marx’s view of class societies and incorporates the critique of the functionalist view just discussed. Many different explanations grounded in conflict theory exist, but they all assume that stratification stems from a fundamental conflict between the needs and interests of the powerful, or “haves,” in society pitted against those of the weak, or “have-nots” (Kerbo, 2009). The former take advantage of their position at the top of society to stay at the top, even if it means oppressing those at the bottom. At a minimum, they can heavily influence the law, the media, and other institutions in a way that maintains society’s unequal class structure.
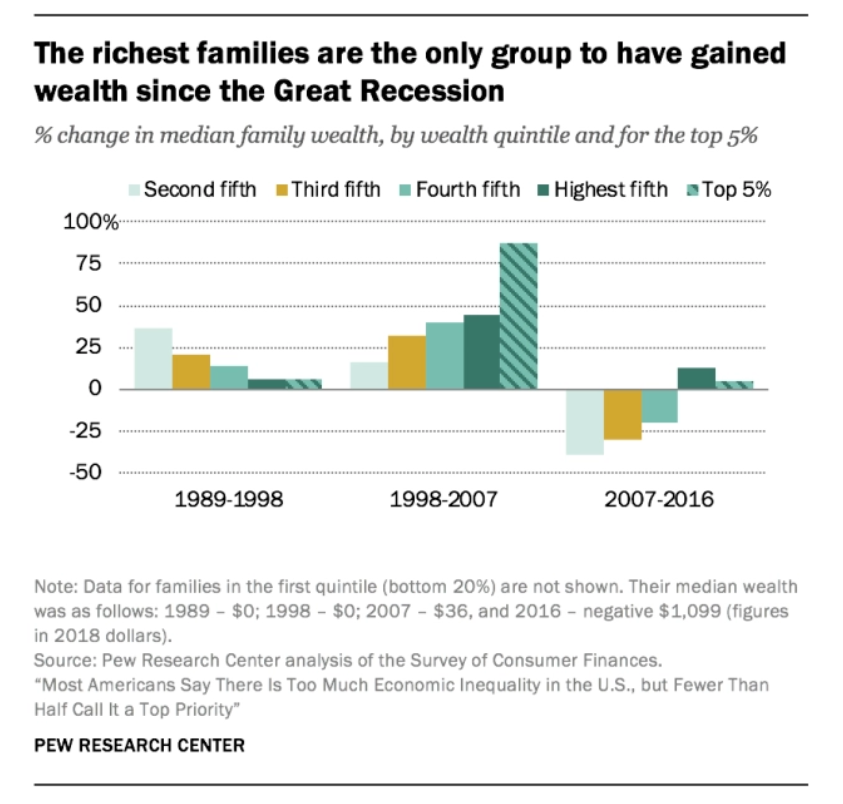
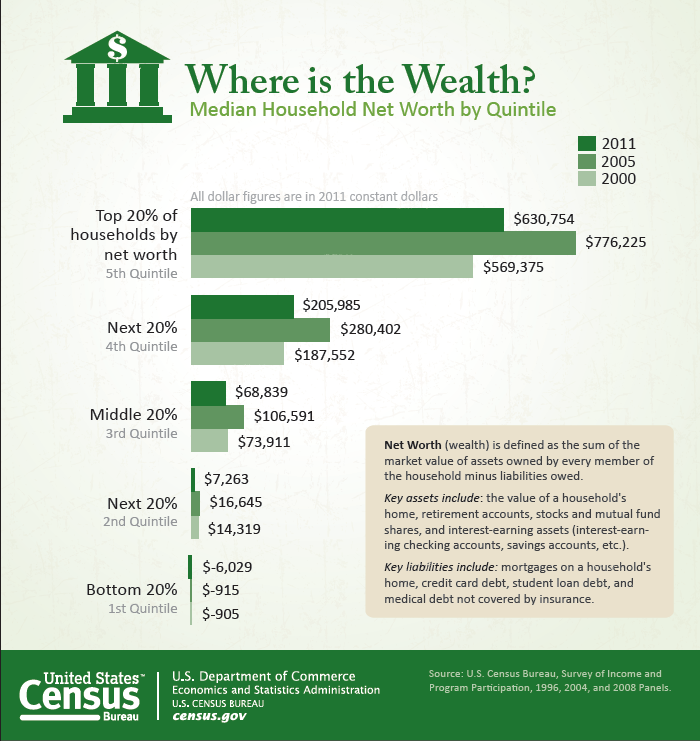
In explaining stratification, conflict theory emphasizes ideology, or a set of ideas that justifies the status quo. This emphasis goes back to the work of Marx, who said the ruling class shapes and even controls the ideas of a society. It tries to shape these ideas so that they justify the existing order and decrease the chances that the poor will challenge it. The key goal of the ruling class is to prevent the poor from achieving class consciousness, or an awareness of their oppression (Marx & Engels, 1947). If the poor instead do not recognize their interests as a class that does not control the means of production, the suffer from false class consciousness. One might argue that many middle and lower income Americans suffer from a false class consciousness and this why many of them do not support increased taxes on the wealthiest Americans or increased minimum wages despite the fact that the top 5% of earners have had a faster annual change in mean family income than all other families (See Figure 8.2). Furthermore, the top 20% is the only group in the United States that has gained wealth since the Great Recession (See Figure 8.3)
Figure 8.2 Average Annual Change in Mean Family Income by Quintile
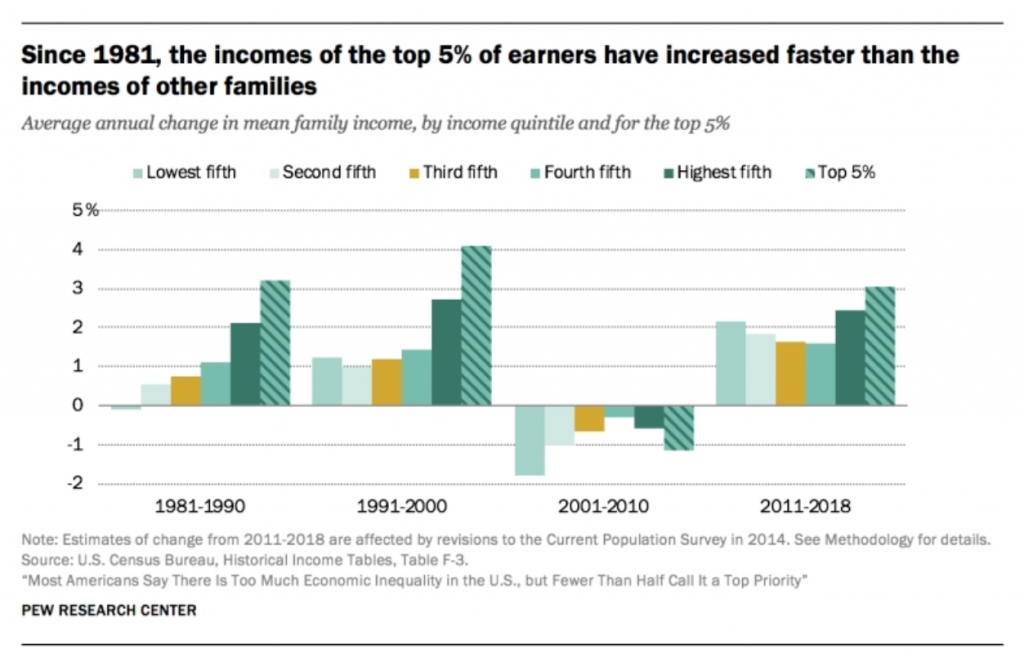
Figure 8.3 Percent Change in Median Family Wealth by Quintile
As an example, Marx called religion the “opiate of the masses.” By this he meant that religious beliefs influence the poor to feel that their fate in life is God’s will or a test of their belief in God. If they hold such beliefs, they will neither blame their poverty on the rich nor rebel against them. Religious beliefs help create false consciousness.
Ideological beliefs bolster every system of stratification and domination. In slave societies, the dominant ideology, and one that at least some slaves accepted, was that slaves are inferior to their masters and deserved no better fate in life. When U.S. slavery existed in the South, it was commonly thought that blacks were biologically inferior and suited only to be slaves. Caste societies, as we noted earlier, have similar beliefs that justify the existence and impact of the caste system. Hitler’s “final solution” likewise rested on the belief that Jews and other groups he targeted were biologically inferior and deserving of extermination.
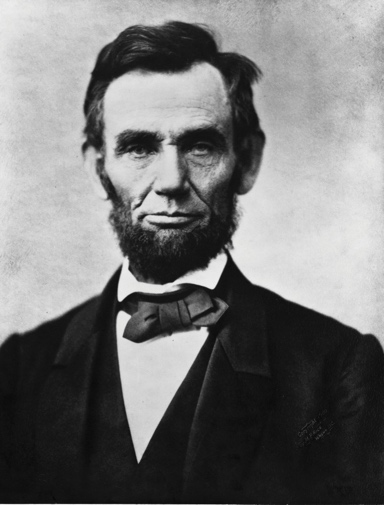
Ideological beliefs in class societies are subtler and more complex but nonetheless influential. One of the most important beliefs in the United States is the American Dream, epitomized by the story of Abraham Lincoln. According to this belief, people born into poverty can lift themselves up by the bootstraps and become successful if they work hard enough. By implication, if people remain poor, they are not trying hard enough or have other personal deficiencies keeping them in poverty. This ideology prompts many Americans to take a blaming-the-victim approach by blaming poverty on laziness and other problems in the poor rather than on discrimination and the lack of opportunity in society. To the extent that people accept such ideological beliefs, they are less likely to criticize the existing system of stratification. Marx did not foresee the extent to which these beliefs would impede the development of class consciousness in the United States.
International data underline this American ideology. About 60% of Americans attribute poverty to laziness and lack of willpower, compared to less than half that in Mexico, Russia, Spain, and Sweden. Belief in the American Dream evidently helps lead to a blaming-the-victim ideology that blames the poor for their own fate.
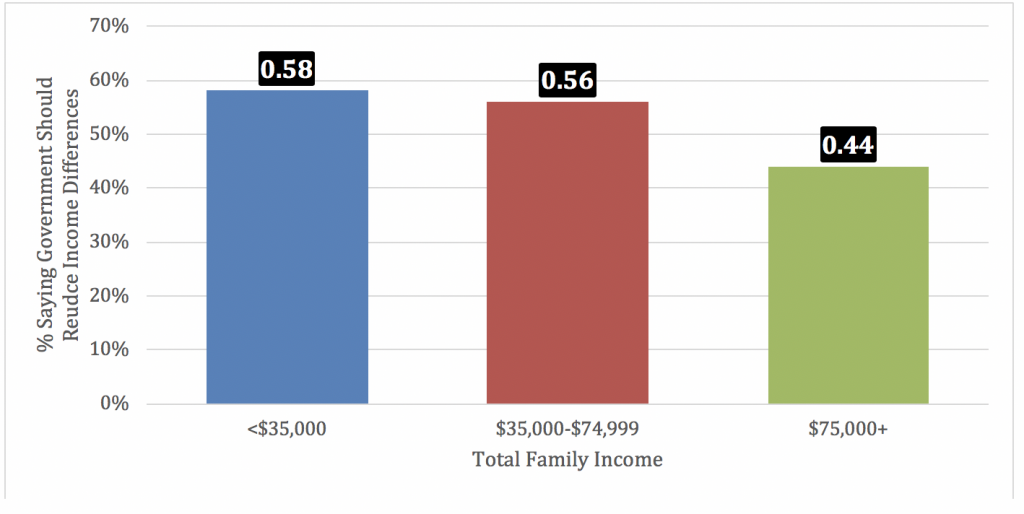
Conflict theory assumes that class position influences our perceptions of social and political life, even if not to the degree envisioned by Marx. Some national survey data support this assumption. A General Social Survey question asks whether it is the government’s responsibility to “reduce income differences between the rich and poor.” As Figure 8.4 “Annual Family Income and Belief That Government “Should Reduce Income Differences Between the Rich and Poor”” shows, low- and middle-income people are more likely than high-income people to think the government has this responsibility.
Figure 8.4 Annual Family Income and Belief That Government “Should Reduce Income Differences Between the Rich and Poor”
Social Movements
Despite the use of ideology to justify and perpetuate systems of social stratification and the fact that a certain portion of the population will buy into such ideologies, there are also individuals and groups who resist, work to change or organize to overthrow systemic inequality. In addition to outright revolution and warfare which, as discussed earlier in this chapter, helped lead to the eradication of the estate system in Europe and overturned the slave system in the U.S., organized social movements in the U.S. and many other nations have been great forces for social change. Social movements are organized efforts by a large number of people to bring about or impede social, political, economic or cultural change.
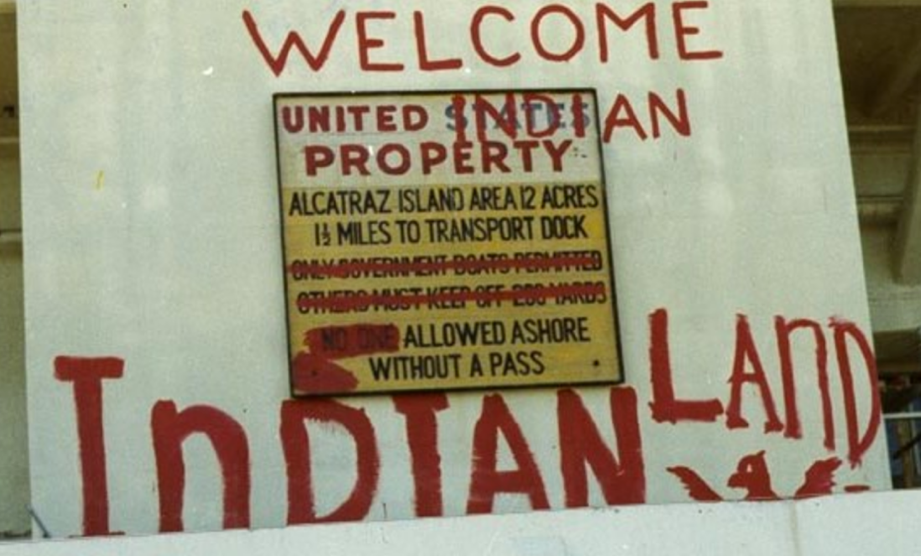
Sociologists identify several types of social movements according to the nature and extent of the change they seek, however the form of social movement significant to those seeking to change systems of social stratification is the reform movement. Reform movements seek limited, though still significant changes in some aspect of a nation’s political, economic or social systems. They do not try to overthrow the existing government but rather work to improve conditions within the existing regime. Some of the more important social movements in U.S. history have been reform movements. These include, but are not limited to the abolitionist movement preceding the Civil War; the women’s suffrage movement and the labor movement which were significant in the late-1800’s and early 1900’s; the post-WWII civil rights movement; the antiwar movement associated with the Vietnam War in the 1970’s; the American Indian, Black Power and Chicano Movements, which gained traction in the 1960’s and 1970’s; the contemporary feminist movements; the gay rights movement following the Stonewall Riots of 1969, and so on.
Social movements sometimes work within the system to effect change, such as pushing court cases through to the Supreme Court of the United States, where decisions can bring about dramatic change. Two well-known examples from the civil rights era were the 1954 Brown V. Board of Education, Topeka, and the 1967 Loving v. Virginia cases. These landmark cases declared public school segregation to be unconstitutional and invalidated state laws prohibiting interracial marriage, respectively. These major victories of the civil rights movement helped to eliminate the system of de jure (legal) segregation and brought about cascading change regarding the rights and interests of the Black population. More recently, in the Obergefell v. Hodges case, decided in 2015, the Supreme Court ruled that the fundamental right to marry is guaranteed to same-sex couples by the 14th Amendment to the U.S. Constitution, a cause that had been long fought for by the gay rights movement. More often though, social movements work outside the system by engaging in various kinds of protest, including demonstrations, picket lines, sit-ins, non-violent resistance and sometimes outright violence.
Regardless of the strategies, social movements arise when certain political, economic or other problems exist to such a degree that people are prompted to act due to their dissatisfaction with society. These problems might include a faltering economy, a lack of political freedom or discrimination based on race, ethnicity, gender, sexual orientation, etc. Rather than blindly accepting the dominant ideology which serves to justify the inequalities associated with social stratification, those involved in social movements seek to change the system in order to bring about greater freedom and equality.
Symbolic Interactionism
Consistent with its micro-orientation, symbolic interactionism tries to understand stratification by looking at people’s interaction and understandings in their daily lives. Unlike the functionalist and conflict views, it does not try to explain why we have stratification in the first place. Rather, it examines the differences that stratification makes for people’s lifestyles and their interaction with other people.
One of the most insightful analyses of stratification that fits into a symbolic interactionist framework was Thorstein Veblin’s (1899/1953) famous discussion of conspicuous consumption, or the acquisition and display by the wealthy of lavish products that show off their wealth. The very rich do not need mansions or other very opulent homes, and neither do they need a motor vehicle costing upward of $100,000 or more or jewelry costing thousands and thousands of dollars. Yet they purchase these products to demonstrate their status. At the other end of the spectrum, people in poverty within class systems struggle to meet their basic needs. Poverty is discussed later in this chapter, but for now it is sufficient to say that the poor often lead lives of quiet desperation and must find many ways of coping with the fact of being poor. Studies of the poor, too, reflect the symbolic interactionist perspective.
8.3 Social Class in the United States
There is a surprising amount of disagreement among sociologists on the number of social classes in the United States and even on how to measure social class membership. We first look at the measurement issue and then discuss the number and types of classes sociologists have delineated.
Measuring Social Class
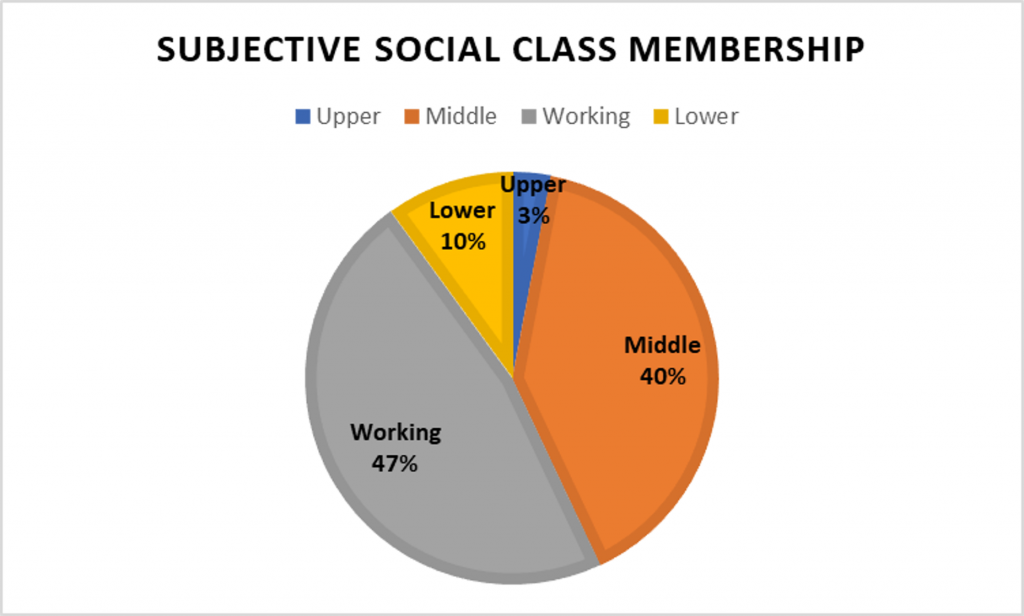
We can measure social class either objectively or subjectively. If we choose the objective method, we classify people according to one or more criteria, such as their occupation, education, and/or income. The researcher is the one who decides which social class people are in based on where they stand in regard to these variables. If we choose the subjective method, we ask people what class they think they are in. For example, the General Social Survey asks, “If you were asked to use one of four names for your social class, which would you say you belong in: the lower class, the working class, the middle class, or the upper class?” Figure 8.5 “Subjective Social Class Membership” depicts responses to this question. The trouble with such a subjective measure is that some people say they are in a social class that differs from what objective criteria might indicate they are in. This problem leads most sociologists to favor objective measures of social class when they study stratification in American society.
Figure 8. 5 Subjective Social Class Membership
Yet even here there is disagreement between functionalist theorists and conflict theorists on which objective measures to use. Functionalist sociologists rely on measures of socioeconomic status (SES), such as education, income, and occupation, to determine someone’s social class. Sometimes one of these three variables is used by itself to measure social class, and sometimes two or all three of the variables are combined to measure social class. When occupation is used, sociologists often rely on standard measures of occupational prestige. Since the late 1940s, national surveys have asked Americans to rate the prestige of dozens of occupations, and their ratings are averaged together to yield prestige scores for the occupations (Hodge, Siegel, & Rossi, 1964). Over the years these scores have been relatively stable. Here are some average prestige scores for various occupations: physician, 86; college professor, 74; elementary school teacher, 64; letter carrier, 47; garbage collector, 28; and janitor, 22.
Despite SES’s usefulness, conflict sociologists prefer different, though still objective, measures of social class that consider ownership of the means of production and other dynamics of the workplace. These measures are closer to what Marx meant by the concept of class throughout his work, and they consider the many types of occupations and workplace structures that he could not have envisioned when he was writing during the 19th century.
For example, corporations have many upper-level managers who do not own the means of production but still determine the activities of workers under them. They thus do not fit neatly into either of Marx’s two major classes, the bourgeoisie or the proletariat. Recognizing these problems, conflict sociologists delineate social class on the basis of several factors, including the ownership of the means of production, the degree of autonomy workers enjoy in their jobs, and whether they supervise other workers or are supervised themselves (Wright, 2000).
The American Class Structure
As should be evident, it is not easy to determine how many social classes exist in the United States. Over the decades, sociologists have outlined as many as six or seven social classes, but for the sake of clarity, we will limit ourselves to the four social classes included in Figure 8.5 “Subjective Social Class Membership”: the upper class, the middle class, the working class, and the lower class. Although subcategories exist within some of these broad categories, they still capture the most important differences in the American class structure (Gilbert, 2011). The annual income categories listed for each class are admittedly somewhat arbitrary but are based on the percentage of households above or below a specific income level.
Figure 8.6 Median Earnings for Full-time, Year-Round Work, Michigan Tri-cities
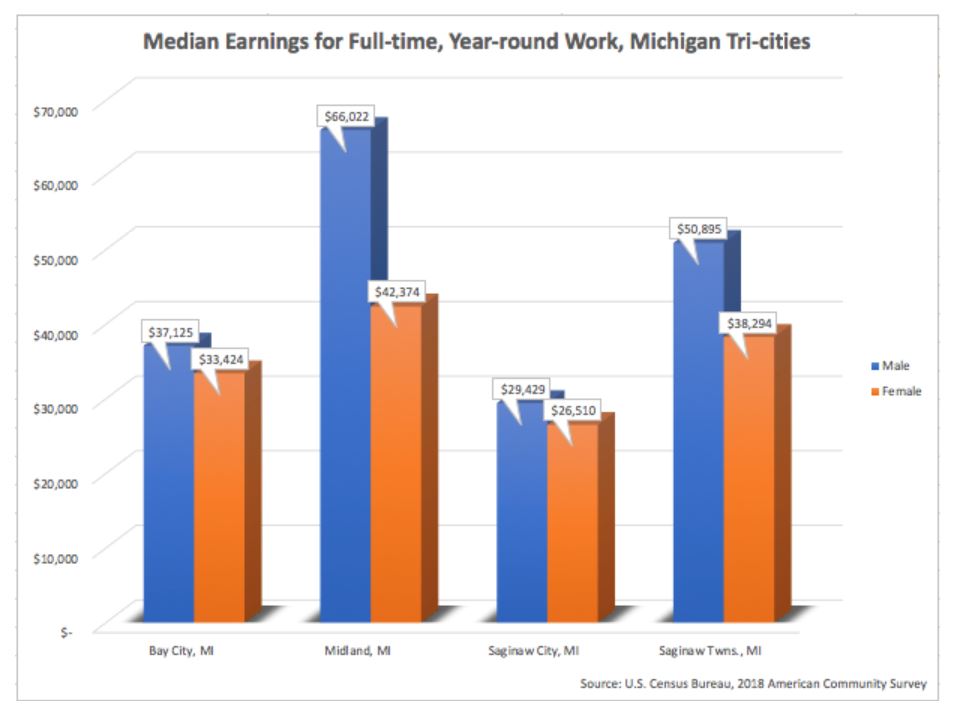
Overall, in 2019 the median household income level was $68,703. The median household income by state and within a state varies greatly as shown in Figure 8.6 “Median Earnings for Full-time, Year-round Work, Michigan Tri-cities,” Figure 8.7 “Michigan Median Household Incomes,” and Figure 8.8 “Distribution of U.S. Household Income, 2016.”
Figure 8.7 Michigan Household Incomes
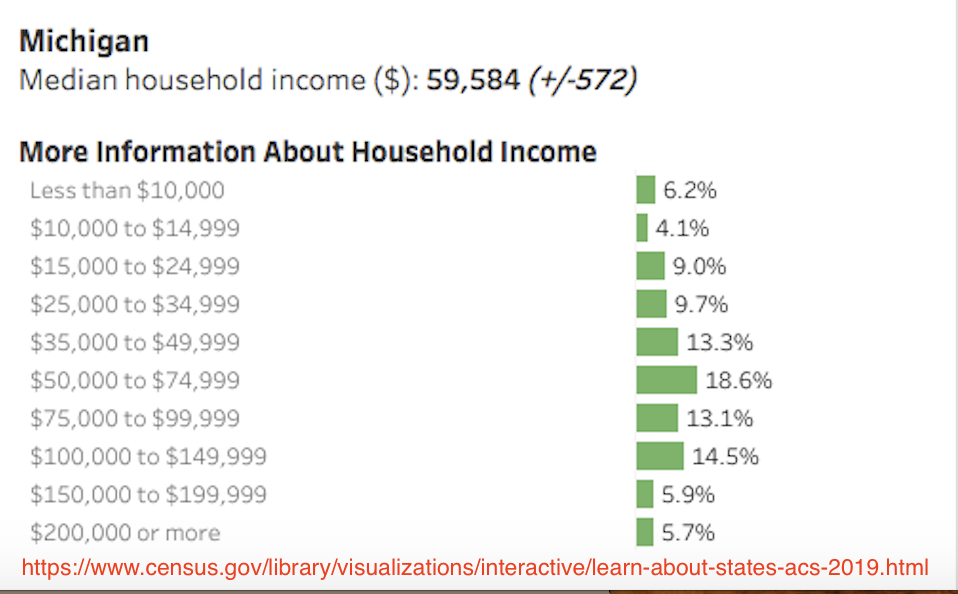
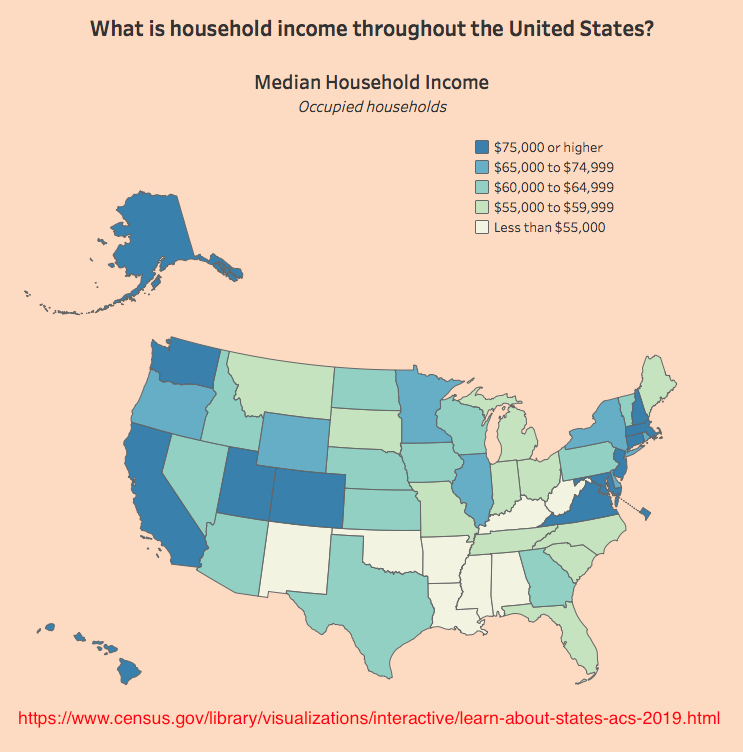
Figure 8.8 U.S. Household Income by State, 2019
The Upper Class
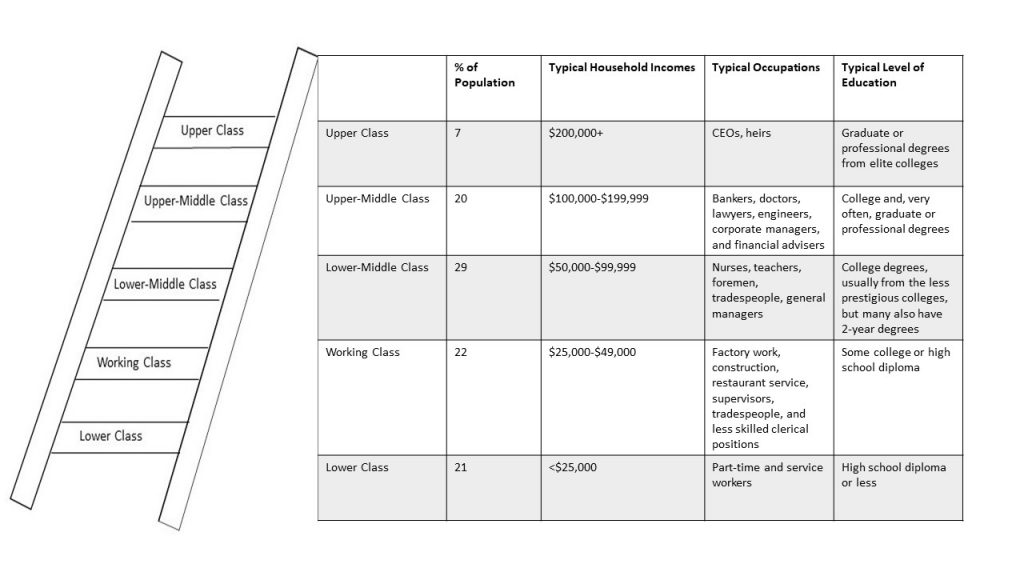
Depending on how it is defined, the upper class consists of about 7% of the U.S. population and includes households with annual incomes of more than $200,000 (Semega, Fontenot & Kollar, 2016). Some scholars would raise the ante further by limiting the upper class to households with incomes of at least $500,000 or so, which in turn reduces this class to about 1% of the population (also referred to as the capitalists), with an average wealth (income, stocks and bonds, and real estate) of several million dollars. However it is defined, the upper class has much wealth, power, and influence (Kerbo, 2009).
Members of the upper-upper class have “old money” that has been in their families for generations. They belong to exclusive clubs and life in exclusive neighborhoods; have their names in the social register; send their children to expensive private schools; serve on the boards of museums, corporations and major charities; and exert much influence on the political process and other areas of life from behind the scenes. Members of the lower-upper class have “new” money acquired through hard work, lucky investments and/or athletic prowess. In many ways, their lives are similar to those of their old-money counterparts, but they do not enjoy the prestige that old money brings. Jeff Bezos, the founder and CEO of Amazon who in 2018 has a net worth of over $100 billion and is the richest person in the United States currently, would be considered a member of the lower-upper class because his money is too “new.” Because he does not have a long-standing pedigree, upper-upper class members might even be tempted to disparage his immense wealth, at least in private.
The Middle Class
Many of us like to think of ourselves in the middle class, as Figure 8.3 “Subjective Social Class Membership” showed, and many of us are. The middle class includes the nearly 50% of all households whose annual incomes range from $50,000 to $199,999. As this very broad range suggests, the middle class includes people with many different levels of education and income and many different types of jobs. It is thus helpful to distinguish the upper-middle class from the lower-middle class on the upper and lower ends of this income bracket, respectively. The upper-middle class has household incomes from about $100,000 to $199,000, amounting to about 21% of all households. People in the upper-middle class typically have college and, very often, graduate or professional degrees; live in the suburbs or in fairly expensive urban areas; and are bankers, doctors, lawyers, engineers, corporate managers, and financial advisers, among other occupations.

The lower-middle class has household incomes from roughly $50,000 to $99,999, amounting to about 29% of all families. People in this income bracket typically work in white-collar jobs as nurses, teachers, and the like. Many have college degrees, usually from the less prestigious colleges, but many also have 2-year degrees or only a high school degree. They live somewhat comfortable lives but can hardly afford to go on expensive vacations or buy expensive cars and can send their children to expensive colleges only if they receive significant financial aid.
The Working Class
Working-class households have annual incomes between about $25,000 and $49,999 and constitute about 22% of all U.S. households. They generally work in blue-collar jobs such as factory work, construction, restaurant service, and less skilled clerical positions. People in the working class typically do not have 4-year college degrees, and some do not have high school degrees. Although most are not living in official poverty, their financial situation is very uncomfortable. A single large medical bill or expensive car repair would be almost impossible to pay without going into considerable debt.
Additionally, Working-class families are far less likely than their wealthier counterparts to own their own homes or to send their children to college. Many of them live at risk for unemployment as their companies downsize by laying off workers even in good times, and hundreds of thousands began to be laid off when the U.S. recession began in 2008.
The Lower Class
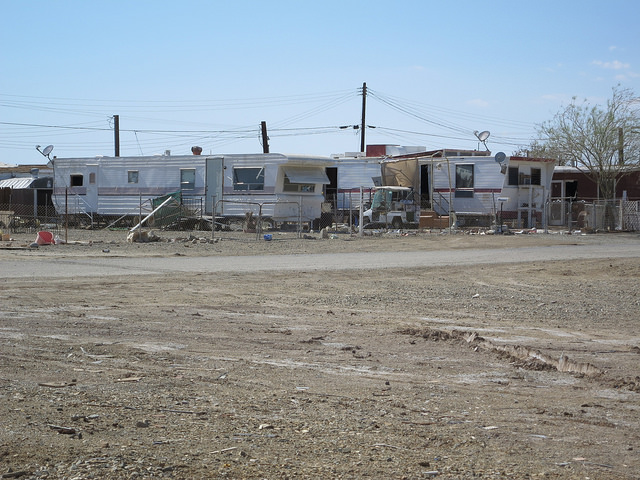
The lower class have household incomes under $25,000 and constitute about 21% of all U.S. households. Many in the lower class lack high school degrees, and many are unemployed or employed only part time in semiskilled or unskilled jobs. When they do work, they work as janitors, house cleaners, migrant laborers, and shoe shiners. They tend to rent apartments rather than own their own homes, lack medical insurance, and have inadequate diets. We will discuss the lower class further when we focus later in this chapter on inequality and poverty in the United States.
Figure 8.9 Social Class Ladder
Social Mobility
Regardless of how we measure and define social class, one question that often arises is what are our chances of moving up or down within the American class structure? As we saw earlier, the degree of vertical social mobility is a key distinguishing feature of systems of stratification. Class systems such as in the United States are thought to be open, meaning that social mobility is relatively high, in comparison to closed systems of stratification. It is important, then, to determine how much social mobility exists in the United States.
Here we need to distinguish between two types of individual vertical social mobility. Intergenerational mobility refers to mobility from one generation to the next within the same family. If children from poor parents end up in high-paying jobs, the children have experienced upward intergenerational mobility. Conversely, if children of doctors end up working as janitors, these children have experienced downward intergenerational mobility. Intragenerational mobility refers to mobility within a person’s own lifetime. If you start out as an administrative assistant in a large corporation and end up as an upper-level manager, you have experienced upward intragenerational mobility. But if you start out from business school as an upper-level manager and get laid off 10 years later because of corporate downsizing, you have experienced downward intragenerational mobility.
A third type of mobility, structural mobility, happens when societal changes enable a whole group of people to move up or down the social class ladder. Structural mobility is attributable to changes in society as a whole, not individual changes. In the first half of the twentieth century, industrialization expanded the U.S. economy, raising the standard of living and leading to upward structural mobility. In today’s work economy, the recent recession and the outsourcing of jobs overseas have contributed to high unemployment rates. Many people have experienced economic setbacks, creating a wave of downward structural mobility. (OpenStax, Sociology 2e, Attribution International (CC BY 4.0); download for free at http://cnx.org/contents/02040312-72c8-441e-a685-20e9333f3e1d@10.1).
Sociologists have conducted a good deal of research on social mobility, much of it involving the movement of males up or down the occupational prestige ladder compared to their fathers, with the earliest studies beginning in the 1960s (Blau & Duncan, 1967; Featherman & Hauser, 1978). For better or worse, the focus on males occurred because the initial research occurred when many women were still excluded from the formal labor force and also because women back then were ignored in many studies in the social and biological sciences. The early research on males found that about half of sons end up in higher-prestige jobs than their fathers had but that the difference between the sons’ jobs and their fathers’ was relatively small, meaning that social mobility is typically incremental. This is in spite of the fact that the stories we tell about social mobility present social mobility occurring in giant leaps, from rags to riches. In reality, a child of a janitor may end up managing a hardware store but is very unlikely to end up as a corporate executive. To reach that lofty position, it helps greatly to have parents in jobs much more prestigious than a janitor’s. Contemporary research also finds much less mobility among Black and Latinos than among non-Latino whites with the same education and family backgrounds, suggesting an important negative impact of racial and ethnic discrimination.

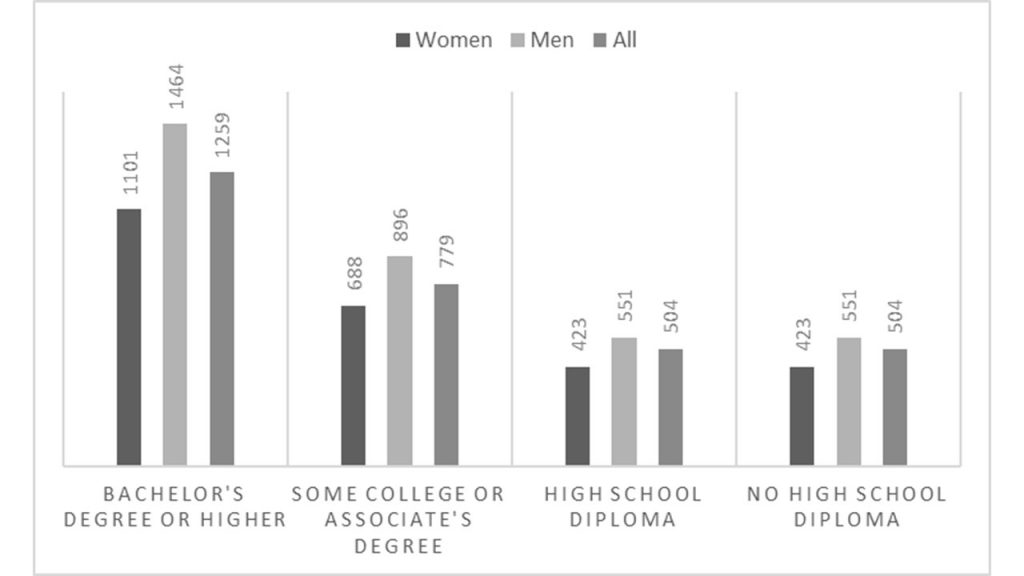
A key vehicle for upward mobility is formal education. Regardless of the socioeconomic status of our parents, we are much more likely to end up in a high-paying job if we attain a college degree or, increasingly, a graduate or professional degree. Figure 8.9 “Education and Median Weekly Earnings of All Workers, 25 Years and Older, 2016” vividly shows the difference that education makes for American’s incomes. Notice, however, that for every level of education, men’s incomes are greater than women’s, thus suggesting that the payoff of education is higher for men than for women, and many studies support this conclusion (Green & Ferber, 2008). The reasons for this gender difference are complex and will be discussed further in this text in the review of gender and gender inequality. To the extent vertical social mobility exists in the United States, then, it is higher for men than for women as well as being higher for whites than for people of color.
Figure 8.10 Education and Median Weekly Earnings of All Workers, 25 Years and Older, 2016
Certainly the United States has upward social mobility, even when we take into account gender and racial discrimination. Whether we conclude the United States has a lot of vertical mobility or just a little is the key question, and the answer to this question depends on how the data are interpreted. People can and do move up the socioeconomic ladder, but their movement is fairly limited. Hardly anyone starts at the bottom of the ladder and ends up at the top.
One way of understanding the issue of U.S. social mobility is to see how much parents’ education affects the education their children attain (education being strongly correlated with social class status). Research comparing first-generation students, whose parents did not attend college, with students whose parents have bachelor’s degrees shows differential outcomes based on parent educational level. In high school, students whose parent(s) have a bachelor’s degree are more likely to participate in an academically focused curriculum and are more likely to earn Advanced Placement or International Baccalaureate credits (Cataldi, Bennett and Chen, 2018). Participation in academically rigorous courses in high school helps to prepare students for success in college. Table 8.3 “Parents’ Education and their Children’s Educational Outcomes” demonstrates the compounding factors associated with parental educational attainment.
Table 8.3 Parents’ Education and their Children’s Educational Outcomes
| First Generation Students | Parent(s) Earned a Bachelor’s Degree | |
| % who participated in academically focused high school curriculum | 16% | 37% |
| % who earned AP/IB Credits | 18% | 44% |
| % who enrolled in college | 72% | 93% |
| % who, after 3 years of college, left college without earning a degree | 33% | 14% |
| % who graduated from college in 4 years | 45% | 67% |
Source: Cataldi, Emily Forrest, et al. “First-Generation Students: College Access, Persistence, and Postbachelor’s Outcomes.” National Center for Education Statistics (NCES) Home Page, a Part of the U.S. Department of Education, 8 Feb. 2018, nces.ed.gov/pubsearch/pubsinfo.asp?pubid=2018421.
Early educational experiences, financial struggles and less social support from parents who have limited to no experience navigating the college system, result in first generation students attending college and graduating with bachelor’s degrees at lower levels. As demonstrated above, almost 20% fewer first generation students enroll in college, they leave college without a degree at more than twice the rate of their peers and 22% fewer graduate within four years of their initial college enrollment. Thus, our chances of going to college and completing with a degree depends heavily on our parents’ education (and presumably their income and other aspects of our family backgrounds). While the American Dream does exist, it is much more likely to remain only a dream unless we come from advantaged backgrounds. In fact, there is less vertical mobility in the United States than in other Western democracies. As a recent analysis summarized the evidence, “There is considerably more mobility in most of the other developed economies of Europe and Scandinavia than in the United States” (Mishel, Bernstein, & Shierholz, 2009, p. 108).
8.4 Economic Inequality and Poverty in the U.S.
In his classic book The Other America, Michael Harrington (1962) brought the reality of poverty home to many Americans. In chapter after chapter, he discussed the troubled lives of the poor in rural Appalachia, in our urban centers, and in other areas of the country, and he indicted the country for not helping the poor. His book helped kindle interest in the White House and Congress in aiding the poor and deeply affected its thousands of readers. Almost five decades later, we know much more about poverty than we used to. Despite initial gains in fighting poverty in the 1960s (Schwartz, 1984), poverty is still with us and has worsened since the early 2000s, especially since the onset of the serious economic recession that began in 2008. What do we know about the extent of poverty, the reasons for it, and its consequences?
Economic Inequality
Let’s start by discussing economic inequality, which refers to the extent of the economic difference between the rich and the poor. Because most societies are stratified, there will always be some people who are richer or poorer than others, but the key question is how much richer or poorer they are. When the gap between them is large, we say that much economic inequality exists; when the gap between them is small, we say that relatively little economic inequality exists.
Considered in this light, the United States has a very large degree of economic inequality, which is becoming concentrated at the top. A common way to examine inequality is to rank the nation’s families by income from lowest to highest and then to divide this distribution into fifths (or quintiles). Thus, we have the poorest fifth of the nation’s families (or the 20% of families with the lowest family incomes), a second fifth with somewhat higher incomes, and so on until we reach the richest fifth of families, or the 20% with the highest incomes. We then can see what percentage each fifth has of the nation’s entire income. Additionally, we can track this data over time in order to determine the degree to which income distribution changes and whether or not income share is concentrating in any one group. Figure 8.10 “Share of National Aggregate Income Going to Income Fifths, 1970 – 2016” shows this data for the United States. In 2016, the poorest fifth enjoyed only 3.1% of the nation’s income, while the richest fifth enjoyed 51.5% (United States Census Bureau). Another way of saying this is that the richest 20% of the population have more income as the remaining 80% of the population. Additionally, comparing data from 1970 to the present, we can see that for the bottom 80%, their share of income has been declining over the past 5 decades, while the only group seeing an increase share of income is the top 20%.
Figure 8.11 Share of National Aggregate Income Going to Income Fifths, 1970 – 2016
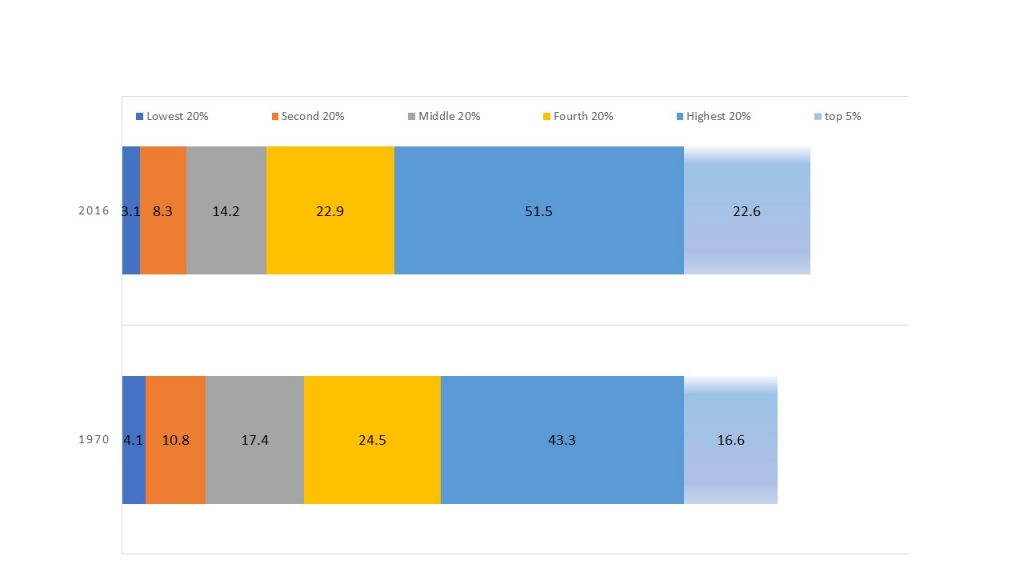
Source: Data from US Census Bureau. “Historical Income Tables: Households.” www.census.gov/data/tables/time-series/demo/income-poverty/historical-income-households.html.
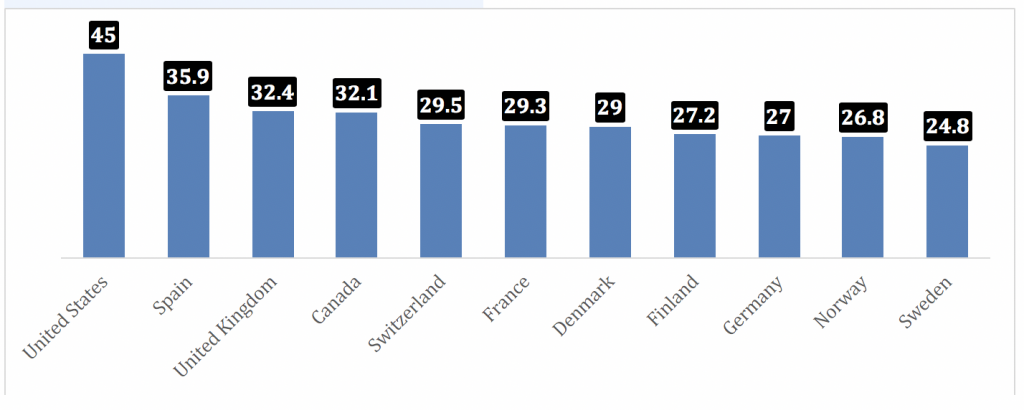
This degree of income inequality is the largest in the industrialized world. Below, Figure 8.12 “Distribution of Family Income, GINI Index” compares the inequality among several industrialized nations by examining their GINI Index. This index measures the degree of inequality in the distribution of family income, where the closer the score is to 0, the more equal the society, and the closer the score is to 100, the more unequal the society. The index number for the United States, 45.0, which far exceeds comparable nations, whose scores range from 26.8 to 35.9.
Figure 8.12 Distribution of Family Income, GINI Index
As demonstrated, income inequality in the United States is greater than in comparable nations and has increased during the last several decades. The loss of manufacturing jobs and changes in taxation and income distribution policies since the early 1980s have favored the rich and hurt the economic standing of the middle, working and lower classes (Barlett & Steele, 2002; Wilson, 2009). As the saying goes, the rich get richer. To recall our earlier discussion, to be upwardly mobile, it helps to be well-off to begin with.
Defining and Measuring Poverty
There are multiple ways to talk about poverty. One type of poverty is absolute poverty. Absolute poverty is when someone does not have enough money to maintain the bare minimums for food, shelter, and clothing. Another way of defining poverty is relative poverty. As the name implies, relative poverty is poverty in relation to others.
Every country has the ability to define poverty for itself. When U.S. officials became concerned about poverty during the 1960s, they quickly realized they needed to find out how much poverty we had. To do so, a measure of official poverty, or a poverty line, was needed. This line was first calculated in 1963 by multiplying the cost of a very minimal diet by three, as a 1955 government study had determined that the typical American family spent one-third of its income on food. Thus, a family whose income is lower than three times the cost of a very minimal diet is considered officially poor.
This way of calculating the poverty line has not changed since 1963, even though many other things, such as energy, transportation, housing, child care, and health care, now occupy a greater percentage of the typical family’s budget than was true in 1963. As a national measure, the poverty line also fails to consider regional differences in the cost of living. As a recent report observed, “Most poverty analysts strongly believe that the official poverty statistics are inadequate to the task of determining who is poor in America” (Mishel, Bernstein, & Shierholz, 2009, p. 298).
Table 8.5 2018 Poverty Thresholds (for the 48 Contiguous States and the District of Columbia)
|
Family Size |
Poverty Guideline |
|
1 |
$12,140 |
|
2 |
$16,460 |
|
3 |
$20,780 |
|
4 |
$25,100 |
|
5 |
$29,420 |
|
6 |
$33,740 |
|
7 |
$38,060 |
|
8 |
$42,380 |
Source: Data from “Poverty Guidelines.” ASPE, 12 Jan. 2018, aspe.hhs.gov/poverty-guidelines. Retrieved from https://aspe.hhs.gov/poverty-guidelines
The poverty line is adjusted annually for inflation and takes into account the number of people in a family: the larger the family size, the higher the poverty line, as indicated in Table 7.5 “2018 Poverty Thresholds (for the 48 Contiguous States and the District of Columbia).” In 2018, the poverty line for a family of four is $25,100. A four-person family earning even one more dollar than $25,100 in 2018 is not officially poor, even though its “extra” income hardly lifted it out of dire economic straits.
Policy experts have calculated a no-frills budget that enables a family to meet its basic needs in food, clothing, shelter, and so forth; this budget is about twice the poverty line. Families with incomes between the poverty line and twice the poverty line are barely making ends meet, but they are not considered officially poor. When we talk here about the poverty level, keep in mind that we are talking only about official poverty and that there are many families and individuals living in near-poverty who have trouble meeting their basic needs, especially when they face unusually high medical, motor vehicle expenses or the like. For this reason, some analyses use “twice-poverty” or “low income” data (i.e., defined as family incomes below double the poverty line) to provide a more accurate understanding of how many Americans face financial difficulties.
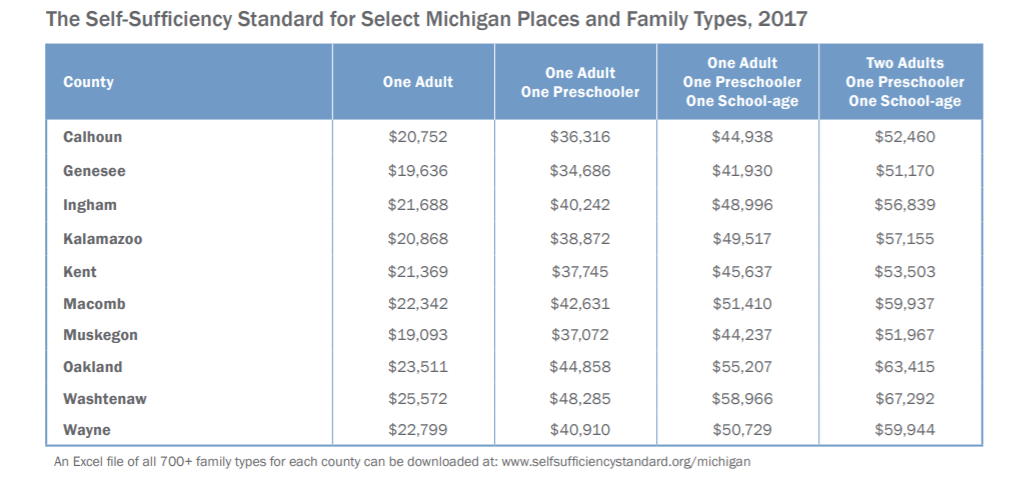
The Center for Women’s Welfare is pushing for a new measure, the self-sufficiency standard. They are proposing this measure as an alternative to the official poverty measure. It is a budget-based measure that “determines the amount of income required for working families to meet basic needs at a minimally adequate level, taking into account family composition, ages of children, and geographic differences in costs.” (Center for Women’s Welfare, University of Washington). Figure 8.13 shows an example of the self sufficiency standard applied to various counties and family types in Michigan.
Figure 8.13
The Extent and Social Distribution of Poverty
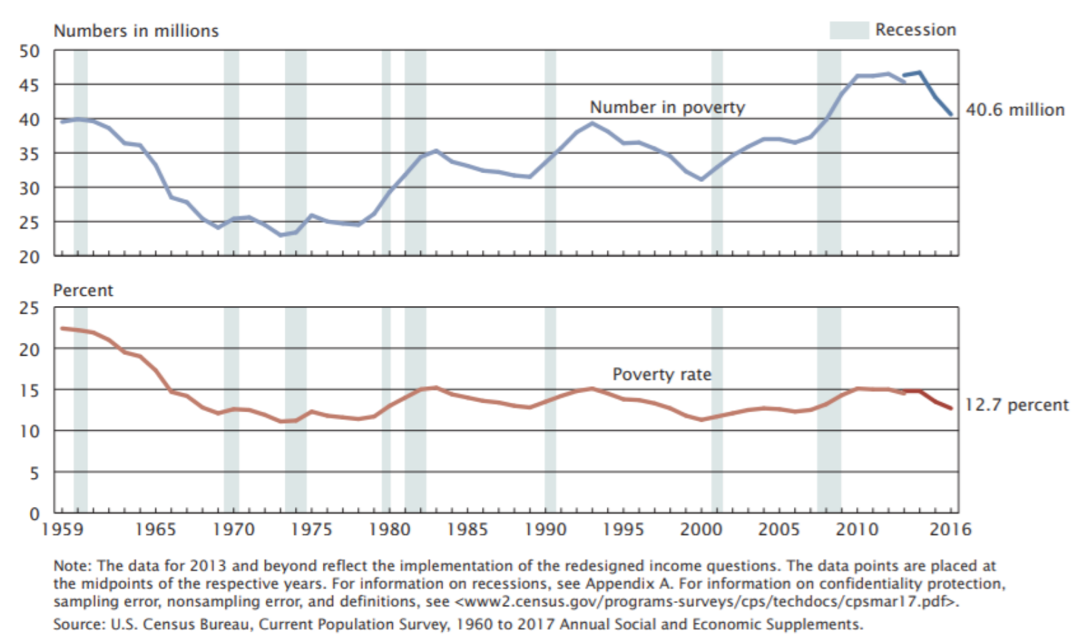
With this caveat in mind, how many Americans are poor, and who are they? The U.S. Census Bureau gives us some answers. In 2016, 12.7% of the U.S. population, or almost 40.6 million Americans, officially lived in poverty (Semega, Fontenot & Kollar, 2016). This percentage represented a decline from the peak of the economic recession beginning in 2007-2008 (see Figure 8.14 “Number in Poverty and Poverty Rate, 1959 – 2016), however, examining the chart below demonstrates that the percentage of people in poverty, while fluctuating a few percentage points, has remained fairly stable since the late-1970s. At the same time, the U.S. population has grown, resulting in a greater number of people in poverty (note below that around 1970, there were roughly 25 million people in poverty compared to 40.6 million today).
Figure 8.14 Number in Poverty and Poverty Rate, 1959 – 2016
Poverty estimates are determined by way of a series of surveys of approximately 100,000 addresses per year, conducted in February, March and April. Because of this technique, episodic poverty may be undercounted. Episodic poverty is defined by the Census Bureau as being poor for at least 2 consecutive months in some time period. For instance, from 2004 to 2007 the official poverty rate hovered around 13%, however in reality, almost one-third of the U.S. public, equal to about 95 million people, were poor for at least 2 consecutive months (DeNavas-Walt, Proctor, & Smith, 2010). As these figures indicate, people go into and out of poverty, but even those who go out of it do not usually move very far from it.
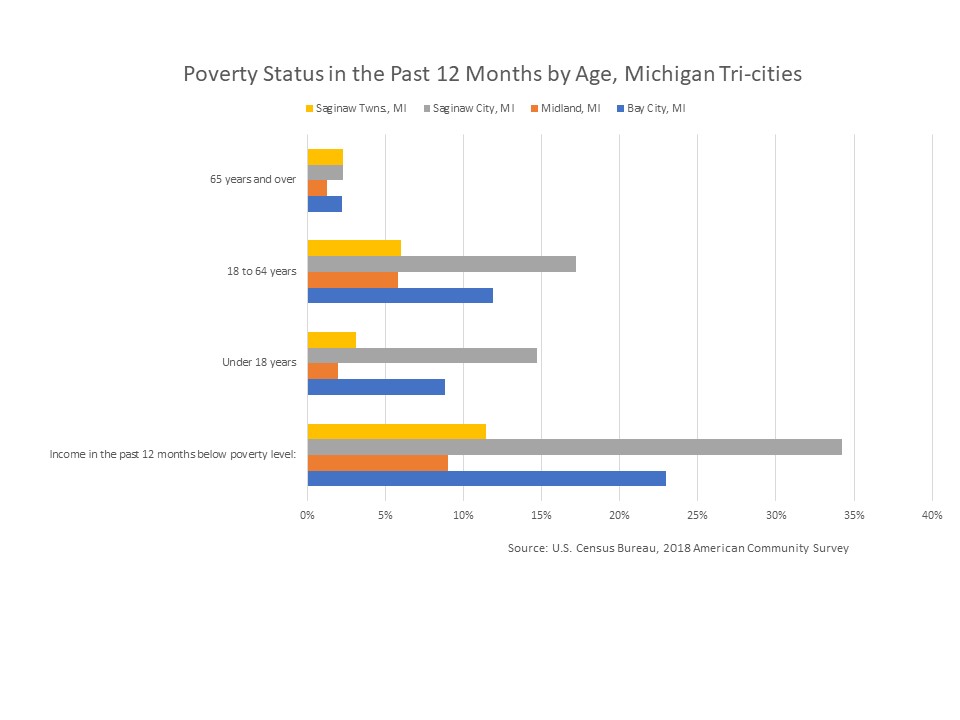
Figure 8.15 Poverty Status by Age, Michigan Tri-Cities
Poverty by Race and Ethnicity
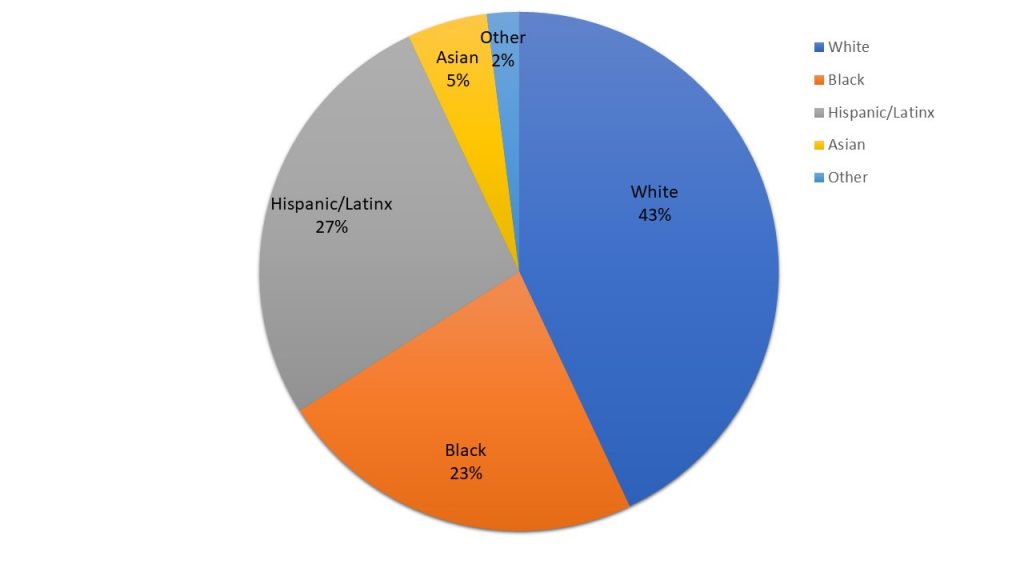
Who are the poor? As shown in Figure 8.16 “Racial and Ethnic Composition of the Poor, 2016” the most typical poor person in the United States is white: in 2016 approximately 42.5% of poor people were white (non-Latino), 27.4% were Latino, 22.7% were Black, and 4.7% were Asian American (Semega, Fontenot & Kollar, 2016).
Figure 8.16 “Racial and Ethnic Composition of the Poor, 2016”
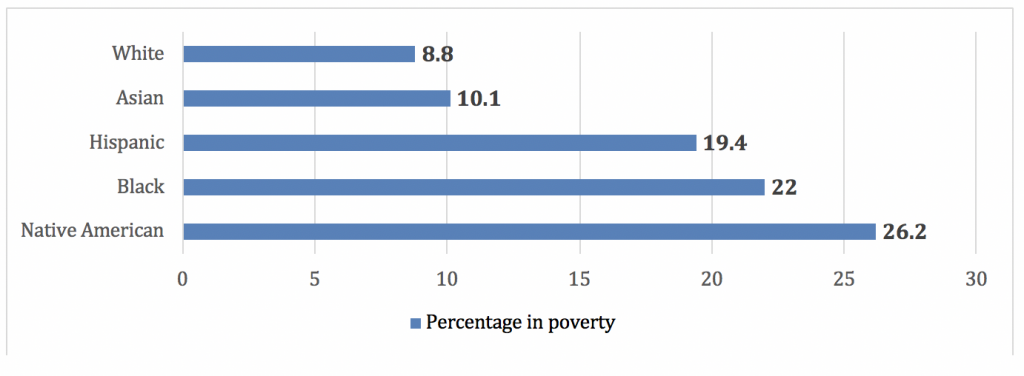
While, in terms of sheer numbers, there are more poor white Americans than other racial-ethnic groups, it’s important to examine the proportion of impoverished people in each of these groups. Race and ethnicity affects the chances of being poor, as shown below in Figure 8.17 “Race, Ethnicity, and Poverty, 2016 (Percentage of Each Group That Is Poor). This chart shows us that in 2016, 8.8% of non-Latino whites were poor, while 26.2% of Native Americans, 22% of Black people, 10.1% of Asian Americans, and 19.4% of Latinos (who may be of any race) fell into this category. Thus, all racial-ethnic minorities in the U.S. are disproportionately poor, in comparison to the dominant white racial group. Native Americans are roughly three times as likely as non-Latino whites to be poor, while the rates of poverty of Black and Latinos are more than double the non-Latino white rate.
Figure 8.17 “Race, Ethnicity, and Poverty, 2016 (Percentage of Each Group That Is Poor)
Poverty by Age
Turning to age, 21% of children under age 18 are poor (amounting to more than 15 million children). According to the National Center for Children in Poverty, the poverty threshold dramatically underestimates the needs of families and, “on average, families need an income of about twice that level to cover basic expenses. Using this standard, 43% of children live in low-income families” (Koball & Jiang, 2018). While this data is dire, the good news is that there has been a slight decline of child poverty as the U.S. has recovered from the economic recession of the late 2000’s. In Table 8.6 “Number of Children in Poverty in the U.S., 2010 – 2016,” we can see a decrease in child poverty in every category.
Table 8.6 Number of Children in Poverty in the U.S., 2010 – 2016
|
|
2010 |
2016 |
|
Low Income |
33,216,701 |
29,842,412 |
|
Poor |
16,810,053 |
14,047,290 |
|
Deep Poverty |
8,139,897 |
6,193,661 |
Source: Data from Koball, H., & Jiang, Y. (2018). Basic Facts about Low-Income Children: Children under 18 Years, 2016. New York: National Center for Children in Poverty, Columbia University Mailman School of Public Health. Retrieved from http://www.nccp.org/publications/pub_1194.html
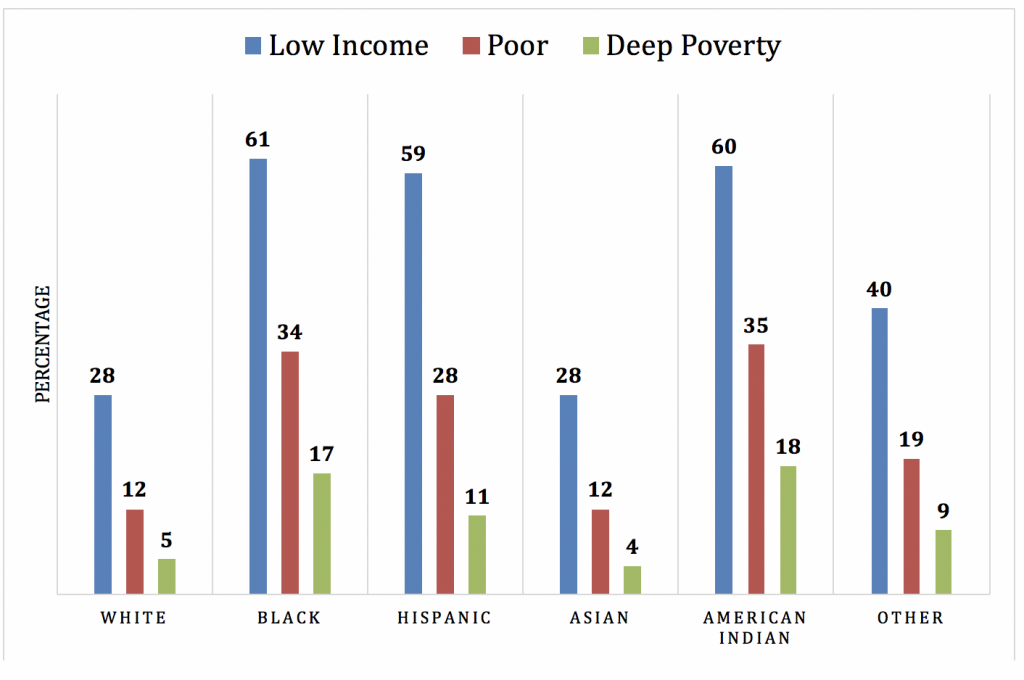
In the table above, data for low income children includes children living in households that are up to double the poverty threshold, while those in deep poverty are in households that are 50% of the poverty threshold or less (for instance if the poverty threshold in 2018 for a family of 4 is $25,100, this same family would be in “deep poverty” if their income was half this amount, or $12,550 or less). The data show that the percentage of low income children has declined by 4 percent, from 45% in 2010 to 41% in 2016. Similarly, while the number of children in poverty is still significant, it has dropped from roughly 23% to 21% in this same timeframe (Koball & Jiang).
The rate of child poverty is the highest of any age group in the U.S. In comparison, the rate of poverty for adults aged 19 – 64 in 2016 was 13% and the rate for those over the age of 65 was 9%, or less than half of the child poverty rate (Koball & Jiang). Additionally, there are significant differences in child poverty rates when comparing diverse racial-ethnic groups in the U.S. Figure 8.18 “U.S. Child Poverty Rates by Race and Ethnicity, 2016” shows that the rates of poverty for Native American and Black children, at 35% and 34%, respectively, are roughly triple that of white children, whose poverty rate is 12%. Similarly, poverty among Hispanic children in the U.S., at 28%, is more than double the white child poverty rate.
Figure 8.18 U.S. Child Poverty Rates by Race and Ethnicity, 2016
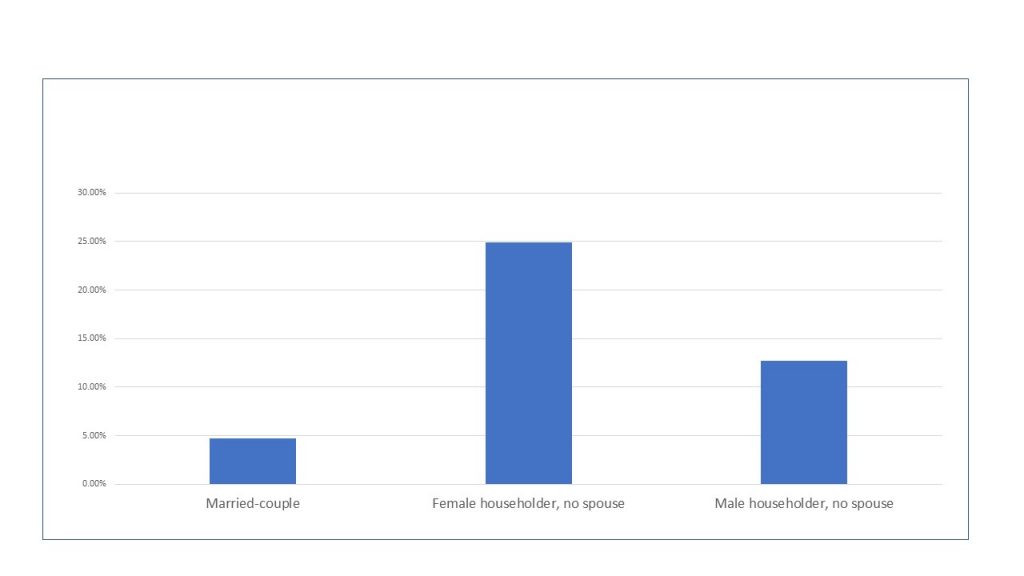
The type of family structure also makes a difference, as does the educational and employment status of parents. Children who live with two parents are far less likely to live in poverty, compared to those children who live with one parent or in households where neither parent is present. Figure 8.19 shows the poverty rate by household type, 4.7% of households headed by married couples are in poverty, 24.9% of female headed households are in poverty and 12.7% of male headed households are in poverty. As this data indicates, families headed by single women are much more likely to be poor, thus, poverty has a female face (referred to as the feminization of poverty).
Figure 8.19 Poverty Rate by Household Type
Comparing the U.S. rate of child poverty to other countries, we find that the poverty rate for U.S. children is the highest in the Western world and 1.5 to 9 times greater than the corresponding rates in Canada and Western Europe (Mishel, Bernstein, & Shierholz, 2009).
Why is there so much more poverty in the United States than in its Western counterparts? Several differences between the United States and the other nations stand out. First, other Western nations have higher minimum wages and stronger unions than the United States has, and these lead to incomes that help push people above poverty. Second, the other nations spend a much greater proportion of their gross domestic product on social expenditures (income support and social services such as child care subsidies and housing allowances) than does the United States. As a recent analysis concluded, “Other peer countries are much more likely than the United States to step in where markets have failed to lift their most disadvantaged citizens out of poverty. This suggests that the relatively low expenditures on social welfare are at least partially implicated in the high poverty rates in the United States” (Mishel, Bernstein, & Shierholz, 2009, p. 387). In short, the United States has so much more poverty than other democracies in part because it spends so much less than they do on helping the poor.
Explanations for Poverty
According to the individual explanation, the poor have personal problems and deficiencies that are responsible for their poverty. In the past, the poor were thought to be biologically inferior, a view that has not entirely faded, but today the much more common belief is that they lack the ambition and motivation to work hard and to achieve. According to the World Values Survey, 60% of Americans believe that people are poor “because they are lazy and lack will power.” This percentage reflects the tendency of Americans to favor individual explanations of poverty (Davidson, 2009).
According to the second, structural explanation, U.S. poverty stems from problems in American society that lead to lack of equal opportunity. These problems include (a) racial, ethnic, gender, and age discrimination; (b) lack of good schooling and adequate health care; and (c) structural changes in the American economic system, such as the departure of manufacturing companies from American cities in the 1980s and 1990s (Iceland, 2003). These problems help create a vicious cycle of poverty in which children of the poor are often fated to end up in poverty or near-poverty themselves as adults. Thus, poverty is rooted in social and economic problems of the larger society rather than in the lack of willpower, laziness, or other moral failings of poor individuals themselves. Individuals born into poverty suffer from a lack of opportunity from their first months up through adulthood, and poverty becomes a self-perpetuating, vicious cycle.
Most sociologists favor the structural explanation, believing that poverty greatly blocks opportunities for success. Later chapters document racial and ethnic discrimination, lack of adequate schooling and health care, and other problems that make it difficult to rise out of poverty. On the other hand, some ethnographic research supports the individual explanation by showing that the poor do have certain values and follow certain practices that augment their plight (Small, Harding & Lamont, 2010). For example, the poor have higher rates of cigarette smoking (34% of people with annual incomes between $6,000 and $11,999 smoke, compared to only 13% of those with incomes $90,000 or greater (Goskowski, 2008)), which helps lead them to have more serious health problems. Adopting an integrated perspective, some researchers say these values and practices are in many ways the result of poverty itself (Small, Harding & Lamont, 2010). These scholars concede self-destructive behaviors exist, but they also say they exist because they help the poor cope daily with the structural effects of being poor, thus poverty becomes self-perpetuating. If poverty is both cultural and structural in origin, these scholars say, a comprehensive national effort must be launched to improve the lives of the people in the “other America.”
In order to achieve this goal, the perspective on poverty held by the majority must change. As sociologist Theresa C. Davidson (2009) observes, “beliefs about the causes of poverty shape attitudes toward the poor.” Research strongly suggests that public support for government aid for the poor is weak because so much of the public attributes poverty to failings among the poor themselves. If so, the public might very well begin to endorse greater government aid if its attribution for poverty became more structural instead of individual. Public education campaigns that call attention to the lack of opportunity and other structural problems that account for poverty thus might further poverty policy by beginning to change public perceptions of the poor.
The Effects of Poverty
However poverty is explained, it has important enduring effects, which later chapters will continue to discuss. For now, we can list some of the major consequences of poverty (and near-poverty) in the United States. As we do so, recall the sociological perspective’s emphasis on how our social backgrounds influence our attitudes, behaviors and life changes. This influence on life chances is quite evident when we look at some of the effects of poverty (Moore, Redd, Burkhauser, Mbawa & Collins, 2009; Iceland, 2006; D. Lindsey, 2009):
The poor are at greater risk for family problems, including divorce and domestic violence. The stress of being poor is thought to be a major reason for these problems.
The poor are also at greater risk for health problems, including infant mortality, earlier mortality during adulthood, mental illness and inadequate medical care. Many poor people lack health insurance. Poor children are more likely to have inadequate nutrition and to suffer health, behavioral and cognitive problems, and be exposed to environmental contaminants. These problems in turn impair their ability to do well in school and land stable employment as adults, helping to ensure that poverty will persist across generations.
Poor children typically go to underfunded schools with inadequate facilities where they receive inadequate schooling. They are much less likely than non-poor children to graduate from high school or to go to college. Their lack of education in turn restricts them and their own children to poverty, once again helping to ensure a vicious cycle of continuing poverty across generations.
The poor are, not surprisingly, more likely to be homeless than the non-poor but also more likely to live in dilapidated housing and unable to buy their own homes. Many poor families spend more than half their income on rent. The lack of adequate housing for the poor remains a major national problem that is only worsening.
8.5 End-of-Chapter Material
- Almost all societies are stratified according to wealth, power, prestige, and other resources the societies value. Societies are often categorized into systems of stratification according to the degrees of inequality and vertical social mobility that characterize them.
- Systems of stratification include slave societies, caste societies, and class societies, with class societies the most open in terms of vertical social mobility. Classless societies exist in theory, according to Karl Marx and other thinkers, but have never been achieved in reality. Certain social democracies in Western Europe have succeeded in limiting their degree of inequality while preserving political freedom.
- The two major explanations of stratification are the functionalist and conflict views. Functionalist theory says that stratification is necessary and inevitable because of the need to induce people with the needed knowledge and skills to decide to pursue the careers that are most important to society. Conflict theory says stratification exists because of discrimination against, and blocked opportunities for, the have-nots of society. A set of ideological beliefs supports the existence and perpetuation of systems of stratification and domination. In the United States, these beliefs include the ideas surrounding the American Dream ethos that even poor people can succeed by working hard and pulling themselves up by their bootstraps.
- Social class in the United States is usually measured in terms of socioeconomic status, but some conflict theory scholars prefer measures more related to Marx’s concept of the ownership of the means of production. Many typologies of the American class structure exist, but four commonly delineated classes include the upper class, middle class, working class, and lower class or the poor. Within the upper class and middle class are subclasses distinguished by their incomes and lifestyles.
- Many studies examine the degree of vertical social mobility in the United States. Some vertical mobility does exist, but overall, it’s fairly small. Your family’s socioeconomic status (SES) greatly affects your own chances for success in life; people on the bottom of society usually can move up only a little bit, if at all.
- The United States has the highest degree of economic inequality in the industrial world, and its degree of inequality has increased in the last two decades. Although our poverty rate declined in the late 1990s, it was as high as in the middle 1960s, before the war on poverty began reducing the poverty rate.
- Poverty rates are strongly related to factors such as race and ethnicity, age, and gender. Although most poor people are white, people of color have higher poverty rates than whites. About 40% of all poor people are children under the age of 18. Single-parent households headed by women have especially high poverty rates.
- In explaining poverty, observers attribute it either to personal deficiencies of the poor themselves or instead to structural problems in American society such as racial discrimination and rundown schools that block the ability and opportunity of the poor to improve their lot. Poverty has dire effects for the poor in many areas of life, including illness and health care, schooling, and housing.
