8
The simplest source of energy to use is household AC current from the power grid. It’s highly reliable and available on demand. Off-grid systems will require considerable effort and engineering to meet similar reliability goals. We use grid power without thinking about the quantities required, or how they compare between situations. An average of 20 kWh/day is enough energy to meet all the energy needs of a small condo. When planning your energy use you need to know which loads will be your major consumers. An important option to consider is the idea of a net zero home that is tied to the electrical grid, but generates power that it can feed in for a net power draw of zero or less, averaged over the year. For the latest recommendations in a Canadian context google “nrcan net zero”.
Useful Approximate Orders of Magnitude
This table is extracted from some of the many you can find searching online, as well as actual product data. The most important lessons from this table are that heating loads can be orders of magnitude larger than everything else. Just about everything you would normally think of possibly running on a small battery will be incidental. Smaller loads that are always on (like a fridge or network equipment) may consume more energy each day than larger loads that run briefly (like a microwave).
| Load or Source | Nominal Voltage [Volts] | Current [Amps] | Power [Watts] | Energy [Watt Hours] |
| Coin Cell | 1.5 | < 0.01 | 0.015 | 0.3 |
| 2 AA Batteries | 3 | < 0.1 | 0.30 | 6.6 |
| Phone | 3.7 | 12 hours life | 0.83 | 10 |
| Phone Charger | 5 | 1 | 5.0 | 120/day |
| LED Desk Lamp | 12 | 0.5 | 6.0 | 144/day |
| Group 27 Battery | 12 | < 5 | 60 | 1200 |
| Fridge or Freezer (cycles compressor on/off) | AC | 40 average | 1000/day | |
| Incandescent Desk Lamp | AC | 100 | ||
| Computer, TV | AC | 100 | ||
| Max Outlet, stove element, kettle, oven, hair dryer, microwave | AC | 1000 – 1500 | ||
| Clothes Dryer, Water Heater | AC | 4500 | ||
| Mini Split Heat Pump | AC | 1000 – 4500 | ||
| Tankless Hot Water Heater | AC | 30000 |
Note that here’s a whole lot of household loads that are around 1500 W, the maximum you want to plug in to a normal household electrical outlet on a standard 15 amp circuit.
Estimating Household Electrical Loads
I took a quick tour through Home Depot, looking at the Energuide labels on some run of the mill appliances, and I would expect you to do as well or better on the energy efficiency of your appliance choices:
- Refrigerators ranged from 327 to 401 kWh / year, so find one that uses less than 1 kWh / day. Freezers were in the same ballpark.
- Dishwashers were around 270 kWh / year.
- Clothes washers ranged from 175 to 428 kWh / year, depending on whether they heated their own water.
- Clothes driers were around 650 kWh / year, and most of that energy goes out the vent.
- Kitchen stoves with ovens were around 600 kWh / year, but at least that heat stays indoors.
Energuide ratings represent average use conditions, and take into account that most of these devices don’t run 24/7/365. Even refrigerators are only running the compressor and consuming significant energy part of the time.
When making your operating plans, keep in mind that some loads are discretionary. You can save the laundry for a sunny day when you have excess solar energy.
Estimating Hot Water Energy Requirements
Incoming Kingston city water temperature was measured on 2019-03-04 at a kitchen tap at less than 3C. It can be considerably warmer in the summer, depending on supply system details. Each litre of water weighs 1 kilogram and requires approximately 4000 J to raise its temperature by 1C. If you shower for 8 minutes at 8 litres per minute with 40C water you will use about 9.5 MJ of energy to warm the water from 3C. (40-3)*8*8*4000 = 9472000 J. 9.5 MJ is about 2.6 kWh, most of which will go back down the drain instead of warming the house.
The standby loss from a storage tank water heater will be somewhere around 2 to 3 kWh / day depending on the model, the thermostat setting, and the air temperature, but keep in mind that energy stays in the house, warming the air around the tank, which is useful in the winter. Standby loss is a factor 24/7, however the consumption of hot water can be discretionary to help balance the energy budget.
Don’t be mislead by LED bulb ratings!
The packaging probably says something about being a 60W replacement in big letters, indicating that this LED bulb will give off as much light as a typical incandescent bulb consuming 60W. In smaller letters it will tell you it is actually a 9.5W LED. If LED lighting is a large fraction of your electrical power consumption, you have probably used the wrong values.
Parasitic Power
Many devices consume power even when they are idle, including anything with a remote control, because it will take some power just to listen for that signal from the remote. That power can be very small in modern devices, or a significant factor in total household consumption for older devices. I did some tests with my various devices:
- All my battery powered Apple devices stopped drawing measurable amounts of AC current when fully charged or idle.
- My phone used 10W or less, only while charging.
- My iPad used 20W or less only while charging.
- My MacBook Air used less than 70W only while charging.
- My 27 inch iMac used about 80 W while in use, dropping to < 5W when asleep or shut down.
- My cable modem and WiFi router consume about 30W, 24/7, almost as much as a fridge.
- My entertainment stack used only about 3W with everything turned off, about 50W with the receiver on, and another 150W with the 65 inch TV playing Netflix. (The volume level doesn’t make much difference.)
Choose your devices and appliances carefully to minimize parasitic energy consumption.
Carbon Intensity
The implied motivation for going off-grid is to reduce Carbon Intensity (CI) along with other green house gas (GHG) emissions. Addressing that question requires that we consider not just how much energy we use, but the source of that energy and how that original source material was produced. Burning oil has higher emissions than getting the same energy from burning natural gas. Producing crude oil from oil sands has higher emissions than producing crude oil from conventional reservoirs.
There are lots of different methodologies for deriving Carbon Intensity, however the units are usually the amount of carbon emitted per unit of energy produced. It is often expressed in grams or kilograms of CO2 equivalent, recognizing that other emissions of e.g. methane are also greenhouse gases.
\begin{align}
1 \units{g CO_2eq / MJ} &=
1 \units{kg CO_2eq / GJ}\\
&= 3.6 \units{kg CO_2eq / MWh}\\
&\approx 6.1 \units{kg CO_2eq / bbl}
\end{align}
bbl is a common abbreviation for barrel in the oil industry. Wikipedia: “The U.S. Internal Revenue Service defines a BOE [Barrel of Oil Equivalent] as equal to … about 6.1 GJ (HHV), or 1.7 MWh.) The value is necessarily approximate as various grades of oil and gas have slightly different heating values.” (Note that this is simply units conversion and that actually burning a barrel of oil releases about 450 kgCO2eq in addition to the emissions resulting from production of that barrel of oil.)
Oil
The global picture on oil production is quite complex. “The global volume-weighted-average upstream CI estimate is 10.3 g CO2equivalents (CO2eq.)/megajoule (MJ) crude oil, with country-level intensities ranging from 3.3 (Denmark) to 20.3 (Algeria) g CO2eq./MJ. Carbon dioxide and methane contribute on average 65% and 34% of total CO2eq. emissions, respectively.” Heavy oil production is generally above the average CI and significant portions of it are in the range of 30 to 40 g CO2eq/MJ.
Once that crude oil is produced, burning it creates additional carbon intensity. A typical value for crude oil is 73.3 g CO2 / MJ, about 7 times more than than the carbon intensity of production. Thus the total intensity for the combination of producing and then burning crude oil ranges from about 77 to 94 g CO2eq/MJ by country of production, with the world average around 84. That number rises to about 108 for high emission heavy oils, about 29% higher than the average.
An additional CI must be included for refining the crude into fuel, and for transportation from production facilities to the user. Determining an overall Oil CI (OCI) is even more complex. A rough overall value of 3 kg CO2eq / litre for consumption of gasoline would be a reasonable figure for order of magnitude estimates.
Propane and Natural Gas
Burning propane releases about 63.1 g CO2 / MJ, and natural gas about 56.1 g CO2 / MJ. The CI associated with production is low, and difficult to account for, as petroleum gases are often produced alongside oil in conventional production. As with oil, an additional CI must be included for transportation from production facilities to the user.
Electricity
Producing electricity releases GHG. Although there are no additional emissions when the electricity is consumed, the CI must be increased to account for the distribution losses. 1 kWh of electricity in your tiny house might be 1.05 kWh produced, less 0.05 kWh of energy lost in transmission lines, etc.
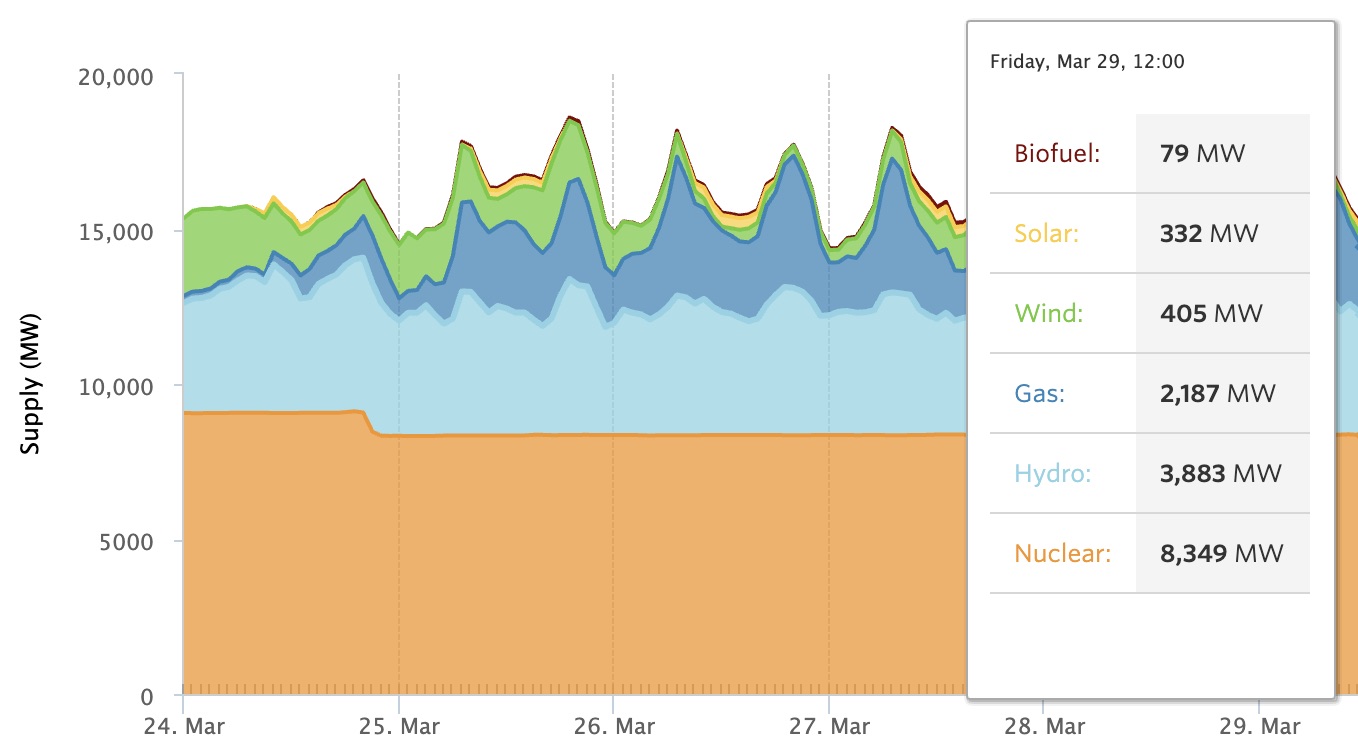
On average Canada wide, electrical generation had an intensity of about 42 g CO2eq/MJ in 2013 (about 150 g/kWh). Ontario has a considerably lower intensity due to nuclear and hydro, and has reduced that intensity further by closing coal capacity, adding renewables and load management. The actual CI varies from day to day based on supply and demand characteristics, however it wouldn’t be unreasonable to use 20 g CO2eq/MJ when making estimates for grid sourced electricity in Ontario.
Solar PV generation is low intensity in operation, however the CI of producing and installing panels and ancillary equipment needs to be accounted for over the life of the project.
Meat and Dairy
For comparison the UN FAO gives figures for beef and milk production. Milk ranges from about 1.7 to 3.7 kg CO2eq / kg FPCM (kg Fat and Protein Corrected Milk, about a litre), dependent on local climate and farming practices. Beef ranges from about 28 to 51 kg CO2eq / kg CW (kg Carcass Weight from which there will be waste trimming it down to a steak or a burger.) The UN FAO figures for pork and chicken are lower at about 5 to 7 kg CO2eq / kg CW for both, with slightly lower intensities by weight for eggs. The ratios are a little different if you assess by emissions per kg protein from the different sources.
A study of eliminating animals from US agriculture suggests total dietary CI could be reduced by about 28%, with some accompanying complications around nutritional completeness.
Eating locally is much less important than what you eat, as long as you aren’t flying in your asparagus, green beans and berries. The EWG Meat Eaters Guide provides different estimates that support similar conclusions.
Data
There are wildly variable estimates available on the web for the energy intensity and thus carbon intensity of data transmission. Aslan et al. (2017) estimate 0.06 kWh/GB for 2015 and determined “that the electricity intensity of data transmission (core and fixed-line access networks) has decreased by half approximately every 2 years.” Koomey, one of the coauthors of this study, had previously provided estimates of 0.68 kWh/GB for 2006 and 6.5 to 7.3 kWh/GB for 2000. Although extrapolation is dangerous, it would suggest 0.015 kWh/GB or 0.054 MJ/GB as estimates for 2019.
The divergent conclusions drawn in commentary on the web probably arise from erroneously multiplying current usage volumes by past energy intensities. For example, a 3 GB hour of HD video (2019) at 7 kWh/GB (2000) would require about 21 kWh for data transmission, while the same video could be transmitted using as little as 0.045 kWh in 2019.
WiFi or cellular data transmission in the last mile will add energy consumption to the chain that is difficult to estimate, but could be on the same order of magnitude as the receiving device power consumption while using the data. Overall, that suggests carbon intensities of several grams CO2eq / GB, which would be a few kgCO2eq/month for a moderate 2019 Canadian streaming user.
What do I get for a kilo of carbon?
1 kg CO2eq will be the footprint for about 0.33 litres of gas in your tank, 25 grams of beef, 150 grams of chicken, 200 grams of asparagus flown in from Peru, 10 kWh of grid electrical power, or 200 GB of data (2019). Avoid air travel to keep your footprint down.
Media Attributions
- Mar29 ON Elec
