11
Solar Heat Gain
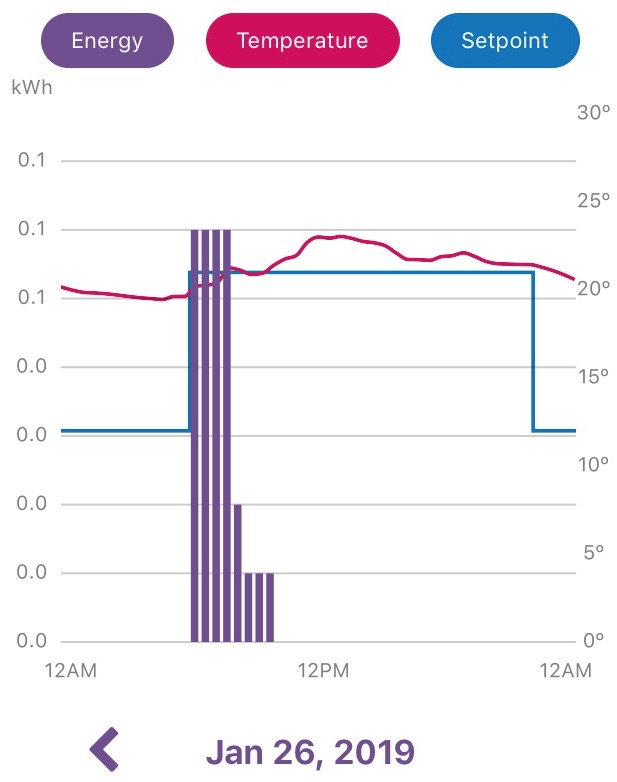
Windows can bring in significant energy when the sun shines through them. That energy warms the surfaces the light falls upon and eventually, by convection, warms the whole living space. (Convection is the transfer of heat energy by motion of a fluid like air.) We can see these effects from a sample for the living room in my condo. The figure is for a Saturday, so the programmable thermostat kept the heat off all night, then turned it on all day, moving the setpoint from 12.5 up to 21C. The heaters came on in the early morning before sunrise, and by mid-morning the sun shining in the south facing windows took over, raising the temperature to a peak in the early afternoon, well beyond the 21C setpoint. Although I’m not sure the application is accurate for quantity, the energy histogram shows that the heat was only on from about 6:30 to 10:00.
Non-Equilibrium Models
If the solar heat gain is enough to increase the temperature in the living space there must be more total energy coming in $(q_i)$ than is going out $(q_o)$ and we are no longer in equilibrium with our surroundings. In concept this can be expressed simply:
\begin{equation}
m C_p\frac{dT_i}{dt} = q_i – q_o
\end{equation}
where the mass $m$ and specific heat $C_p$ include everything in the living space: air, furniture, construction materials, etc. The derivative is the rate of change of the indoor temperature, which will go up slowly for a large thermal mass $mC_p$ or more quickly if the living space is empty except for the air.
In practice the system is much more complicated because different parts of the living space will have different temperatures, different specific heats, and will warm and cool at different rates. You can design with massive elements sitting in the sunshine to absorb the energy and release most of it much later to smooth out the daily variation, but that subtlety is for more complex models.
Cooling at Night with the Heat Off
We could make a guess at an overall $mC_p$ by watching how quickly the space cools.
\begin{align}
m C_p&\approx (q_i – q_o)/\frac{dT_i}{dt}\\
&\approx \frac{\Delta t}{\Delta T_i}(q_i – q_o)
\end{align}
The design load $q_o$ for our condo was 3255W at a temperature differential of 45C, so we would expect it to be about 2000W in the early morning hours of January 26, when the temperature difference between indoors and outdoors was only about 30C. (All of our losses were proportional to $(T_i-T_o)$ totalling about $72\rm\;W$ for every degree Celcius of difference.) By eye, the temperature drop $\Delta T_i$ is about $1\rm\;C$ over $\Delta t$ of six hours ($21600\rm\;s$). The energy input $q_i$ would be close to zero if the condo was empty, with the power off, but with two people and the usual collection of computers, appliances, etc. it was probably about 500W, which is close to our average summer electrical consumption.
\begin{align}
m C_p&\approx \frac{\Delta t}{\Delta T_i}(q_i – q_o)\\
&= \frac{21600}{-1}(500 – 2000)\\
&\approx 30000000 {\rm\; J/C} = 30 \rm\; MJ/C
\end{align}
Looking back, the thermal mass of just the air in the condo was
\begin{align}
m C_p&=\rho V C_p \\
&= 1.2\times 227\times 1004\\
&\approx 300000{\rm\; J/C} = 0.3\rm\; MJ/C
\end{align}
so the total thermal mass of the living space is about 100 times higher than just the thermal mass of the air. For the condo that might not be too surprising as concrete is about 2000 times the density of air and has a specific heat about 20% lower, so a 6 inch thick concrete floor would account for it all. I’m using very round numbers here to emphasize that we are really just guessing at orders of magnitude when we say it takes about $30\rm\; MJ$ to warm the condo by $1\rm\;C$.
Warming in the Sunshine with the Heat Off
Our solar model from the solar PV segment suggests that on a clear winter day we’ll get $700\rm\; W/m^2$ or more of solar intensity at some point in the day, falling on a vertical window facing anywhere between SW and SE. If 60% of that gets through the window to the interior, and our condo has $10\rm\; m^2$ of window, then the peak solar gain would be the intensity multiplied by the transmission fraction and the area:
\begin{equation}
q_s = I \tau A_f = 700\times 60\% \times 10 = 4200\rm\; W
\end{equation}
If we are still losing $2000\rm\; W$ by conduction, and gaining $500\rm\; W$ from indoor sources, that’s a net gain of $2700\rm\; W$ so that
\begin{align}
\frac{dT_i}{dt} &=(q_i – q_o)/(m C_p) \\
&= (4200 + 500 – 2000)/30000000 \\
&= 0.00009{\rm\; C/s} = 0.32 \rm\;C/h
\end{align}
or only about half the rate of increase we see in the early part of the morning. What’s going on?
The sun falls on the furniture and the wood floor, warming them quite quickly, which in turn warms both the air and the concrete floor under the hardwood. The air warms quickly (that’s what we are measuring), while the more massive concrete floor takes longer. This is where our model fails to account for the complexity of the real system. Still, it may give us some useful insight.
Stepping Through the Heating Day
If we started out at midnight, assuming the temperature at the end of the previous day was $20\rm\;C$ and we know it is $-9\rm\;C$ outside we can calculate the heat losses through the walls and windows, $q_o$. We can assume a gain of around $q_a=500\rm\;W$ from people and appliances, and for now anyway, the sun isn’t shining ($q_s=0$) and the heat is turned off ($q_h=0$).
\[
q_o = 72(T_i-T_o) = 2088{\rm\;W}\quad\quad
q_a = 500{\rm\;W}\quad\quad
q_s = q_h = 0
\]
\begin{align}
\frac{dT_i}{dt} &=(q_h + q_a + q_s- q_o)/(m C_p)\\
&= (0 + 500 + 0 – 2088)/30000000\\
&= -5.3\times 10^{-5}{\rm\; C/s}
\end{align}
which sounds like a very small change until we remember that there are 3600 seconds in an hour and 24 hours in a day. If we divide our day into minutes, then we can predict the approximate temperature at 1 minute after midnight based on the assumption nothing changes very much in that short time.
\begin{align}
T_i(00:01) &= T_i(00:00) + \frac{dT_i}{dt}\Delta t\quad{\rm where}\quad \Delta t = 60\rm\;s\\
&= 20.0 + (-5.3\times 10^{-5})\times60\\
&= 19.9968\rm\;C
\end{align}
We can now use the new temperature value to determine $q_o$ at 1 minute after midnight and thus $dT_i/dt$ and proceed to find $T_i(00:02)$ for two minutes after midnight, and so on as long as we want. Eventually we will get to 06:30 where $q_h$ will go up when the heat comes on, and later the sun will rise and $q_s$ will start increasing. The combined results are best appreciated by looking at the Solar Condo Day notebook that completes the calculations in Python. For a clear day it gives results much like the data above, getting about 2/3 of total heating energy requirements from the sun. The model needs much more heater input on a cloudy day, as expected.

With models like these you can predict not just the maximum heating requirements for your tiny house, but also the actual, lower, day to day requirements when the sun shines and the temperatures are not as low. It will be important to consider multiple days in sequence and how they might draw down your batteries if you are off-grid.
A Simpler Daily Energy Balance
Although, in reality the indoor & outdoor temperatures and the level of insolation will be constantly changing, we can simplify for a single day with some assumptions that are not terribly wrong:
- The indoor temperature is constant at a value based on comfort choices and/or property standards
- The outdoor temperature is constant at the daily average temperature
- The solar heat gain and solar PV energy for the day can based based on the total full sun hours
- There is enough battery capacity to even the electrical load out over the length of the day
- There is enough thermal mass in the tiny house to smooth out the temperature over the length of the day
- Electrical energy conversion and storage losses are negligible (not true, but it is recovered as heat inside the house)
Starting with those assumptions we can construct a table like the one below (use a spreadsheet because you will be repeating the calculations) to balance out the electrical and heat energy streams. This particular example looks at a cold, but reasonably sunny day in December and finds that there is enough sunshine to provide an excess of both heat and electrical power based on the selected design parameters.
|
Operating Hours |
Electrical Energy In [kWh] |
Heat Energy In [kWh] |
|||||
| Indoor Temperature | 20 | C | |||||
| Outdoor Temperature | -20 | C | 40 | C Temperature Difference | |||
| Solar at Panel Elevation | Full Sun Hours: |
3 |
|||||
| Solar at Vertical (Windows) | Full Sun Hours: |
4 |
|||||
| Panels | 12 | panels at | 380 | W each in full sun |
3 |
13.68 | |
| Gas Generator | 1 | generator at | 2000 | W max each |
0 |
0.00 | |
| Propane Heater | 1 | heater at | 2000 | W max |
0 |
0.00 | |
| Windows Solar Gain | 10 | square metres | 600 | W max / m**2 in full sun |
4 |
24.00 | |
| Household Loads (incl HW Standby) | 1 | misc at | 300 | W max each |
24 |
-7.20 | 7.20 |
| Exterior Loads | 1 | Shower hot water | 2.5 | kWh max each | -2.50 | ||
| Heat Pump | 2.2 | COP | 800 | W max electrical |
4 |
-3.20 | 7.04 |
| Windows Loss | 10 | square metres | 1 | m**2 K / W |
24 |
-9.60 | |
| Doors Loss | 2 | square metres | 1 | m**2 K / W |
24 |
-1.92 | |
| Walls Loss | 70 | square metres | 5 | m**2 K / W |
24 |
-13.44 | |
| Roof Loss | 30 | square metres | 10 | m**2 K / W |
24 |
-2.88 | |
| Floor Loss | 30 | square metres | 10 | m**2 K / W |
24 |
-2.88 | |
| Infiltration Loss (incl HRV) | 75 | cubic metres | 0.3 | air changes/hour |
24 |
-7.23 | |
| Excess Electricity | 0.78 | ||||||
| Excess Heat | 0.29 |
There are lots of things we can adjust here, in order to get a slightly positive energy balance. If the sun wasn’t shining we could run the propane heat and the generator for a while, but that would have an adverse environmental impact. We could save some energy by not showering, or showering faster…
At a minimum, examine the performance of your tiny home on an average December day, a cold day with clear skies, and a cold cloudy day to provide a picture of your fossil fuel and grid energy consumption.
Media Attributions
- 2019-01-26 Condo
- 2019-01-26 Condo Model
- 2019-01-27 Condo
