Jonathan Beatriz
Introduction
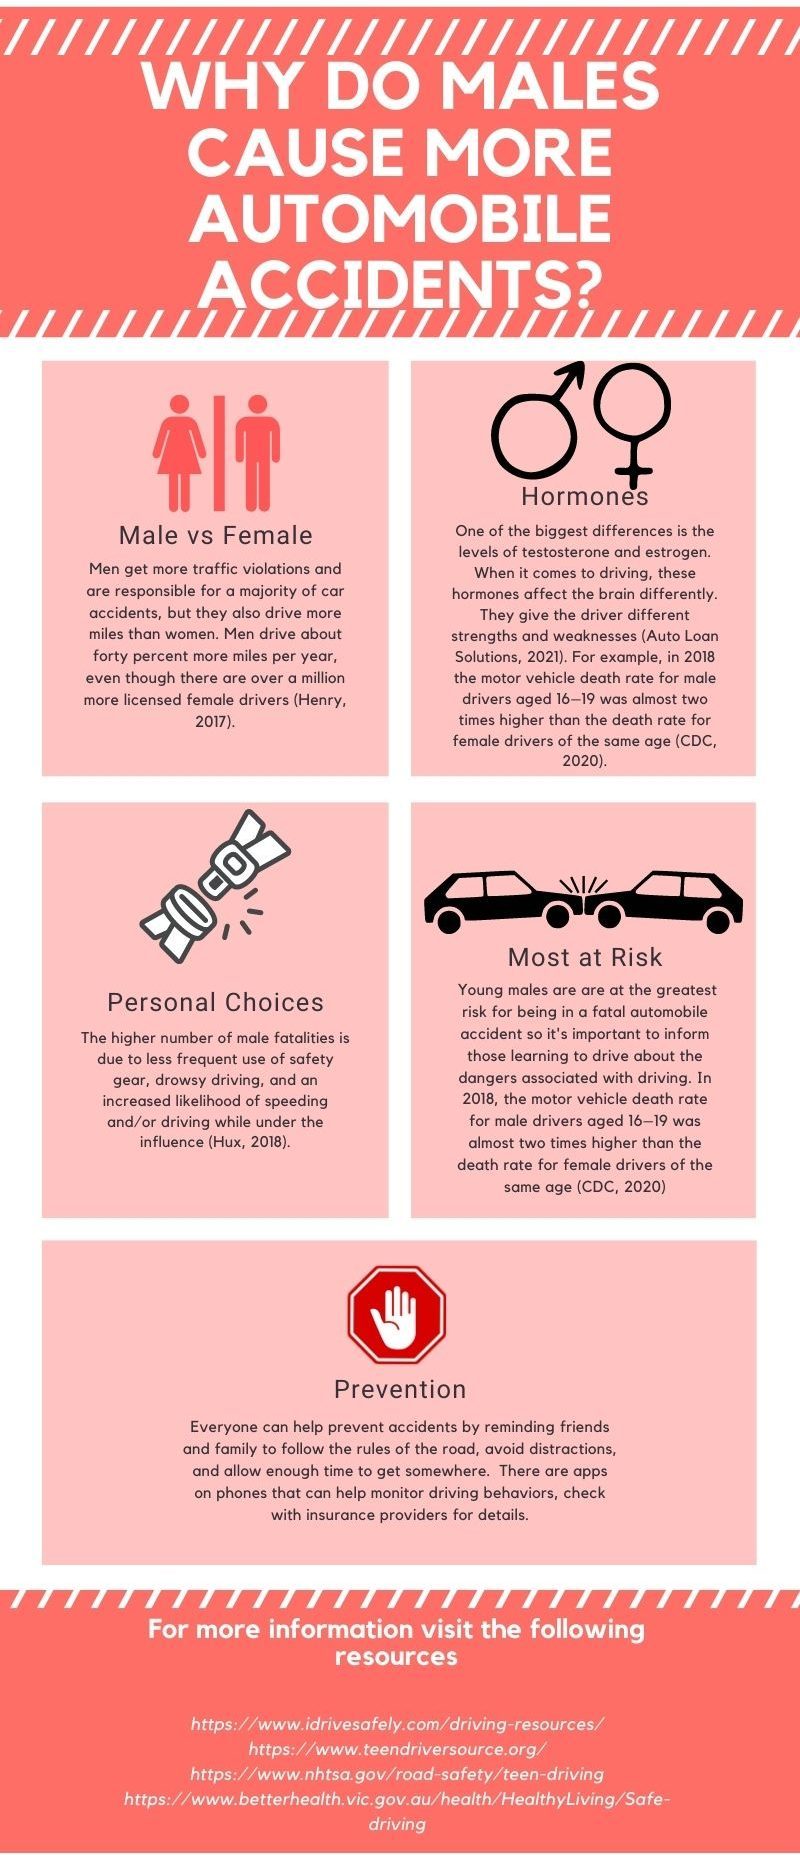
There is a long-lasting idea that men are better drivers than females. However, this idea is not completely true. There are differences in the way men and women drive, and they are due to risk behaviors that each gender is willing to take. Men get more traffic violations and are responsible for a majority of car accidents, but they also drive more miles than women. “A recent study shows that men drive about forty percent more miles per year, even though there are over a million more licensed female drivers” (Henry, 2017). The differences in driving behaviors between males and females are largely due to cognitive and hormonal variables.
Hormonal Differences
The differences in the biology of males and females influence their behavior. One of the biggest differences is the levels of testosterone and estrogen. When it comes to driving, these hormones affect the brain differently. They give the driver different strengths and weaknesses. “Testosterone increases two driving skills called spatial awareness and visual processing”(Auto Loan Solutions, 2021). Visual processing refers to the brain’s ability to understand what is seen (Auto Loan Solutions, 2021). Spatial awareness is the ability to understand the relationship between oneself and other objects (Auto Loan Solutions, 2021). Another aspect that testosterone influences is temperament. This does not mean that it makes men more aggressive drivers, but it can make men take more risks and feel overconfident. For women, estrogen gives them a boost in concentration (Auto Loan Solutions, 2021). This means that theoretically women focus more on the road ahead rather than getting distracted.
Culture
Another important factor that is connected to the increased rate of male crash fatalities is cultural differences. Many of these differences come from stereotypes and history. Cars are typically seen as a male item. For example, whenever a family goes out on a drive, it is typically the father figure that is behind the wheel. The purchase of cars designed for the sport of play is greatly male-dominated. These contrasts can stem from childhood experiences. Young boys are typically given cars more often than young girls. The idea of a car being a toy is often carried into adulthood and can be seen in male driving behaviors. Men and women tend to approach car buying differently.
“A study done by CNW Marketing Research also found that women do more research and approach the purchase of an automobile with a clearer idea of what they want. Women tend to focus on safety features, reliability, and convenience which decreases the chances of death in an accident” (Hux, 2018).
Personal Choices
Male fatalities are higher due to the less frequent use of safety gear, drowsy driving, an increased likelihood of speeding, and/or driving while under the influence. “In 2015, out of 35,065 deaths, 48% involved people that were not wearing seat belts. In the same year 30% of fatalities involved drivers with a BAC (Blood Alcohol Concentration) higher than 0.8, and 26% involved a driver that was speeding” (Hux, 2018). These numbers include both men and women, but when looked at regarding gender a drastic difference can be seen. Out of a total of 11,726 male driver deaths, 3,943 were due to a high BAC and 3,319 were because of speeding. These numbers are many times more comparatively than for women. “Out of a total of 4,750 female driver deaths, 999 were due to a high BAC and 946 were due to speeding”(Hux, 2018). A published report, by Brian Tefft in 2012, suggests that drowsy driving is responsible for as many as 7,500 fatal motor vehicle crashes.
The trend in which men are more likely to participate in risky behavior continues with drowsy driving. “Overall, the prevalence of drowsy driving was higher among men than women (5.0% compared with 3.0%, p<0.001). The prevalence of drowsy driving for men aged 18–34 years was 6.9%, compared with 3.5% for women in the same age group”(Wheaton et al., 2014).
Helping Young Drivers
Based on the factors and data presented, the best way to help prevent, or at least reduce, the number of automobile fatalities would be to inform future or current drivers. Young males are the demographic who are at the greatest risk for being in a fatal automobile accident. In order to reduce these high numbers more preventative information should be provided to future drivers. Presenting real data and statistics can be potentially eye-opening and can perhaps entice drivers to take better care while driving.
Other more invasive options could be driving prevention/monitoring devices. “Devices called “ignition interlocks” can be installed in cars to prevent them from starting when the driver’s blood-alcohol level exceeds the limit” (Office of Communications, 2016). There are also apps that can monitor the speed at which a driver is driving. These apps would allow parents to monitor young drivers to ensure they don’t speed. If any additional information or help is needed visit the websites listed in the following infographic.
Chapter Review Questions
1. What does BAC stand for?
A. Binged alcohol content
B. Blood alcohol content
C. Booze acquired complex
D. Breath alcohol content
2. What is a typical male’s temperament when it comes to driving?
A. Safe and timid
B. Empathetic and careful
C. Risky and overconfident
D. Angry and anxious
3. What is spatial awareness?
A. Ability to generate, retain, retrieve, and transform well-structured visual images
B. Ability to remember different locations as well as their relations
C. Ability to identify the position or direction of objects in space
D. Ability to understand the relationship between oneself and other objects in space
References
Auto Loan Solutions. (2021, January). What science has to say about men & women drivers. https://www.autoloansolutions.ca/blog/are-men-or-women-better-drivers-pt-1-what-science-says/.
Centers for Disease Control and Prevention. (2020, November 18). Teen drivers: Get the facts. https://www.cdc.gov/transportationsafety/teen_drivers/teendrivers_factsheet.html#:~:text=Who%20is%20most%20at%20risk,be%20in%20a%20fatal%20crash.
Henry, D. (2017, August 11). Who causes more car accidents? The data may surprise you. Traffic Safety Resource Center. https://www.trafficsafetystore.com/blog/who-causes-accidents.
Hux, P. D. (2018, August 23). The influence of gender in motor vehicle fatalities. Allen and Allen. https://www.allenandallen.com/the-influence-of-gender-in-motor-vehicle-fatalities/.
Insurance Institute for Highway Saftey. (2019, December). Fatality Facts 2018: Gender. IIHS. https://www.iihs.org/topics/fatality-statistics/detail/gender.
Laapotti, S., & Keskinen, E. (1998, December 1). Differences in fatal loss-of-control accidents between young male and female drivers. Accident Analysis & Prevention. https://www.sciencedirect.com/science/article/pii/S0001457597001218/.
Murdoch, A. C. (2020, February 27). Unraveling the statistics: Are men better drivers than women? https://www.thenationalnews.com/lifestyle/motoring/unravelling-the-statistics-are-men-better-drivers-than-women
Office of Communications. (2016, December 1). What are some known solutions to risky driving? Eunice Kennedy Shriver National Institute of Child Health and Human Development. https://www.nichd.nih.gov/health/topics/driving/conditioninfo/solutions.
Tefft B. C. (2012). Prevalence of motor vehicle crashes involving drowsy drivers, United States, 1999-2008. Accident; analysis and prevention, 45, 180–186. https://doi.org/10.1016/j.aap.2011.05.028
Wheaton, A. G., Shults, R. A., Chapman, D. P., Ford, E. S., & Croft, J. B. (2014, July 4). Drowsy driving and risk behaviors – 10 States and Puerto Rico, 2011-2012. MMWR. Morbidity and mortality weekly report. https://www.ncbi.nlm.nih.gov/pmc/articles/PMC4584902/.
sex hormone responsible for the development of male sexual characteristics and stimulates the activity of the male secondary sex characteristics
sex hormone responsible for the development and regulation of the female reproductive system and secondary sex characteristics
percent of blood that is concentrated with alcohol
