Lesson ideas: Content and Language Integrated Learning (CLIL) at secondary school
9 Teaching geography in English: How to describe a graph
Hanna Bavendiek and Fabian Giesholt
1 Introduction and rationale
In a fast and globalised world, English serves as the lingua franca of the 21st century, especially on the internet. Bilingual teaching of other subjects besides English itself is finding increasing popularity among German secondary schools, as it offers great potential for successful second language acquisition.
Geography presents a perfect opportunity to combine regular class topics with students’ increasing language proficiency. Due to the internationality of its content, intercultural learning can be particularly encouraged when geography is taught in English. Moreover, the vivid nature of geography teaching, which frequently involves lots of maps, illustrations and caricatures, provides suitable support for second language learners because geography is often not perceived to be as abstract as many other school subjects (Niedersächsisches Kultusministerium 2015: 28). The contemporary relevance of geographic topics presents promising opportunities for bilingual teaching. The English curriculum of Lower Saxony (Germany) further specifies that appropriate subject-specific terminology ought to be acquired in both the first and second language of learners (Niedersächsisches Kultusministerium 2015: 28).
A central aspect of geography teaching in the classroom is the analysis of graphics and illustrations. Especially graphs and diagrams are found in almost all geography topics. Thus, the ability to describe such figures is a crucial competence in order to succeed in geography. However, in a foreign language context, this ability can be quite difficult to achieve. Students may be able to produce precise descriptions in their mother tongue but struggle to transfer this ability to English because specific vocabulary is missing. In light of this difficulty, a corpus analysis can help retrieve the language necessary to describe graphs and diagrams in an idiomatic manner.
A corpus analysis of geography-specific language offers a wide variety of options for students to improve their own language skills. Following a data-driven learning approach, students are enabled to research collocations and frequent patterns of native and expert language usage themselves. Furthermore, these methods of corpus analysis are easily deployable within other language learning processes to increase language proficiency in other areas of English communication. Corpus analysis enables students to gain insights into native/expert language usage through independent, self-regulated learning.
Outline and objectives
This lesson is designed to be taught within a bilingual geography classroom of 10th-graders at a German secondary school (Gymnasium). Bilingual teaching combines foreign language acquisition with specific subjects to acquire a more profound language proficiency within a subfield of academic study. In this lesson, students learn about the demographic transition model by reading texts and drawing a graph. Furthermore, they learn how to describe a graph by querying a corpus to advance their language skills.
By the end of the lesson, students will be able to …
- … understand and use appropriate words and collocations to describe a graph.
- … use the Concordance, Thesaurus, and Word Sketch function in Sketch Engine.
- … differentiate between these functions and know when to use them.
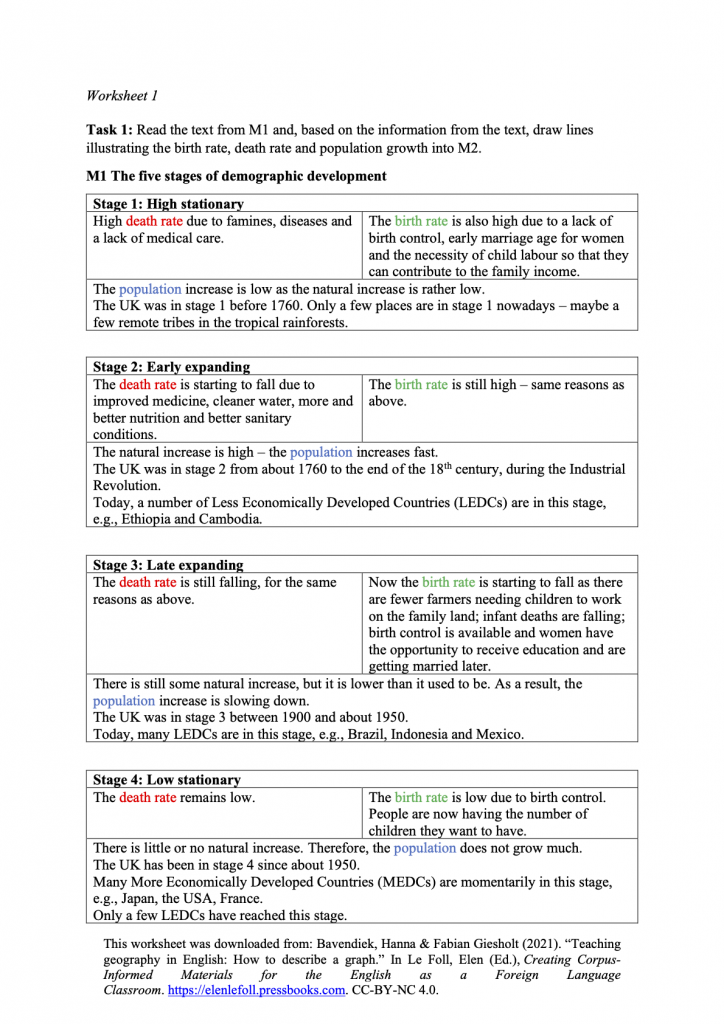
The student activity in relation to diagrams is split into two 90-minute lessons. First, the diagrams are created from the necessary information in worksheet 1 (see page 10). Second, the actual connection to a corpus-based analysis is drawn: students analyse concordances in the English Web 2015 (enTenTen15) corpus on Sketch Engine. This lesson takes a learner-corpus interaction approach towards gaining deeper insight into language usage by utilizing corpora for specific contexts.
2 Corpus, tools and methods
The planned lesson is based on the online corpus tool Sketch Engine. Sketch Engine provides a variety of different corpora and functions for corpus analysis, making it a suitable option for language learners to engage with. The students in this particular class are already familiar with the online tool. The following step-by-step-instructions may provide further support. For the first part of the corpus-based lesson, students work with the English Web 2015 (enTenTen15) corpus and use the Concordance and Thesaurus functions to search for synonyms. In the second part of the lesson, students use the Word Sketch function to find topic-related collocations, which they can use to describe the demographic transition model. Therefore, students will work with three different functions of Sketch Engine, which will help them to increase their language proficiency in the bilingual geography classroom. Utilizing the different functions and corpora will show students that one needs to select the right function to obtain meaningful results.
3 Step-by-step guide for Teachers
3.1 Lesson Plan
Preparatory lesson
|
|
Content |
Methods |
Materials |
|
Warm-up |
Photo description |
Plenary discussion |
Photo of babies, projection via a projector |
|
Task 1 |
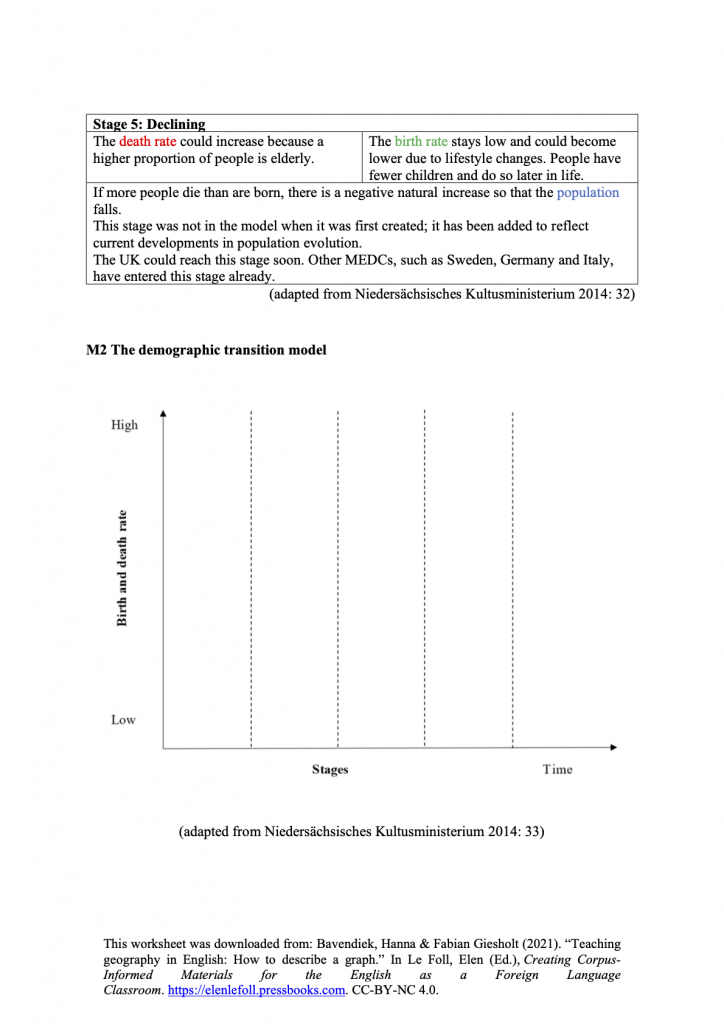
Students read the texts and transform the information into a diagram |
Group work |
Worksheets |
|
Task 2 |
Students draw the diagram on the board and explain the stages of the demographic transition model |
Plenary discussion |
Board |
|
Homework |
Underline all the words in the texts that describe the demographic transition model |
|
|
Main lesson
|
|
Content |
Methods |
Materials |
|
Warm-up |
Description of the demographic transition model |
Plenary discussion |
Demographic transition model, projection via a projector, board |
|
Task 1 |
Students work with corpora to find useful words for describing the diagram |
Pair work |
Worksheets, Computers, Internet |
|
Task 2 |
Students use Sketch Engine to search for alternative terms to fall and increase to write a description of the patterns of population development |
Individual work |
Worksheet, Computers, Internet |
|
Homework |
Write the description |
|
|
3.2 Instructions
In the preparatory lesson, students learn about the characteristics of the different stages of the demographic transition model, following the information provided on Worksheet 1 to draw a graph. This provides the basis for the following lesson with regard to content. As a preparation for the main corpus-based lesson, students get homework in which they have to underline all the words in the texts on Worksheet 1 that describe the demographic transition model. The idea of the corpus-based lesson is essentially to help students identify different words and collocations to describe a graph by using a corpus.
3.3 Main Lesson
3.3.1 Warm-up
The lesson begins with an oral description of the demographic transition model from the previous lesson in a plenary discussion. We expect students to use the word show most frequently, e.g., the graph shows... The teacher will point this out and then students are encouraged to think of verbs other than show that can be used in this context. Meanwhile, the teacher notes down the students’ ideas on the board.
3.3.2 Main Lesson Task 1
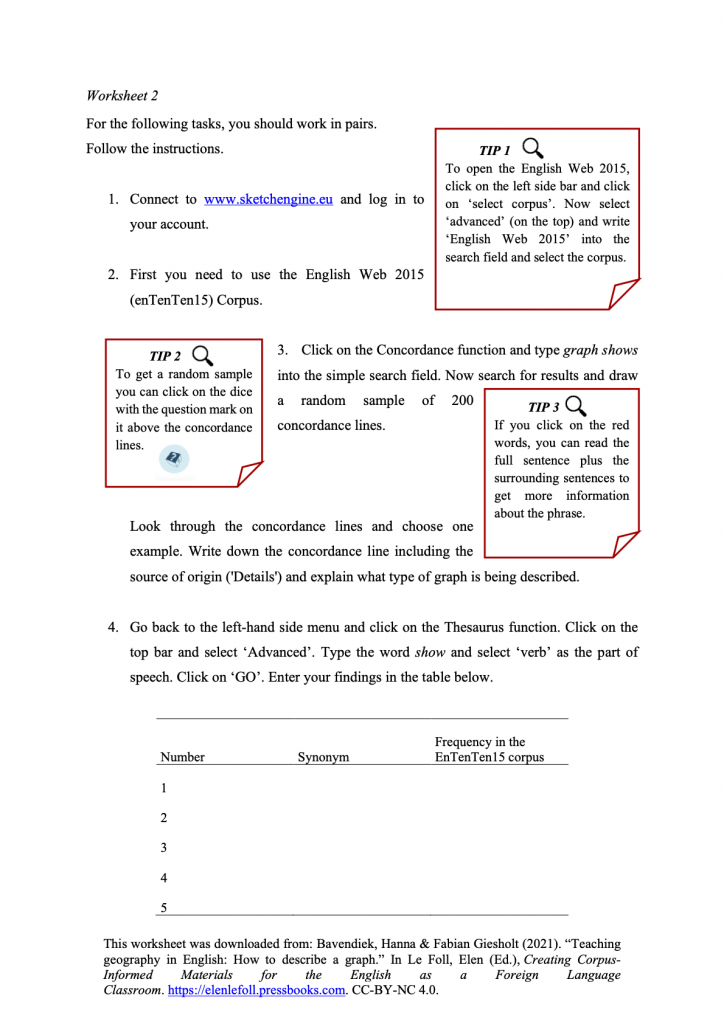
The following tasks require access to web-enabled computers or tablets in the classroom. Students work in pairs and share a device. They follow the instructions on Worksheet 2 and work independently with Sketch Engine. Students will have previously received a general introduction to Sketch Engine and created a personal account. However, the worksheet still provides detailed instructions and extra tips.
In the first task, students use the Concordance function in Sketch Engine to search for concordance lines that include the phrase: graph shows. By looking at the type of diagram that is described and identifying its source of origin, students familiarize themselves with working with a corpus. Seeing the structure of the concordance lines will help them to understand that a corpus is composed of various texts from different sources.
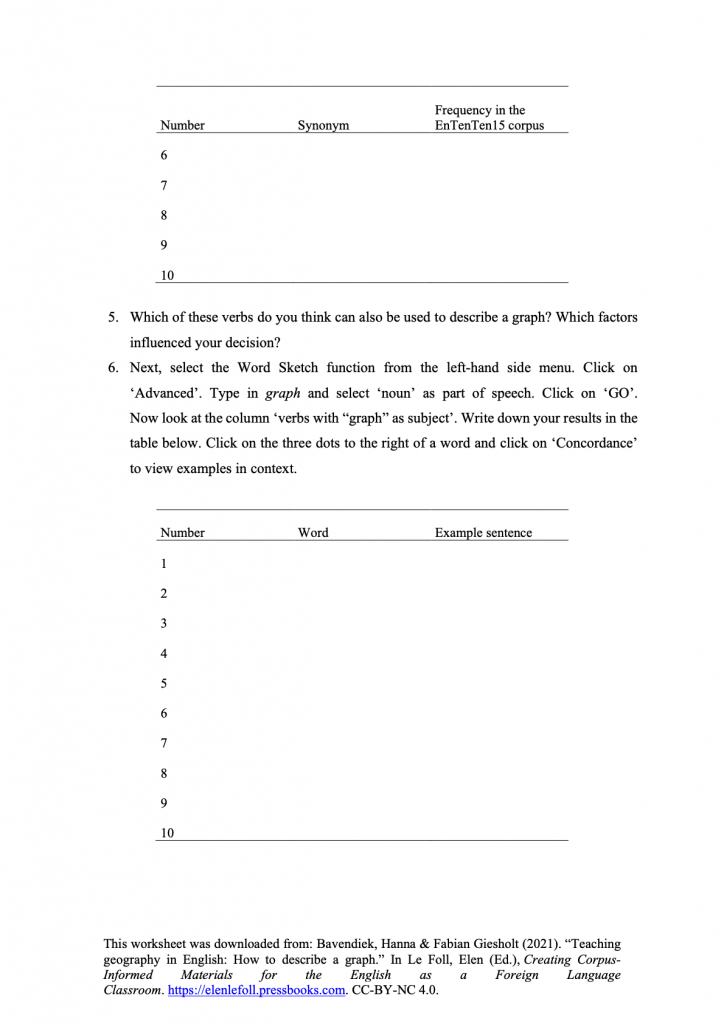
Next, students search for synonyms of the verb show in the English Web 2015 (enTenTen15) corpus by using the Thesaurus function. They note down their findings and draw assumptions about which verbs may be used in the context of graph descriptions.
To verify or disprove students’ assumptions, the next step includes the use of another function of Sketch Engine. This time students do not use the Thesaurus function but rather the Word Sketch function to look for collocations by searching for verbs that are used with graph as a subject. Then students write down their results and compare them to their findings from the Thesaurus search. Additionally, they may reflect on the differences between a Thesaurus and a Word Sketch search and decide which method is more effective for their purpose of finding alternative verbs to show to describe a graph.
3.3.3 Main Lesson Task 2
The final task of this corpus-based lesson attempts to encourage students to apply their knowledge of working with a corpus to write in-depth descriptions of graphs and their trends and peculiarities. For homework, students were asked to underline all the words that describe the graph on worksheet 1. Apart from show, the verbs increase and fall are also used to describe the developments of the stages of the demographic transition model on the worksheet. Students are asked to use Sketch Engine to search for synonyms of these verbs and to find additional words and collocations that describe the graph. Finally, students write a complete description of the demographic transition model.
3.4 Tasks
4 Options and further ideas
In order to achieve a suitable level of difficulty for all students, a certain degree of internal differentiation is necessary. While some students might find it comparatively easy to work with Sketch Engine individually, others might struggle and need more guidance. Thus, it is possible to make tasks easier or more challenging by leaving out or adding intermediate steps in the task description. The latter could be achieved through the addition of screenshots of the actual web pages.
Another possibility is the introduction to further materials for quicker students. These students could analyse an additional graph on population growth and change. Students could describe a graph showing the development of a population in a country of their choice after researching it in their textbook, atlas, or online. Figure 1 depicts an example of the German demographic transition model.
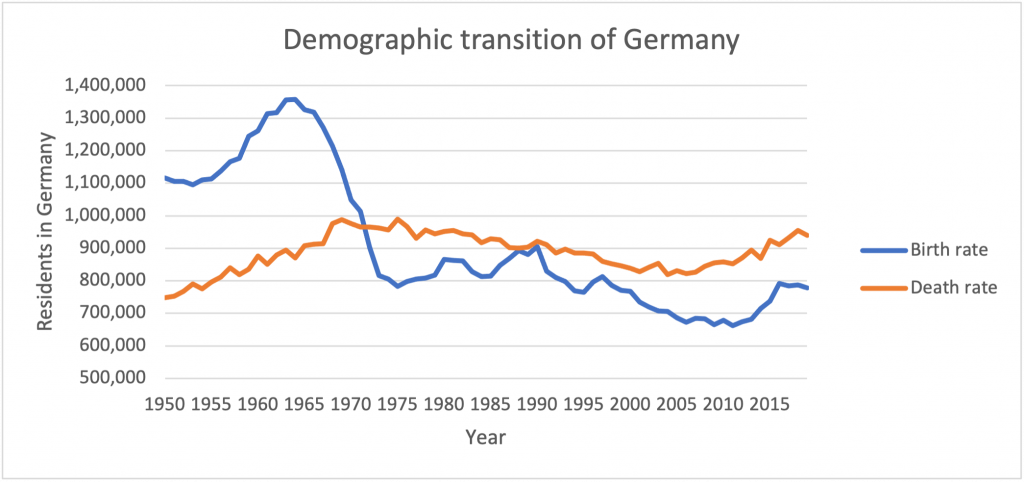
Once the initial tasks are completed, students who have finished could do a similar corpus analysis to acquire further language knowledge to describe maps or caricatures. To enable them to elaborate on this, an exemplary map or caricature is needed. The teacher could provide these in advance and students could describe either one of them with the help of corpus searches.
5 Caveats and Limitations
Difficulties might occur when working with the commercial platform Sketch Engine if the teacher and the students do not have personal accounts. Even though Sketch Engine has an open version (app.sketchengine.eu/#open) as well, it is not sufficient for the requirements described in this chapter since it only allows access to a very limited selection of corpora. One option would be to make use of a free 30-day trial during which all of Sketch Engine’s functions are accessible. However, this is only a short-term solution and might serve the purpose of this lesson but will restrict further corpus-learner interaction in the classroom. Alternatively, teachers may want to consider using the SKELL interface (skell.sketchengine.eu), which is much more limited in terms of functions, but is entirely free and was specifically designed with language learners in mind.
6 Conclusion
Bilingual teaching aims to encourage the most authentic use of a foreign language in a specific subject. We hope that this chapter has shown that working with corpora can be a great opportunity for students to expand their vocabulary and increase their language proficiency. Even though the corpus-based lesson itself requires more time than if the teacher simply handed out a list of vocabulary, we believe that corpus-based, data-driven learning is a great addition to the bilingual geography classroom. Searching words and collocations within a corpus challenges students. The lesson presented in this chapter thus requires students’ cognitive engagement throughout the tasks. Besides, the use of digital media is encouraging for students and is likely to be a welcome change to the usual style of teaching that students experience on a daily basis. Students not only learn new words but also how phrases and collocations are used in a context that is based on real, authentic texts. Furthermore, learner-corpus interaction in the classroom equips students with a tool that provides opportunities for use in the future that they can benefit from to improve their language skills in the long term.
7 Resources and references
Campbell, Maxi-Ann. 2018. Using COCA to answer the question on everyone’s lips. In Eric Friginal (ed.), Corpus linguistics for English teachers: New tools, online resources, and classroom activities, 299-305. New York, NY: Routledge.
Friginal, Eric. 2018. Corpus linguistics for English teachers: New tools, online resources, and classroom activities. New York, NY: Routledge.
Niedersächsisches Kultusministerium. 2014. Bilingualer Unterricht – Materialien für kompetenzorientierten Unterricht im Sekundarbereich I. http://arbeitsplattform.bildung.hessen.de/fach/bilingual/lehrer/ausb/mat/nibis-materialien_bili_2014.pdf (06 February, 2021).
Niedersächsisches Kultusministerium. 2015. Kerncurriculum für das Gymnasium, Schuljahrgänge 5-10: Erdkunde. https://cuvo.nibis.de/cuvo.php?skey_lev0_0=Schulbereich&svalue_lev0_0=Sek+I&skey_lev0_1=Fach&svalue_lev0_1=Erdkunde&docid=1112&p=detail_view (13 August, 2020).
Statistisches Bundesamt. 2020. Anzahl der Geburten und der Sterbefälle in Deutschland in den Jahren von 1950 bis 2019. https://de.statista.com/statistik/daten/studie/161831/umfrage/gegenueberstellung-von-geburten-und-todesfaellen-in-deutschland/ (15 February, 2021).
- Adapted from Niedersächsisches Kultusministerium 2014 ↵
