10
By Elizabeth Dahlberg, Gabriel Espinosa, and Jack Hanlon
Boston’s Assets and Vulnerabilities to Climate Change
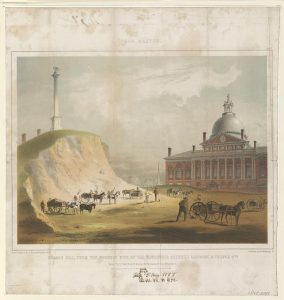
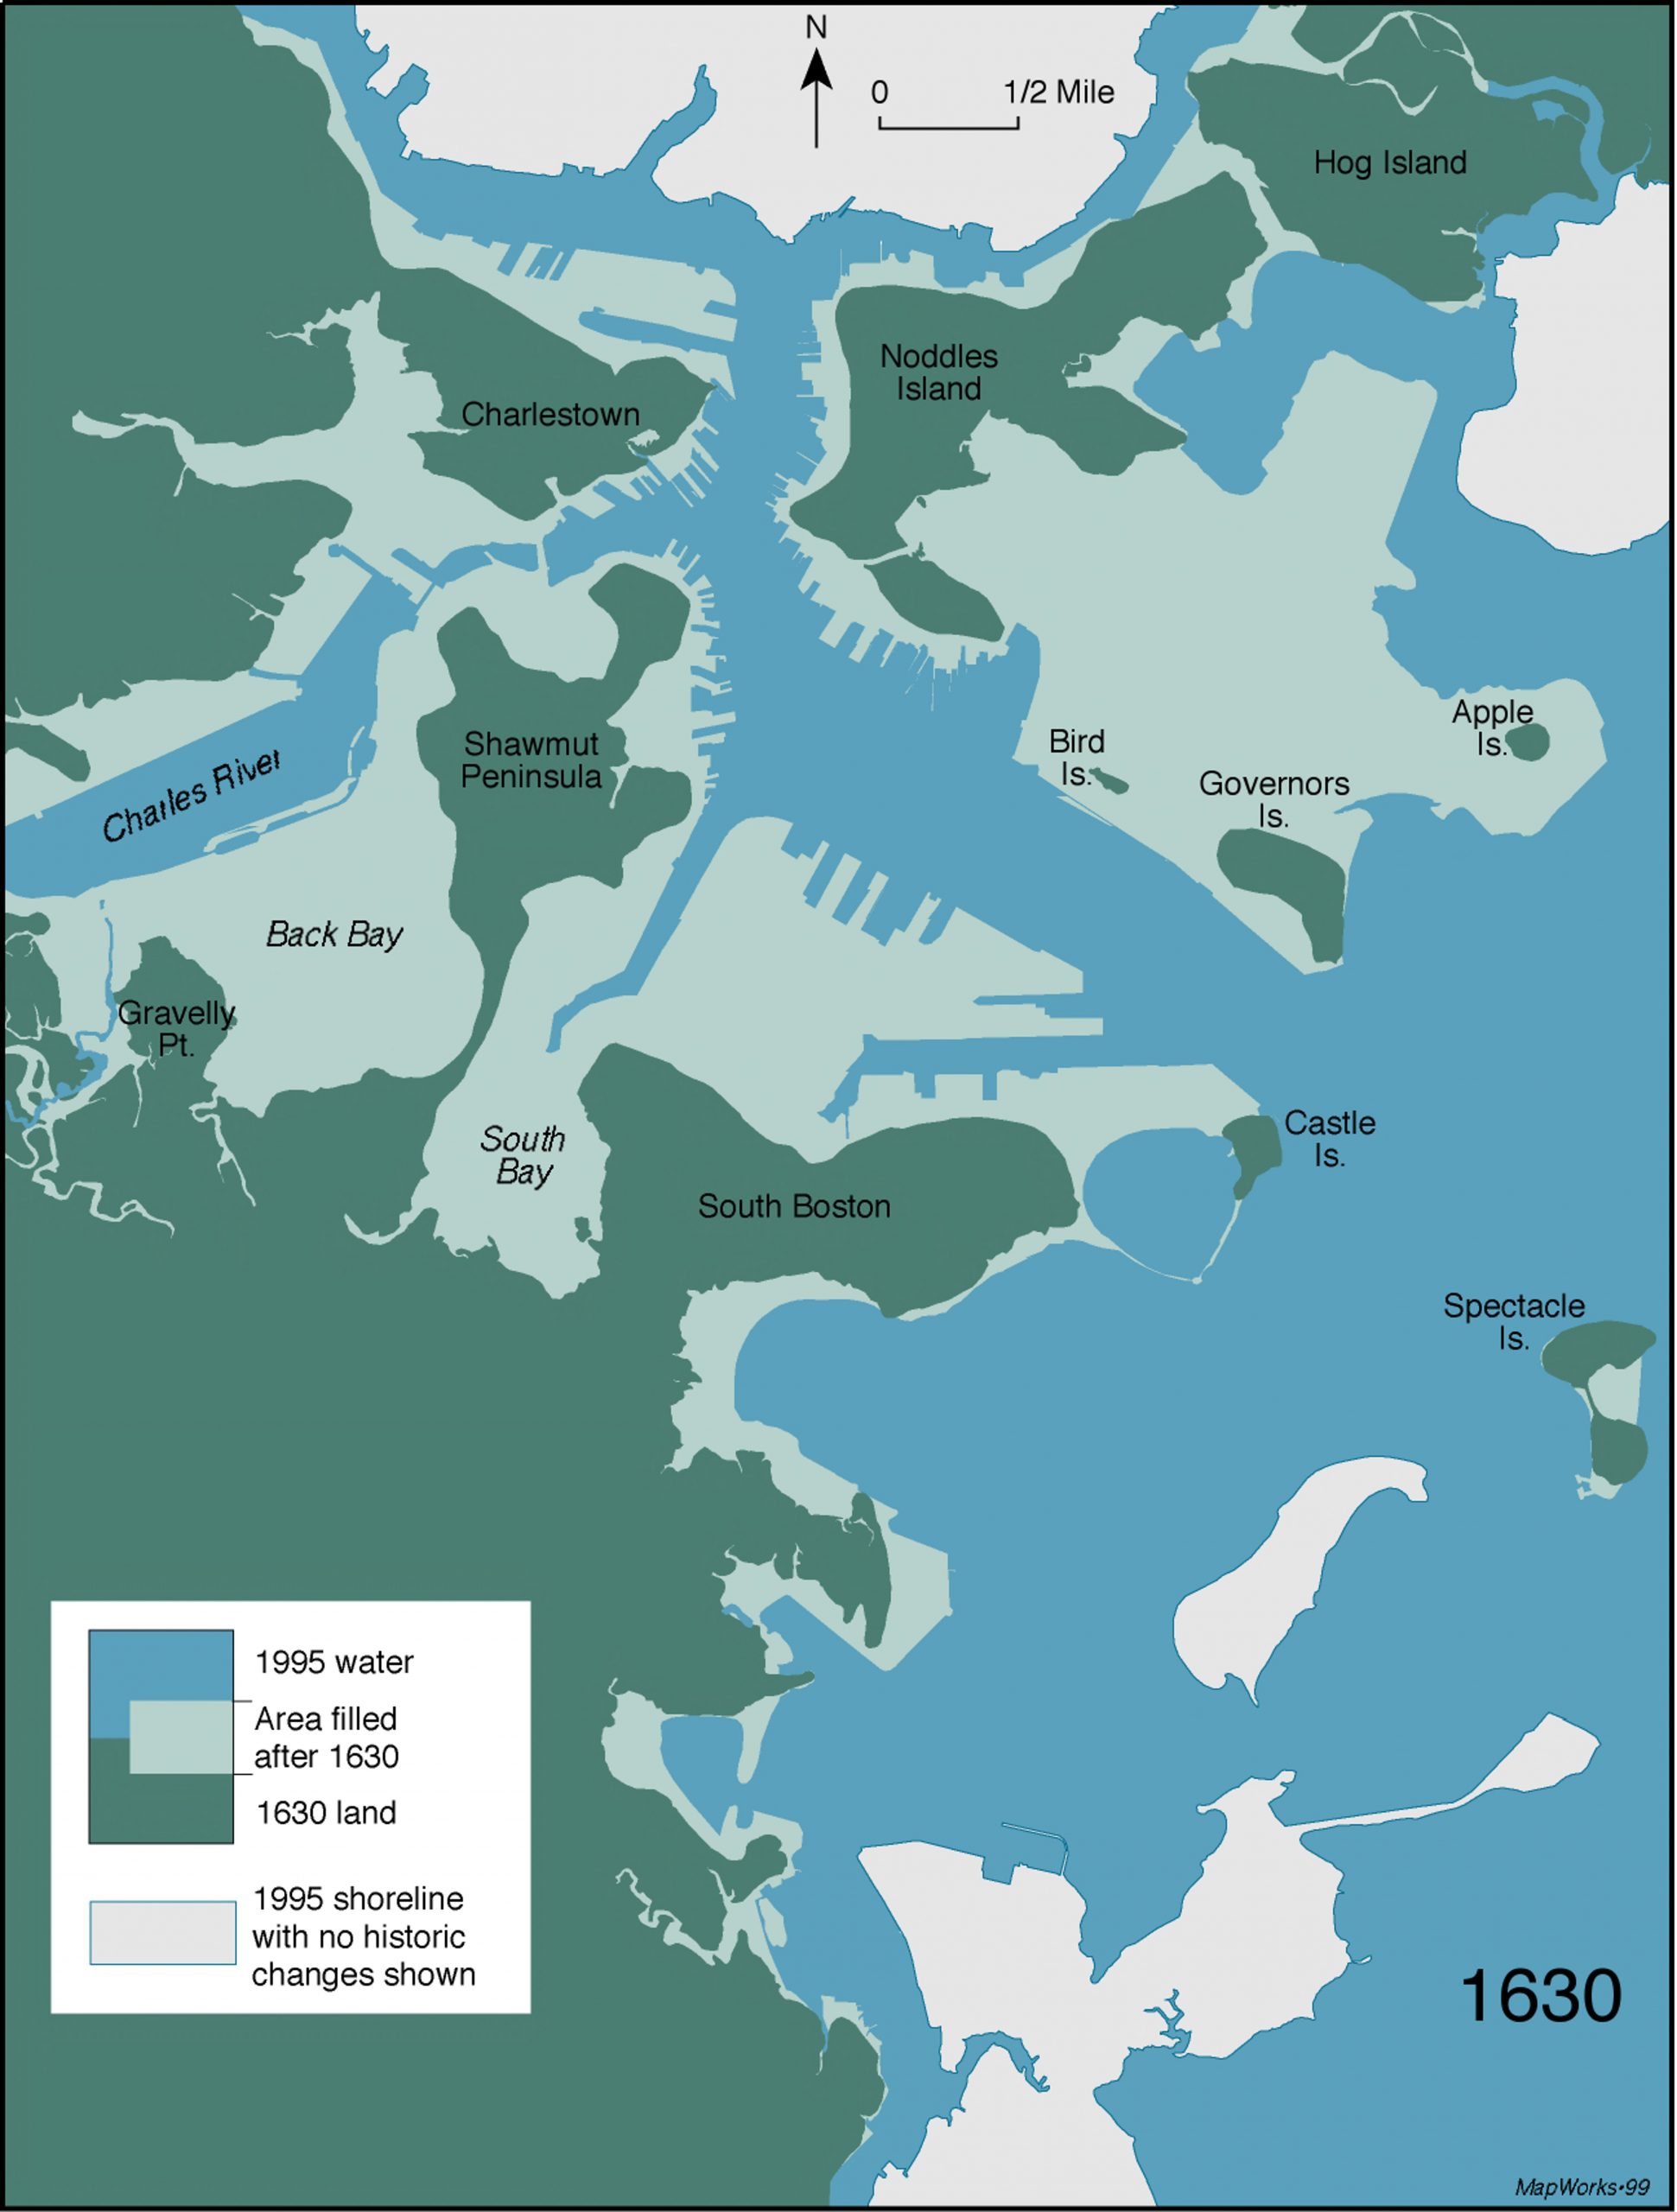
Boston has an exceptionally rich history, with notable events such as the Boston Massacre and the Tea Party occurring directly in the city, but one large scale project that begin in 1856 in response to a population boom is often overlooked. The filling in of the Back Bay is one of the most vital pieces of Boston’s history, and brought unmatched expansion in population, economic assets, and land to a city struggling with overpopulation at the time. However, this change (Figures 1 & 5) is now bringing up a variety of issues for the region, as much of the land was built at sea level, which, “similar to other coastal cities that were developed or expanded by filling wetlands, … is low lying and susceptible to flooding” (Bowen et al., 2019). A city commissioned report has also stated that predictive models of business-as-usual climate change may lead to a sea level rise of nearly 3 feet by 2070, flooding vulnerable spots, which stated by
the report “are commercial piers, Logan International Airport, low-income neighborhoods, the South End, and the New England Aquarium” (Mufson, 2020). Studies done by other universities, such as Harvard and Boston University, have also pushed officials to make changes, such as Mayor Martin J. Walsh, who “has vowed to spend more than $30 million a year … to defend the city from a watery future that is expected because of climate change” (Mufson, 2020) under the cities new budget plans for the next 5 years.
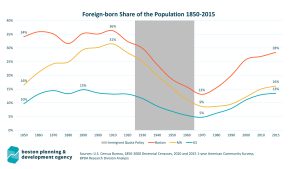
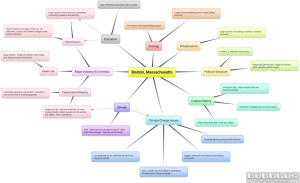
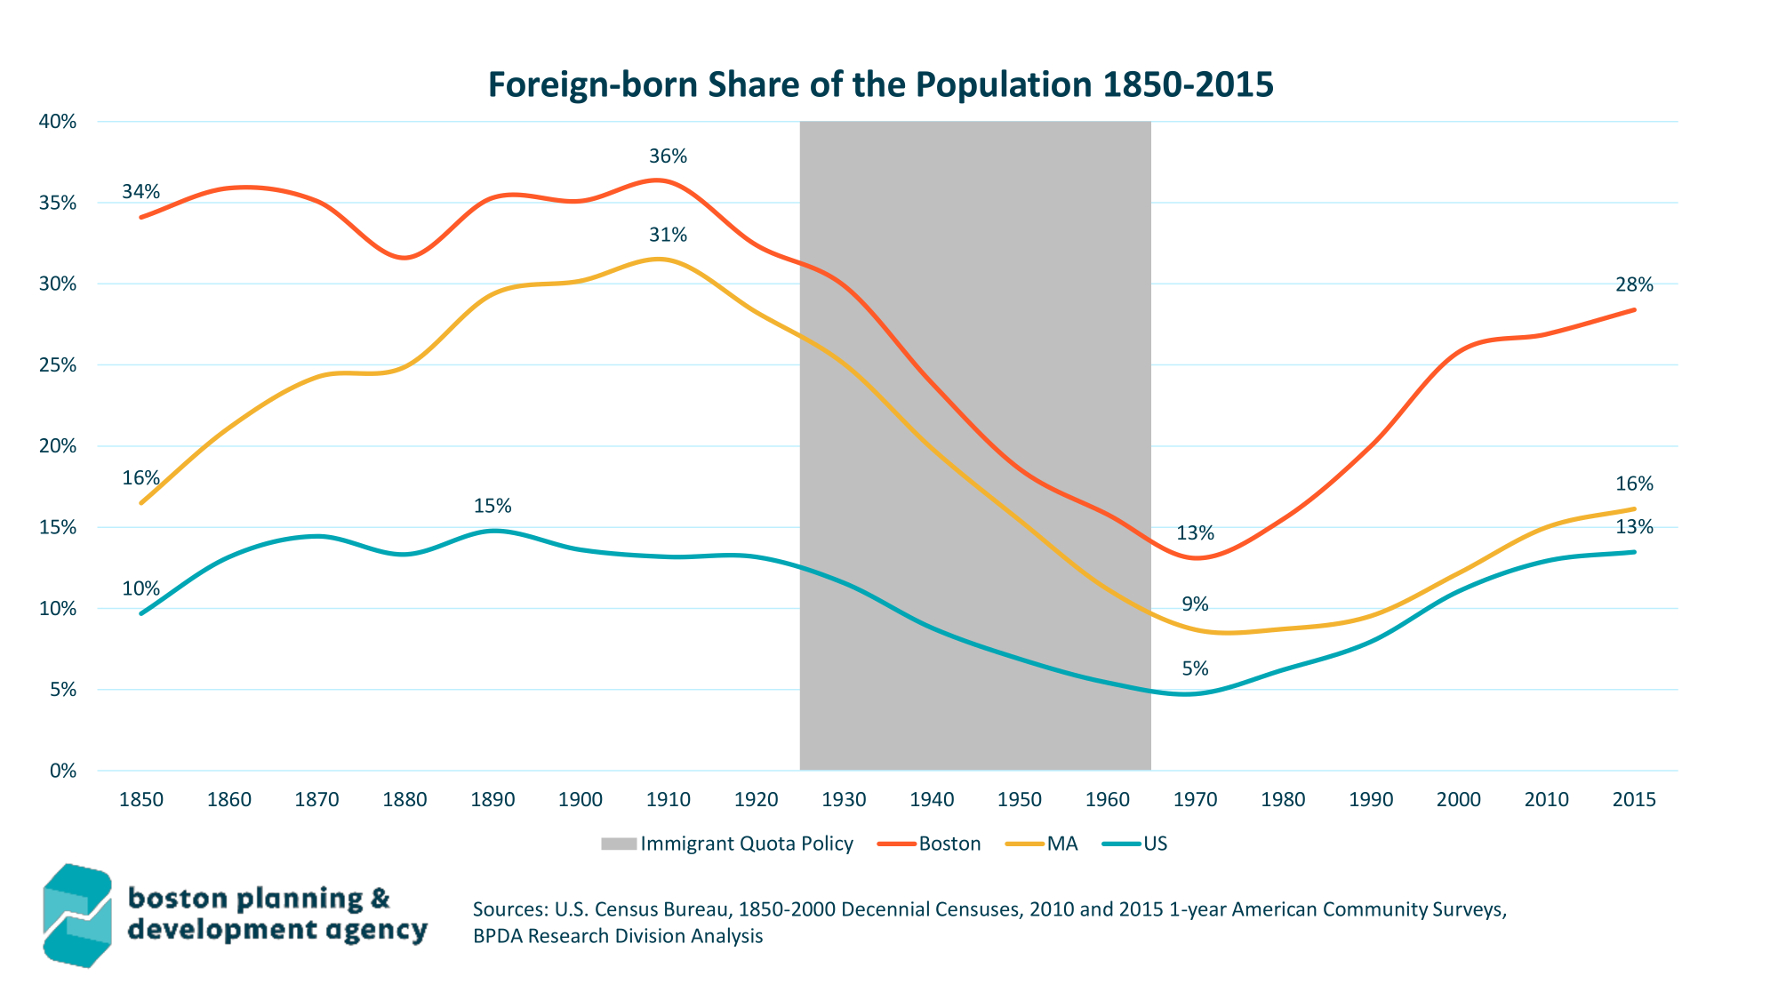
Boston, Massachusetts is an extremely culturally diverse city within the United States and has been that way since it was established in 1630. This is primarily due to a large majority of early settlers being immigrants, which have accounted for up to 36% of Boston’s total population since 1850 (Figure 2), and much of this drive is attributed to education, one of the cities greatest assets (See Appendix 1, at end of chapter for a map of the city’s assets and vulnerabilities to climate change). While there are a plethora of different arts, social institutions, ethnicities, and religions, the 54 higher educational institutions found within the area highlight the regions dedication to and culture of learning. The intense level of care for learning has led Boston to become a forefront in a multitude of different societal advancements, with one such advancement being its acknowledgment and preparedness for climate change and natural disasters. A George Washington University study found that academic sources are one of the most important factors in motivating cities to adapt to climate change, and that “work done by Massachusetts Institute of Technology and the Union of Concerned Scientists played important catalyzing roles in helping local officials understand what might happen in their city” (Carlson et al., 2015).
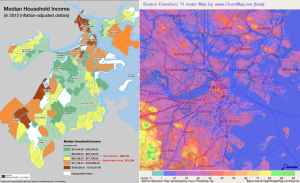
Boston is an economically and socially developed city of more than 700,000 people as of 2019. The city is home to diverse ethnic groups with over 48% of the population identifying as non-white and 28.5% identifying as foreign born (U.S. Census Bureau, 2019). Boston maintains a post-industrial economy with 142,000 people working directly in health care, insurance, and higher education, shifting the city far from its manufacturing roots (Lima, et al., 2011). With nearly 50% of the population 25 years or older having a college degree, education acts a vital export fueling a modern economy. Although the median household income in the metropolitan area is over $65,000 per year, 20% of the city’s population is characterized as below or at the poverty line, defined by making $12,000 yearly or less per person of working age in a family (U.S. Census Bureau, 2019). As seen in Figure 3, many lower income communities are in low elevation parts of the city and will face the effects of rising sea levels head on. It is important to note that wealthier communities in similar shoreline regions, however, have access to resources that will leave these areas better prepared for the climate impacts (Kirshen et al., 2008).
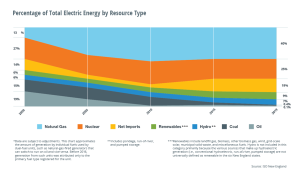
Boston and the greater New England is still heavily dependent on fossil fuels, making up 42% of the total energy supply, comprised of coal, oil, and natural gas (Gellerman, 2019; Figure 4). The remainder of the North East’s power input comes mostly from nuclear power plants, accounting for 40% of the total energy supply in the region. While there is still much work to be done in converting to all renewable sources, New England has seen a rapid disassociation from coal and oil power generation, decreasing usage by 32% since 2000. Contrasting this progress is the increased dependence on natural gas by 27% over the same period (Gellerman, 2019).
Water recourses in Boston are almost entirely locally sourced by reservoirs, rivers, and lakes throughout Massachusetts such as the Quabbin and Wachusett reservoirs. These water sources are projected to sustain the water demand of local communities for the foreseeable future and will act as a critical safety net for the region as climate change progresses (Suarez et al., 2005). Boston uses a mix of both imported and locally sourced food to supply its growing population (Loh & Agyeman, 2019). At this point nearly all food resources, internally or externally sourced are under threat from climate change as growing cycles and regions shift further north. Although the future of food in quite bleak, Boston has begun implementing food distribution systems for lower income communities struggling with accessibility (Loh & Agyeman, 2019).
Boston was established in 1630 on Shawmut Island by Native Americans (Mason, 2017). Throughout history Boston’s geographic features have changed because man-made land was used to create the Boston that we know today (Figure 5). Many of these man-made lands were the lands that use to power mills. Boston is a town with lots of hills, most known is Beacon Hill. During Boston’s expansion, the material to make new land was taken off Beacon Hill. In addition, they used trash, mud from South Bay, sand and gravel from Needham. The ecology of Boston Harbor is important to Boston because it provides help during floods. The freshwater river, the Charles River, is used for rowing competitions. The Boston Commons and the Boston Public Garden are used to exercise and places for communities to come together. Boston has grown so much throughout history and because of this it is susceptible to climate instability.
The Boston harbor is an estuary that connects the freshwater rivers, Charles, Mystic, and Neponset, and the saltwater Massachusetts Bay. The estuary provides Boston with flood cover and water filtration. It also provides important habitats for wildlife and is a nursery for marine organisms (National Park Service, 2015). This estuary is home to many diverse plants and animals. It has fauna from Maine, one type of eelgrass that was once plentiful, and has salt marshes. Whales, dolphins, and seals migrate and eat near the harbor. Their wildlife is very diverse and sees around 100 different bird species (National Park Service, 2015). The flora of the estuary is not the natural flora because of human alteration and many invasive and exotic species. The ecosystem does provide a home to six rare species of birds and two protected species of plants. There are endangered and threatened species of plants and animals in the Massachusetts coast, but are not found in the estuary (National Park Service, 2015). This estuary is very important to the wildlife of the coast and Boston, because without this estuary Boston could experience more disastrous floods in the future.
The metropolis of Boston has a history rooted in diversity and a people tied closely to the low-lying land around the bay. With the onslaught of climate change looming over the horizon, the city is more prepared than most to handle the challenges ahead. With goals to be carbon neutral by 2050 and resolve impact inequalities within the region, Boston and its people have daunting forthcoming. Will they be up for the task?
References
Boston Planning & Development Agency (2012). Median Household Income from U.S. Census Bureau, 2008-2012 American Community Survey 5-Year Estimates. http://www.bostonplans.org/getattachment/36c03693-2a54-4fec-8b64-b130c8a509e3/
Bowen, J. L., Baillie, C. J., Grabowski, J. H., Hughes, A. R., Scyphers, S. B., Gilbert, K. R., Gorney, S.G., Selvin, J., & Geigley, K. A. (2019). Boston Harbor, Boston, Massachusetts, USA: Transformation from ‘the harbor of shame’ to a vibrant coastal resource. Regional Studies in Marine Science, 25, 10082. https://doi.org/10.1016/j.rsma.2018.100482.
Central Intelligence Agency. (2018, February 1). The World Factbook: United States. https://www.cia.gov/library/publications/the-world-factbook/geos/us.html.
FloodMap, (2020). Boston ,US Elevation Map. FloodMap. https://www.floodmap.net/Elevation/ElevationMap/?gi=4930956
Gellerman, B. (2019, June 4th). New England’s Electric Power Grid is Undergoing a Transformation. WBUR: Earthwhile. https://www.wbur.org/earthwhile/2019/06/04/region-energy-future-climate-change
Hermann, A., Luberoff, D., & McCue, D. (2019). Mapping over two decades of neighborhood change in the Boston Metropolitan Area. Joint Center for Housing Studies of Harvard University. https://www.jchs.harvard.edu/research-areas/research-briefs/mapping-over-two-decades-neighborhood-change-boston-metropolitan-area
Kirshen, P., Ruth, M., & Anderson W. (2008). Interdependencies of urban climate change impacts and adaptation strategies: a case study of Metropolitan Boston USA. Climatic Change, 86, 105-122. https://doi.org/10.1007/s10584-007-9252-5
Leventhal, N. B. (2017, October 31). Past Exhibition Who We Are: Boston Immigration Then and Now. Norman B. Leventhal Map & Education Center at the Boston Library, https://collections.leventhalmap.org/exhibits/19.
Lima, A., Melnik, M., Perkins, G.W., Blake, N.D., & Borella, N.M. (2011). The largest employers in the city of Boston. Boston Redevelopment Authority. http://www.bostonplans.org/getattachment/b9e87163-0b16-44ea-90cd-d42a847b93c9
Loh, P., & Agyeman, J. (2019). Urban food sharing and the emerging Boston food solidarity economy. Geoforum, 99, 213-222. https://doi.org/10.1016/j.geoforum.2018.08.017
Mason, B. (2017, June 13). How Boston made itself bigger. National Geographic. Retrieved from https://www.nationalgeographic.com/news/2017/06/Boston-landfill-maps-history/#close
Mufson, S. (2020, February 19). Boston harbor brings ashore a new enemy: Rising seas. The Washington Post. https://www.washingtonpost.com/climate-solutions/2020/02/19/boston-prepares-rising-seas-climate-change/?arc404=true.
National Park Service. (2015, February 26). Education Themes: Island Ecosystems. Retrieved from https://www.nps.gov/boha/learn/education/education-theme4.htm
Suarez, P., Anderson, W., Mahal, V., & Lakshmanan, T.R. (2005). Impacts of flooding and climate change on urban transportation: A systemwide performance assessment of the Boston Metro Area. Transportation Research Part D: Transport and Environment, 10 (3), 231-244. https://doi.org/10.1016/j.trd.2005.04.007
U.S. Census Bureau. (2019). Quick Facts: Boston City, Massachusetts. U.S. Department of Commerce. https://www.census.gov/quickfacts/bostoncitymassachusetts
Walsh, M. J. (2017, November 22). Reducing emissions – 2019 Climate Action Plan. City of Boston. https://www.boston.gov/environment-and-energy/reducing-emissions.
