4
By Gabriel Espinosa and Daniel Shea
Abstract
The durability of bio-organisms has allowed for their persistence on Earth for over 3.5 billion years. As our planet has changed over time, so has life, creating a cyclic ebb and flow of resources throughout various living and non-living environments. The evolution and adaptation to climatic and ecological differences over time explains why all species on Earth inhabit specific regions that fit their developmental needs. The stability of Earth systems are now under threat as anthropogenic climate change increases the atmospheric concentration of greenhouse gases at a quicker rate than can naturally be extracted. Consequently, life within our planet’s biosphere has been forced to adapt to rapid changes in their environments. What is responsible for our current climate emergency and what will survive its wake?
A Changing Climate on the Biosphere
The biosphere is the area of Earth known for supporting life in the atmosphere, hydrosphere, and the geosphere. The interactions between these systems subdivisions allow life to flourish on this planet. The hydrologic cycle is critical to life as it describes the movement of water through the planet, starting in liquid bodies such as our oceans, then evaporating into the atmosphere from the presence of heat and light, and finally raining down upon the surface, repeating the cycle again. This motion of the ocean brings water to plants and animals while also recycling nutrients across various ecosystems. Biogeochemical cycles such as the carbon cycle continue to describe the movement of inorganic compounds between organisms and the atmosphere, hydrosphere, and geosphere. When discussing climate change, the carbon cycle immediately takes center stage as it demonstrates how carbon dioxide in our atmosphere makes its way into our oceans and forests as a closed loop (Schwartz, 2014). Problems arise when more carbon is added to the system than can be naturally cycled out.
As most know by now, the climate is changing. Most notably, the average global temperature of Earth is increasing at a rapid pace (Figure 1). While likely definitive proof for most, there are other key indicators of our changing climate that deviate from the standard temperature model.
The oceans of Earth cover roughly 70% of the planet and act as a critical component of the carbon cycle, absorbing CO2 from the atmosphere. However, the more carbon the oceans take in, the more acidic it becomes. When carbon dioxide dissolves in ocean waters it reacts with water (H2O) to form carbonic acid (H2CO3), lowering the pH and increasing the acidity of the water. In just 24 years, the oceans have gone from an average pH of 8.12 to 8.07 (Caldeira et al., 2007). This is a small, yet consequential change, making ocean acidity a key indicator of climate change.
Nearly 68% of freshwater on Earth is held in ice, whether it takes the form of Arctic and Antarctic ice sheets or mountain glaciers, a resource vital to the survival of humankind and other species alike is melting away. In the last 16 years alone, 5,000 gigatons of polar ice has melted, enough water to fill 400,000 Olympic swimming pools. This rapid rate of ice melt has contributed to an average sea level rise of three-fifths of an inch per decade since the 1880s. Given the accelerating rate of global temperature rises in the past few years, this rate has increased to nearly one inch of sea level rise per decade (EPA, 2020a).
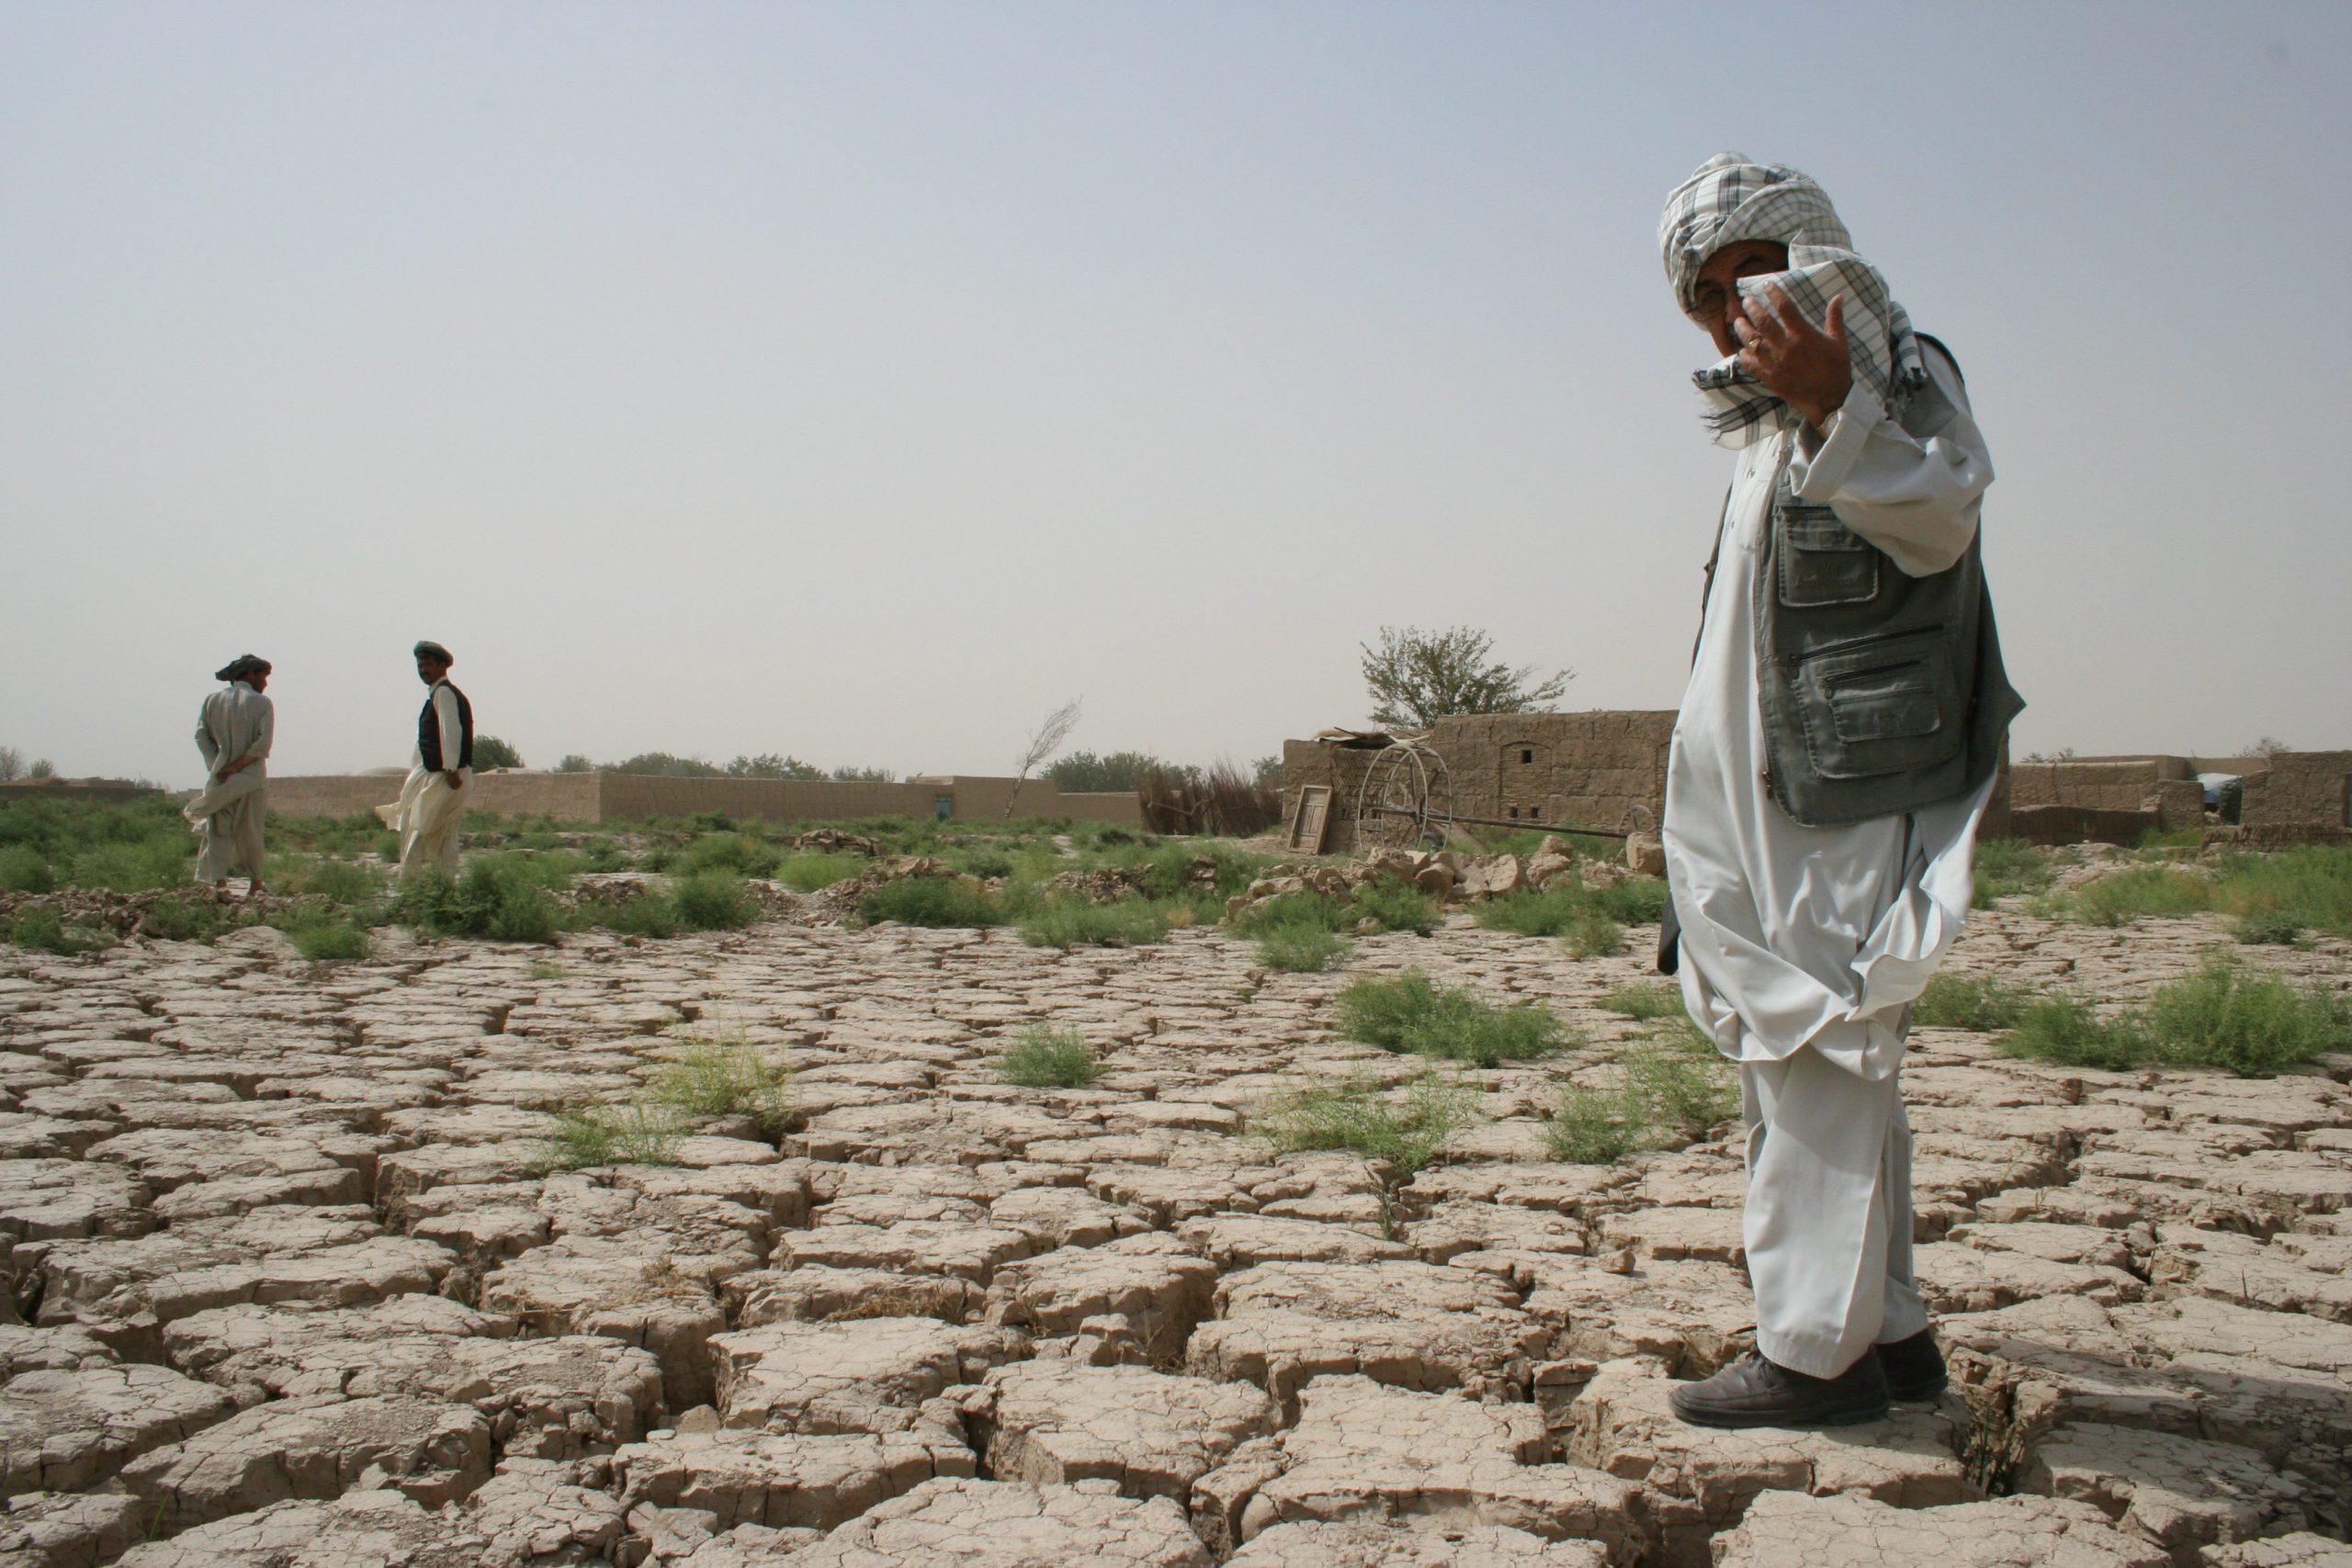
The ecosystems of our planet are the cradles that nurture life, representing diverse geography, plant, and animal species. Over millennia these species have adapted to depend on each other for the necessities of life, creating a stable biotic system. Our changing climate has slowly been disrupting these fine balances, forcing a quick shift in the life an environment can sustain (Figure 2). Various climate models created by scientists at the California Institute of Technology exhibit a global shift in up to 40% of ecosystems such as forests and grasslands to more desert like conditions (Buis, 2011). These consequences are already underway in 168 countries as the phenomena of desertification strips fertile land of its nutrients turning once lush grasslands into arid wasteland (King, 2013).
At first glance it may appear that the changes in average temperature are inconsequential when compared to the massive scale of the planet. However, the ecosystems of Earth have adapted within a range of variance centered around global averages. Within their habitats, plants and animals can survive the natural fluctuations in weather and resource conditions. Climate change has shifted averages of nearly every environmental normality, moving the system out of equilibrium. (Wong, 2015) One may argue that the planet has experienced extreme climate changes in the past and how species adapt over time. While accurate, such changes took place over a duration of millions of years whereas anthropogenic climate change has irreversibly altered the planet in just a few hundred years, not biding enough time for natural systems to adjust.
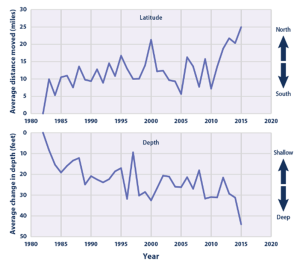
As ecosystems move and disappear their inhabitants are forced to adjust with them, creating an interesting metric to observe when evaluating climate change regarding biological distribution. On average, marine life has been moving to deeper and northward waters, two regions that can be associated with cooler average temperatures (Figure 3). Similar trends can be observed in bird migration, which has also shifted further north. This means birds are not traveling as far south during winter migration in order to stay in their preferred temperature range (Travis, 2003). Given the rigidity of biological systems such as migratory patterns, investigating their changes can provide a useful insight into our changing world. The warming climate has also allowed for some invasive species of plants and animals to expand outside their typical range into different ecosystems, disrupting natural habitat balance. An example of this would be boreal forests which span the northernmost regions of the planet, where trees have begun expanding coverage into the arctic tundra, disrupting indigenous animal habitat (EPA, 2020b).
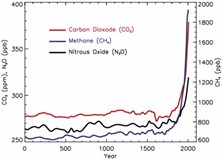
Climate change can be seen across the globe through both living and non-living systems. However, it is unknown exactly who or what is driving these rapid changes to our planet’s fragile environments. In short, all evidence points to the unfortunate truth that climate change is anthropogenic, meaning caused by humans. Since the late 1700s, civilizations around the globe have been burning fossil fuels at an unprecedented rate as societies industrialize. Industrial practices and energy production account for roughly 46% of total greenhouse gas emissions (Dean et al., 2018), the result of burning carbon-based fuels. As industry expanded so did the global population, from only 1 billion in 1800 to now over 7 billion, leading to the industrialization of agriculture to feed the growing populous. The expansion of factory farms in the mid-1900s saw the increase in global livestock populations by nearly 300%, subsequently accelerating the production of the greenhouse gas methane, a byproduct of livestock cultivation. Figure 4 shows the increase of methane (CH4) in the Earth’s atmosphere is due to livestock production, as it accounts for roughly 30% of today’s atmospheric makeup of methane (Smith et al., 2009).
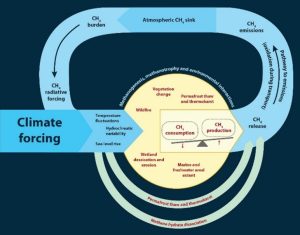
Greenhouse gases in our atmosphere absorb infrared light radiated from our planet’s surface and originating from the sun, thus trapping heat that would otherwise be able to escape into space. The heating of our planet has started affecting our day to day lives, with stronger and more severe weather patterns, hotter summers, and cooler winters. As seen in Figure 5, a positive feedback loop has formed due to increased greenhouse gas concentrations. The increase in greenhouse gas emissions results in severe wildfires and causes ice melt to release high quantities of stored carbon.
The effects of climate change on ecosystems is extensive and ever growing. The greatest driving force of species extinction and endangerment is habitat loss. The Amazon rainforest is home to some of the greatest biodiversity on the planet. Unfortunately, due to the high agricultural productivity of the region, over 20% of forest land has been burned to make room for farmland since 1970. Scientists predict at least 38 species indigenous to the Amazon will go extinct by 2022 as a result (Sommer, 2020). However, habitat loss is not restricted to direct human land intervention such as urbanization and deforestation.
In the marine realm, ocean acidification has devastated coral reef populations while decreased temperature variability due to ice melt has resulted in less ocean nutrient circulation and cold-water upwelling. This means many surface nutrients are sinking deeper into oceans and out of the range of shallow water microorganisms like plankton, which produce almost 85% of the oxygen in our atmosphere and act as the base of the oceanic food web (Moore, 2018). The survival of all living organisms on the planet is dependent on the trillions of microorganisms in the oceans. The consequences of our changing planet will put great survival pressures on these species and ecosystems, making their way through the food chain and eventually to the homes of billions of humans alike.
References
Bollasina, M. A., Ming, Y., & Ramaswamy, V. (2011). Anthropogenic aerosols and the weakening of the South Asian summer monsoon. Science, 334(6055), 502-505. https://doi.org/10.1126/science.1204994
Buis. A. (2011, December 13). Climate change may bring big ecosystem changes. NASA Global Climate Change: Vital Signs of the Planet. https://climate.nasa.gov/news/645/climate- change-may-bring-big-ecosystem-changes/
Cao, L., Caldeira, K., & Jain, A. K. (2007). Effects of carbon dioxide and climate change on ocean acidification and carbonate mineral saturation. Geophysical Research Letters, 34(5), 1-5. https://doi.org/10.1029/2006GL028605
Dean, J. F., Middelburg, J. K., Röckmann, T., Aerts, R., Blauw, L. G., Egger, M., Jetten, M. S. M., de Jong, A. E. E., Meisel, O. H., Rasigraf, O., Slomp, C. P., in’t Zandt, M. H., & Dolman, A .J. (2018). Methane feedbacks to the global climate system in a warmer world. Geophysical Research Letters, 56(1), 207-250. https://doi.org/10.1002/2017RG000559
, R. (2007). Changes in atmospheric constituents and in radiative forcing. In , Climate Change 2007: The Physical Science Basis. Contribution of Working Group I to the Fourth Assessment Report (AR4) of the Intergovernmental Panel on Climate Change. Cambridge University Press
King, E. (2013, April 19). Desertification crisis affecting 168 countries worldwide, study shows. United Nations University: Our World. https://ourworld.unu.edu/en/desertification-crisis-affecting-168-countries-worldwide- study-shows
Lindsey, R. (2018, September 4). Did global warming stop in 1998?. U.S. National Ocean and Atmospheric Administration. https://www.climate.gov/news-features/climate-qa/did-global-warming-stop-1998
McGrane, S. J., Allan, G. J., & Roy, G. (2018). Water as an economic resource and the impacts of climate change on the hydrosphere, regional economies and Scotland. Fraser of Allander Economic Commentary, 42(4), 53-74. https://strathprints.strath.ac.uk/66335/1/FEC_42_4_2018_McGraneSJAllanGJRoyG.pdf
Moore, J. K. (2018, April 19). Climate change could alter ocean food chains, leading to far fewer fish in the sea. The Conversation. https://theconversation.com/climate-change-could-alter-ocean-food-chains-leading-to-far-fewer-fish-in-the-sea-93114
Schwartz, M. (2014, June 30). Ecosystem shift: How global climate change is reshaping the biosphere. Harvard: Science in the News. https://sitn.hms.harvard.edu/flash/2014/ecosystem-shift-how-global-climate-change-is-reshaping-the-biosphere/
Smith, J. B., Schneider, S. H., Oppenheimer, M., Yohe, G. W., Hare, W., Mastrandrea, M. D., Patwardhan, A., Burton, I., Corfee-Morlot, J., Magadza, C. H. D., Füssel, H. M., Pittock, A. B., Suarez, A., & van Ypersele, J. P. (2009). Assessing dangerous climate change through an update of the Intergovernmental Panel on Climate Change (IPCC) “reasons for concern”. PNAS, 106(11), 4133-4137. https://doi.org/10.1073/pnas.0812355106
Sommer, L. (2020, April 30). Antarctica And Greenland are losing thousands of gigatons of ice — That’s a lot. NPR: Science. https://www.npr.org/2020/04/30/848398472/antarctica-and-greenland-are-losing- thousands-of-gigatons-of-ice-thats-a-lot
Tan, V. (2012). The drought in Jawzjan province of northern Afghanistan has made the land unfarmable [Photograph]. Flickr. https://www.flickr.com/photos/acnurlasamericas/7204726548/
Travis, J. M. J. (2003). Climate change and habitat destruction: A deadly anthropogenic cocktail. Proceedings of The Royal Society B, 270(1514), 467–473. https://doi.org/10.1098/rspb.2002.2246
U.S Environmental Protection Agency [EPA], (2020a). Climate change indicators in the United States. U.S. Environmental Protection Agency. https://www.epa.gov/climate-indicators
U.S Environmental Protection Agency [EPA], (2020b). Climate impacts on ecosystems. U.S. Environmental Protection Agency. https://19january2017snapshot.epa.gov/climate-impacts/climate-impacts-ecosystems_.html
Wong, K. V. (2015). Climate change. Momentum Press. http://www.momentumpress.net/books/climate-change
seasonal movement from one region to another
caused by humans
