8
By Jack Hanlon, Daniel Shea, Nora Smith
Introduction
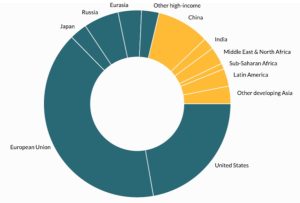
Climate change is a relatively new field within the realm of science, and recent innovative studies often reveal new causes, drivers, and impacts of the shifting biosphere. One of the most dangerous and greatly ignored societal impacts of climate change is inequality, which strikes in a multitude of ways, such as unequal contributions to climate change’s driving factors, wealth gaps, and differences in suffering. The driving factors that are disproportionately fueled by countries are highlighted by greenhouse gas emissions, but lesser factors such as plastic pollution, illegal dumping, and deforestation add up over time. Hyper-industrialized countries or regions such as the United States, China, and the European Union have accounted for over 70% of climate changing causes since the tracking of Earth’s health began (Figure 1). This disparity also highlights both the extreme differences in suffering and rapidly growing wealth gaps that poorer countries experience (Figures 3, 4).
These conditions are very often overlooked, and only recently gained attention due to the 2015 Paris Agreement’s covering of poorer nations and their lack of ability to respond to significant weather pattern and landscape shifts. A United Nations approved paper published later explained that “disadvantaged groups may not be able to afford such insurance and thus have to absorb the entire loss, leading to greater loss of their asset position” (Islam & Winkel, 2017). One such example is Mexico, which contributes only 1.5% of total global carbon emissions but is affected more than other Northern American countries, such as Canada or the United States. The country’s National Institute of Ecology reports that more than half of Mexican states experience significant marginality and already suffered from climate-related risks, all of which has led to a loss of assets (Santelices Spikin & Rojas Hernández, 2016). Disadvantaged countries such as Mexico experience the greatest suffering as they are the most likely to deal with climate hazards, while also lacking the means to recover effectively. These instances of inequality do not stop at Mexico, or with the highlighted factors, as a plethora of other impacts exist within communities across the globe.
Impacts
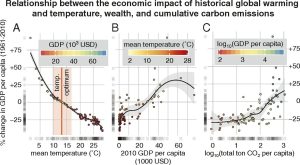
Since the significance of these impacts largely comes from where the changes in climate are most strongly felt, it becomes easier to notice when the data connects. Trends in climate change, particularly trends in global warming, have been shown to correlate with trends in gross domestic product, or GDP. Notably, the negative impacts from climate change disproportionately impact countries with lower CO2 emissions per capita. Compared to a model without any emission-based change in global temperature, countries with less than 10 tons of carbon dioxide per capita suffered a 27% loss in GDP, while countries with 300+ tons of carbon dioxide per capita experienced a 25% growth (Diffenbaugh & Burke, 2019; Figure 2). This economic loss hits countries that already do not have the resources to properly deal with climate change, so an unfortunate cycle of financial loss is created: climate change affects poorer countries more as they cannot afford to deal with it, making them even poorer.
Climate change may affect GDP, but there are other impacts that are not as well studied, such as increased pressure on poorer women. A 2014 article looked at the connection between climate change and West African migration patterns and found that climate change was indirectly impacting the quality of life for women in these areas. Since women in rural Africa already walk miles to collect water, dryer climates caused by climate change require them to have to travel longer distances to find wells and springs. This puts them not only in danger of overheating, but in danger of physical violence as they walk for hours alone (Abebe, 2014). Additionally, when tribes choose to migrate to cooler, wetter regions near mountains, women face a difficult choice. Those who choose to stay in their old homes must learn to fill traditional male roles, but those who choose to leave often lack the resources to join the formal sector. This once again puts them at risk for physical and sexual abuse (Abebe, 2014). On a more local scale, there is evidence that changing weather patterns impact poorer communities significantly. Low-income households often live in areas more susceptible to storm damage and, because of their financial situations, many are unable to relocate. Hurricanes devastate these areas, with each significant storm raising local poverty rates by over one percent (Krause & Reeves, 2017). Because the effects of climate change are so wide-spread, and because the definition of inequality is so dynamic, it is difficult to predict what exactly the future could hold in terms of impact. However, we can continue to look at how these impacts occur.
The biosphere is the main climate system that is suffering from results of inequality, since the biosphere is the climate system in which inequality originates. The biosphere focuses on organisms that have niches in various climate systems, such as the hydrosphere, atmosphere, and lithosphere. An increase in human inequality has direct effects on the decrease in biodiversity around Earth through habitat destruction and highly localized human pressures, due to the vulnerability of biodiversity (Hamann et al., 2018). In fact, positive feedback loops between climate change, land-use planning, ocean acidification, and the nitrogen cycle have caused biodiversity loss to reach a rate 1,000 times greater than any point in recorded history. Because of this, nearly one million species face extinction (Pimm et al., 2014). Countries with heavier greenhouse gas emissions, such as Great Britain or the United States, use inequalities in industrialization and emissions as justification for their large contribution toward harming the atmosphere.
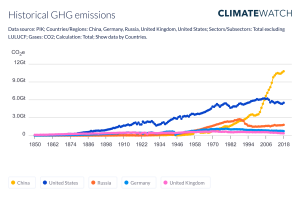
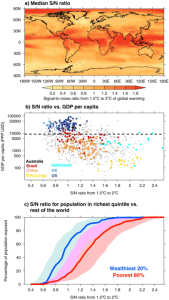
A glance into the past is necessary for understanding emissions fully, since emitted fossil fuels take roughly a century to start showing drastic results. During the industrial revolution, wealthy business owners started using steam engines to power mills, boats, and most importantly, trains. These actions released greenhouse gases into the atmosphere, trapping sunlight within the atmosphere, and allowing Earth to warm over time as the gases stay trapped for centuries. As one can observe in Figure 4, the main countries contributing are labeled as “powerhouse countries”, where the wealthiest 20% of the world live. Many of these countries are also in non-tropical regions, where atmospheric changes such as increased signal-to-noise ratios are felt to a lesser extent, highlighting a gap in regional inequality due to atmospheric shifts. Despite these historical changes and destruction of the biosphere, there are measures being developed to fix historical mistakes.
Just as efforts are being taken to reduce the severity of warming effects and reverse climate change, strides have recently been taken to try mitigating the inequalities created. The predominant effort is the Paris Agreement, a written agreement stating that all countries signed on pledge to reduce their greenhouse gas emissions, take responsibility for contributions, and for “recognizing the specific needs and special circumstances of developing country Parties, especially those that are particularly vulnerable to the adverse effects of climate change” (United Nations, 2015, p. 3). This Agreement was the first government convention that recognized inequalities between countries since the Rio Earth Summit in 1992. Having this idea placed within the document is a large step forward, as it brings the necessary attention to the grave situations suffering countries have been put in. The Paris Agreement also covers a reduced goal temperature that seeks to keep warming under 2ºC by aiming for 1.5ºC instead, as it would “significantly reduce the risks and impacts of climate change” (United Nations, 2015), thus lessening the burden on all affected states. One issue with the Agreement though is a lack of binding requirement for each country to reduce their emissions and rather a general call to action for the signees to try their best, which may backfire. While there are a couple of viable, large scale efforts being made to save the planet, there are also a multitude of smaller regions that are striving to save themselves.
Changes on a local level are important for making large impacts, and resilient cities are a significant adaptation. Resilient cities are cities that are taking measures to ensure protection from economic, societal, and environmental damage caused by climate shifts. Cities are constantly updating how they regulate industry and foster economic success while maintaining human-made and natural assets. In addition, each upholds a standard for the basic needs of their community members. This is done by “enable[ing] individuals, communities, institutions and businesses to participate in the definition and execution of policies” (Gemeren, 2017), ensuring that safe policies can be put in place regarding climate change. Not only does this protect local communities, it sets precedent for how larger-scale organizations (like governments) should approach the human issues surrounding climate change. Policies similar to those in resilient cities can ensure a reduction in contribution to climate change and promote climate equality over regions and cities, relieving the disadvantaged of their climate-based burdens and inequalities. On a larger scale, resilient cities set standards on what green living can look like. They prove the possibility of a cleaner world with just as much prosperity as a carbon-intensive one. As the world comes together to end climate change, humans must question if there a scenario in which the inequalities formed in its wake are able to be torn down with it.
References
Abebe, M. A. (2014). Climate change, gender inequality and migration in East Africa. Washington Journal of Environmental Law and Policy, 4(1), 104-140. https://digitalcommons.law.uw.edu/wjelp/vol4/iss1/6
Ciplet, K., Roberts, J. T., & Khan, M. R. (2015). Power in a Warming World: The Global Politics of Climate Change and The Remaking of Environmental Inequality. The MIT Press.
Delgado-Ramos, C. (2015). Inequality and Climate Change: Perspectives from the South. Codesria. https://doi.org/10.2307/j.ctvh8r0w3
Diffenbaugh, N. S., & Burke, M. (2019). Global warming has increased global economic inequality. Proceedings of the National Academy of Sciences, 116(20), 9808-9813. https://doi.org/10.1073/pnas.1816020116
Gemeren, A. (2017, August 16). Smart cities or resilient cities. Does it make any difference? Smart City Hub. https://smartcityhub.com/collaborative-city/smart-cities-resilient-cities-make-difference/.
Hamann, M., Berry, K., Chaigneau, T., Curry, T., Heilmayr, R., Henriksson, P. J. G., Hentati-Sundberg, J., Jina, A., Lindkvist, E., Lopez-Maldonado, Y., Nieminen, E., Piaggio, M., Qiu, J., Rocha, J. C., Schill, C., Shepon, A., Tilman, A. R., van den Bijgaart, I., & Wu, T. (2018). Inequality and the Biosphere. Annual Review of Environment and Resources, 43(1), 61-83. https://doi.org/10.1146/annurev-environ-102017-025949
Islam, S. N., & Winkel, J. (2017, October). Climate change and social inequality. World Economic and Social Survey. https://www.un.org/esa/desa/papers/2017/wp152_2017.pdf.
King, A. D., & Harrington, L. J. (2018). The inequality of climate change from 1.5 to 2°C of global warming. Geophysical Research Letters, 45(10), 5030-5033. https://doi.org/10.1029/2018GL078430
Krause, E., & Reeves, R. (2017, November 03). Hurricanes hit the poor the hardest. Brookings. Retrieved November 18, 2020, from https://www.brookings.edu/blog/social-mobility-memos/2017/09/18/hurricanes-hit-the-poor-the-hardest/
Pimm, S. L., Jenkins, C. N., Abell, R., Brooks, T. M., Gittleman, J. L., Joppa, L. N., Raven, P. H., Roberts, C. M., & Sexton, J. O. (2014). The biodiversity of species and their rates of extinction, distribution, and protection. Science, 344(6187), 1246752. https://doi.org/10.1126/science.1246752
Santelices Spikin, A., & Rojas Hernández J. (2016). Climate Change in Latin America: Inequality, Conflict, and Social Movements of Adaptation. Latin American Perspectives, 43(4), 4-11. https://doi.org/10.1177/0094582X16644916
Tschakert, P., van Oort, B., St. Clair, A. L., & LaMadrid, A. (2013). Inequality and transformation analyses: A complementary lens for addressing vulnerability to climate change. Climate and Development, 5(4), 340-350. https://doi.org/10.1080/17565529.2013.828583
United Nations. (2015, December 12). The Paris Agreement. United Nations. https://unfccc.int/process-and-meetings/the-paris-agreement/the-paris-agreement.
Figures
Busch, J. (2015, August 18). Climate change and development in three charts. Center For Global Development. https://www.cgdev.org/blog/climate-change-and-development-three-charts.
Diffenbaugh, N. S., & Burke, M. (2019). Global warming has increased global economic inequality. Proceedings of the National Academy of Sciences, 116(20), 9808-9813. https://doi.org/10.1073/pnas.1816020116
Gütschow, J., Loiuse, J., & Gieseke, R. (2021). The PRIMAP-hist national historical emissions time series (1850-2018). V. 2.0. GFZ Data Services. https://doi.org/10.5880/PIK.2019.001
King, A. D., & Harrington, L. J. (2018). The inequality of climate change from 1.5 to 2°C of global warming. Geophysical Research Letters. 45(10), 5030-5033. https://doi.org/10.1029/2018GL078430
