1
By Elizabeth Dalberg, Katherine Miller, and Nora Smith
Abstract
The atmosphere, which is primarily composed of nitrogen and oxygen, is one of the most influential climate systems on Earth. As the concentration of certain key gases in the atmosphere has shifted over time, the importance of the atmosphere has become more apparent. These small shifts in gases like CO₂ and methane have significantly worsened the greenhouse effect and have led to some major changes in Earth’s climate. Some major consequences of this shift have been the increased melting of sea ice, increased ocean acidity, worsening of natural disasters like hurricanes and wildfires, and the reduction of air quality in heavily populated areas. How and why has such a small shift in atmospheric concentration been able to cause so much devastation and how will it continue to do so?
The Atmosphere
The atmosphere is the climate system made up of the gas layer that surrounds our planet, which primarily contains oxygen, nitrogen, argon, carbon dioxide, helium, and neon (Boudreau et al., 2011; Figure 1).
The atmospheric concentration of gases present in today’s atmosphere is a direct result of Earth’s history. Scientists believe that much of the nitrogen and many trace gases in our atmosphere is the result of early volcanic eruptions; furthermore, it is hypothesized that free oxygen (O₂) was mainly created by early organisms during photosynthesis (Boudreau et al., 2011). The atmosphere shields Earth from much of the Sun’s UV radiation, which is harmful to humans in large amounts, while allowing most of the Sun’s rays and solar heat to pass through. When the solar heat and Sun’s rays pass through the atmosphere, it traps water vapor in the atmosphere. Water vapor (an important natural greenhouse gas) warms the Earth and keeps it habitable for plants and animals (Buis, 2019).
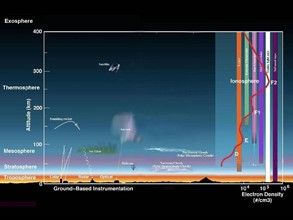
The layers of the atmosphere are the troposphere, stratosphere, mesosphere, thermosphere, and exosphere (Boudreau et al., 2011; Figure 2). The troposphere, the closest layer to the surface, holds water vapor and develops the weather, while the stratosphere contains the ozone which shields Earth from UV radiation. The mesosphere is where we see shooting stars, but is the least known component of the atmosphere. The ionosphere holds radio waves and displays the Northern and Southern Light auroras. Next is the thermosphere, which holds oxygen, helium, and hydrogen gas that absorb X-ray and UV radiation. Lastly, we have the exosphere, where solar storms happen and where weather satellites orbit. All of Earth’s atmospheric layers play an important role in understanding climate change.
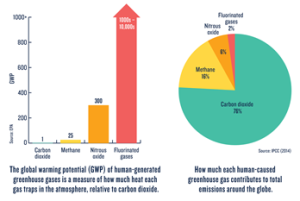
The easiest way to imagine the atmosphere is as a blanket surrounding the Earth as it orbits through the freezing cold of space. Inside the blanket are many types of fibers: cotton, wool, polyester, etc. Under normal circumstances, the heat trapped by the blanket is enough to keep Earth warm without overheating. However, what happens as the fiber composition changes? As the blanket gains more and more heat-trapping fibers relative to others, the temperature inside the blanket goes up. This increased heat causes what is known as the “greenhouse effect.” However, without at least some fibers that keep the blanket warm, Earth would not be able to sustain life as we know it. The planet underneath would be too cold. Therefore the issue is not the greenhouse gases themselves, but the increased concentration of them causing the greenhouse effect to worsen (Figure 3).
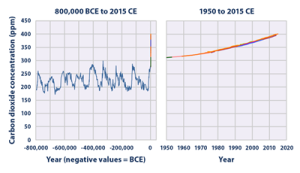
The atmosphere’s stability keeps the Earth habitable, but if the atmosphere’s composition changes too much it could result in drastic changes in temperature and affect all life on Earth. Before the industrial revolution, CO2 concentrations generally fluctuated between 200 and 250 ppm (parts per million), with the levels directly before the Industrial Revolution averaging at 280 ppm as seen in Figure 4 (EPA, 2016). During the Industrial Revolution humans began burning large amounts of fossil fuels like oil and gas, and as the global population increased there was also an increase in livestock like cattle to feed the growing population. The post-industrial world has experienced a sharp increase in concentrations of greenhouse gases, including carbon monoxide, ammonia, and ozone. Figure 5 depicts that, in recent years, the atmospheric concentration of CO2 has risen to 409.8 ± 0.1 ppm with no signs of slowing down. Atmospheric concentration of CO2 is predicted to exceed 900 ppm by the end of this century (Lindsey, 2020).
A key factor in keeping the atmosphere stable is hydroxide, also known as OH. The OH ion binds with and removes pollutants and greenhouse gases from the atmosphere. As greenhouse gases increase, atmospheric hydroxide will be consumed at a more rapid pace than it is produced. This will result in decreased air quality, higher concentrations of other greenhouse gases, and higher concentrations of ozone in the lower atmosphere (where ozone is harmful, not helpful). Changes in the atmosphere are causing ripples which are being observed in many ecosystems. For example, the water vapor levels in the Arctic are rising and its atmosphere is becoming moist, increasing warming and exacerbating the melting of sea ice. Parts of northern India and eastern China are seeing an increase of atmospheric ammonia, which is decreasing their air quality. To see how the change in atmosphere is affecting the climate we need to look at the factors of how the Earth and climate behave, including the ocean, land surface, biosphere, and the cryosphere (Dessler & Parson, 2020).
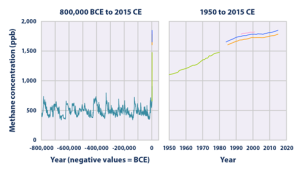
Before the major growth of large human settlements, starting around the last millennia BCE and getting larger from there, methane concentrations in the atmosphere fluctuated around an average of 500 ppb. Methane is the simplest hydrocarbon, made up of four hydrogens and one carbon. The increased concentration of methane from human activities is due to leaks of natural gas systems, livestock, decomposition of landfills, and is a major component in greenhouse gases. Methane is also emitted through natural sources such as wetlands, oceans, volcanoes, and wildfires. Methane has a lower residence time, or lifespan, in the atmosphere, but is more efficient in trapping radiation than carbon dioxide (EPA, 2020). As the human population grew, so did the concentration of methane in the atmosphere with the pre-industrial revolution concentrations holding steady at around 700 ppb. Methane concentrations have continued to rise with the atmospheric concentration of methane as of 2015 reaching approximately 1,800 ppb (EPA, 2020).
Climate indicators are a set of parameters that describe climate change. The parameters are composed of key information to the most relevant factors of climate change, which are temperature and energy, atmospheric composition, ocean and water, as well as the cryosphere (GCOS, 2018). One climate indicator, atmospheric circulation, has shifted significantly in recent years. As time has passed, the poleward center for atmospheric circulation patterns has shifted further north (Zhang et al., 2008). This means that the center of action where storms and warm winds originate in the tropics end up further into the Arctic Circle, bringing more warm air with them. This shift could be caused by increases in greenhouse gas concentrations, or it could be unrelated. In either case, this shift in atmospheric circulations has led to a concerning increase in the rate of sea ice loss inside the Arctic Circle (Zhang et al., 2008).
A large reason for the severity of atmospheric changes is that many natural processes on Earth affect the various concentrations of the atmosphere. The interactions between the surface of Earth and the atmosphere system, known as the physical surface-atmosphere exchange (Fowler et al., 2009), are incredibly complex and change with the climate. A prominent example of this is the human effect on the nitrogen cycle through intense production and usage of ammonia. The process that produces it, referred to as the Haber-Bosch process, produces ammonia for weaponry as well as fertilizers. Because of this method being accessible and relatively cheap, the number of people able to be sustained by 100 acres of farmland has grown from 1.9 to 4.3 from 1908 to 2008 (Erisman et al., 2008, 637). This means that more people were able to be born and fed, allowing for the people born during the population boom to survive and reproduce. Recent estimates place the percentage of the population supported by the creation of these soils at 48%, meaning almost half of the world’s human population is only able to be alive because of these fertilizers (Erisman et al., 2008, 637). Higher population density, in general, correlates with higher carbon dioxide outputs (Kennedy, 2000). In addition, these fertilizers are not efficient. Only about 17% of the ammonia used in these processes enters our food, while the rest of it escapes into the atmosphere and surrounding ponds and waterways. From there, the nitrogen changes the delicate balance of soils, increasing acidification and decreasing biodiversity. The waste also decreases ozone in the stratosphere and increases it in the troposphere (Erisman et al., 2008, 637-638). While additional ammonia and nitric oxide have been playing a role over the past century, it is far from the most influential gas.
Carbon dioxide is the most influential greenhouse gas connected to global warming, largely because of its connection to the increase of water vapor in the atmosphere. A study done in 1979 found that increases in CO2 were directly related to higher levels of moisture in the atmosphere, higher rates of runoff, and more precipitation (Manabe & Wetherald, 1980, pg. 99).
Water vapor is the primary driver of the greenhouse effect, and since increased CO2 puts more water vapor in the atmosphere, CO2 is indirectly the reason for the Earth’s growing temperature. Additionally, CO2 is responsible for ocean acidification, which affects thousands of creatures who rely on a non-acidic ocean to create shells (Riebeek, 2011). In addition, this increase in ocean acidity combined with the warming of the ocean through climate change could result in lower levels of phytoplankton. These creatures consume carbon dioxide in the oceans, removing it from the atmosphere, and as their numbers shrink more carbon remains stuck in the cycle (Riebeek, 2011). This creates a positive feedback loop, in which the creatures die because it is too warm, leading to even warmer oceans.
Our atmosphere has such a strong impact on Earth’s climate. The atmosphere depends on the systems that are connected (land, sea, ice). Our atmosphere encompasses everything on our planet. It holds the oxygen for our lungs and the carbon dioxide for plants’ use in photosynthesis. It keeps us from being overheated or frozen. Every part of our lives and the lives of thousands of creatures are impacted by the atmosphere and its changes.
Bibliography:
Bentz, B. & Klepzig, K. (January 2014). Bark Beetles and Climate Change in the United States. U.S. Department of Agriculture, Forest Service, Climate Change Resource Center. www.fs.usda.gov/ccrc/topics/insect-disturbance/bark-beetles
Boudreau, D., McDaniel, M., Sprout, E., & Turgeon, A. (2011). Atmosphere. National Geographic. Retrieved from
https://www.nationalgeographic.org/encyclopedia/atmosphere/
Buis, A. (2019, October 2). The atmosphere: Earth’s security blanket. NASA. Retrieved from https://climate.nasa.gov/news/2914/the-atmosphere-earths-security-blanket/
Buis, A. (2019, October 23). The atmosphere: Fresh insights on air quality, ozone, and climate. NASA. Retrieved from https://climate.nasa.gov/news/2917/the-atmosphere-fresh-insights-on-air-quality-ozone-and-climate/
Buis, A. (2019, October 30). The atmosphere: Keeping a weather eye on Earth’s climate instabilities. NASA. Retrieved from https://climate.nasa.gov/news/2918/the-atmosphere-keeping-a-weather-eye-on-earths-climate-instabilities/
Dessler, A. E., & Parson, E. A. (2020). Climate and Climate Change: A Scientific Primer. The Science and Politics of Global Climate Change: A Guide to the Debate (3rd ed., pp. 9-26). Cambridge University Press. https://doi.org/10.1017/9781316832158
EPA (Environmental Protection Agency). (2016, April). Climate change indicators: Atmospheric concentration of greenhouse gases. EPA gov. Retrieved October 30, 2020 from https://www.epa.gov/climate-indicators/climate-change-indicators-atmospheric-concentrations-greenhouse-gases
EPA (Environmental Protection Agency). (2020, September 8). Overview of Greenhouse Gases. EPA.gov. Retrieved October 30, 2020 from https://www.epa.gov/ghgemissions/overview-greenhouse-gases
Erisman, J. W., Sutton, M. A., Galloway, J., Klimont, Z., & Winiwarter, W. (2008). How a century of ammonia synthesis changed the world. Nature Geoscience 1(10), 636–639. https://doi.org/10.1038/ngeo325
Fowler, D., Pilegaard, K., Sutton, M., Ambus, P., Raivonen, M., Duyzer, J., Simpson, D., Fagerli, H., Fuzzi, S., Schjoerring, J., Granier, C., Neftel, A., Isaksen, I., Laj, P., Maione, M., Monks, P., Burkhardt, J., Daemmgen, U., Neirynck, J., … Flechard, C. (2009). Atmospheric composition change: Ecosystems–Atmosphere interactions. Atmospheric Environment, 43(33), 5193-5267. https://doi.org/10.1016/j.atmosenv.2009.07.068
GCOS. (2018). Global climate indicators. The Global Climate Observing System (GCOS). Retrieved November 4, 2020 from https://gcos.wmo.int/en/global-climate-indicators
Geospatial World. (2018, August 30). NASA video shows changing levels of CO2. [Video]. YouTube. https://www.youtube.com/watch?v=TrQzbXc6LVE
Kennedy, Jr, B. (2000, November 1). Population and climate change. Population Reference Bureau. Retrieved October 30, 2020, from https://www.prb.org/populationandclimatechange/
Lindsey, R. (2020, August 14). Climate change: Atmospheric carbon dioxide. NOAA, Climate.gov.
Retrieved October 30, 2020, from https://www.climate.gov/news-features/understanding-climate/climate-change-atmospheric-carbon-dioxide
Manabe, S., & Wetherald, R. T. (1980). On the distribution of climate change resulting from an increase in CO2 content of the atmosphere. Journal of the Atmospheric Sciences, 37(1), 99-118. https://doi.org/10.1175/1520-0469(1980)037%3C0099:OTDOCC%3E2.0.CO;2
Riebeek, H. (2011, June 16). The carbon cycle. NASA Earth Observatory. Retrieved October 30, 2020, from https://earthobservatory.nasa.gov/features/CarbonCycle/page1.php
Zhang, X., Sorteberg, A., Zhang, J., Gerdes, R., & Comiso, J. C. (2008). Recent radical shifts of atmospheric circulations and rapid changes in Arctic climate system. Geophysical Research Letters, 35(22), L22701. https://doi.org/10.1029/2008GL035607
Atmospheric residence time is the average time it takes for a molecule to be removed from the atmosphere.
