3
By Keelan Boyle, Jack Hanlon, Alexander Wadsworth, and Gabriel Ward
How the Cryosphere and Lithosphere Effect and are Affecting Climate Change
Abstract
The cryosphere and lithosphere are two of the five systems that make up the biosphere and are comprised of the frozen components of Earth and its crust, respectively. Both components have gone and are currently going through large scale transformations due to climate change, with a plethora of evidence and predictive models showing irreversible damage being inflicted. This transformation can be further understood through the analysis of leading driving factors, and counter measures can be developed in order to prevent further damage from occurring. How can something as simple as ice melting or changing magma flow affect something as significant as global climate? What kind of repercussions and benefits do these changes have on different environmental and social systems?
If your eyes have ever wandered toward the ground, what you happen to be looking at is the lithosphere. The lithosphere is all the mechanically rigid components that make up a planet, also known as the crust and upper mantle. The crust can be divided up into 7 sections called tectonic plates which roughly mirror the outline of the continents. These plates are in constant motion, occasionally grinding against each other, causing earthquakes and volcanic eruptions.
In addition to tectonic plates, the lithosphere can be broken down into two major sections called the continental and oceanic lithosphere. The oceanic portion is much younger than the continental, as magma rises from ridges connected to the mantle and cools rapidly, forming new layers of crust. This new crust is eventually recycled in ocean trenches, where it sits and slowly gets buried by newer crust, creating underwater rock formations. An example of this cycle is shown in Figure 1, where oceanic crust is being recycled through the trench and new continental crust is being formed through volcanoes. There is also a difference between the two in composition, with the oceanic lithosphere being made up of mostly basalts, while the continental lithosphere is made up primarily of igneous and felsic rock. However, this warm, rocky region has an unusual counterpart that plays a large role in it’s formation and changing.
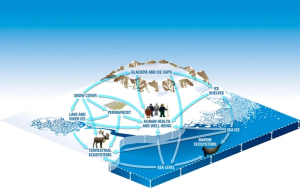
Everyone has seen pictures of a barren tundra, snowy mountain tops, and icebergs. These are parts of what make up the cryosphere, which is comprised of everything on Earth that stays frozen for at least one month throughout the year. The most well-known components of the cryosphere are the Arctic and Antarctic, while other important forms include glaciers, permafrost, icecaps, and snow. Everything that comprises this system contains water and can melt and freeze again, resulting in an ever changing ecosystem. These systems, as shown in Figure 2, impact a wide variety of ecosystems and the wellbeing of humans showing how their existence is vital to life on Earth as we know it.
In latter decades, evidence of a changing cryosphere has been abundant. A decreasing presence can be seen from most aspects of the cryosphere. Significant negative trends in permafrost height have also been measured, most notably in the North Cascade glaciers’ active layer, defined as the upper boundary that thaws periodically. Sites in Russia have additionally recorded an increase in the active layer by 1.7-5.5cm per year (Fountain et al., 2012), suggesting that a larger amount of the permafrost layer is melting every year. An area in New Hampshire has reported a reduction in maximum snow height by 25cm and 21 day drop in average yearly snow coverage over 53 years (Fountain et al., 2012). Sea and lake ice have also taken an impact in the recent decades with an average 3% loss of sea ice per decade and lake ice thinning at a rate of 2cm per year (Fountain et al., 2012). These statistics show a clear decrease in the ice cover and are an indication of a reducing cryosphere.
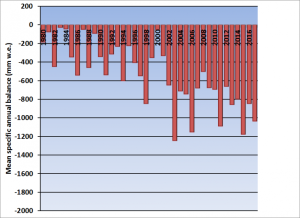
The net mass of a glacier is determined by the difference between the amount of ice that accumulates back onto it and the amount of ice that melts off the glacier, if this net mass is negative then the glacier is deemed to be receding. Measurements of current North Cascade glaciers show that their volume has decreased by 30% since 1984 (Mauri, 2020). This observation is further reinforced by Figure 4, which displays the average mass balance of glaciers around the world. Most of these glaciers are connected to the ocean, meaning that if they melt there would be a significant rise in sea level, nearing 58 meters at its maximum. In recent decades, the ice flow in the Pine Island Glacier terminus has increased from 1.5 km/yr to 5 km/yr, contributing to a 4.5mm sea level rise (Shepherd et al., 2018). The rising sea level is a direct representation of a changing cryosphere because the mass lost from ice turns into the height gained by the oceans.
Proof of a changing lithosphere is more difficult to conceptualize because a rising global temperature would have a minute impact on the Earth’s crust and mantle. However, the climate system can still be influenced indirectly, mainly by the movement and actions of glaciers. As glaciers melt, weight is relieved from the pieces of mantle they lay upon, creating areas of changed elevation allowing new magma flow deep underground. As these regions return to their shape from before glacial depression, magma is brought further to the surface, warming the new volcanic region. It has been found, through a study done in Iceland, that this decrease in pressure can result in changing magma melt rates within the mantle, which can lead to a greater probability of volcanic eruptions (Swindles et al., 2018). In conjunction with the previous statement, the lower pressure can also result in an uplift in tectonic plates and sea level which have been recorded to be as high as 120 meters in the past (Mozie et al., 2014). A rise in the oceanic tectonic plates and the resulting increase in sea level are obvious indications of transforming lithosphere.
To see why changes are occurring within the cryosphere and lithosphere, the driving forces and causes must be identified. It is easy to claim that as global temperatures rise, glaciers, permafrost, and icecaps will melt, so it’s better to. One way the cryosphere keeps the climate regulated is through surface albedo, which is defined as the ratio of radiosity to the irradiance (flux per unit area) received by a surface, or the ratio of sunlight reflected to the sunlight absorbed by Earth. This process is of paramount importance to the globe, as snow and ice reflect massive amounts of heat and energy back into space and span over wide regions of land. On top of global temperatures rising, Bedford (2009) revealed that multiple components of the cryosphere house greenhouse gasses deep beneath their surfaces. This causes the cycle to become an accelerating positive feedback loop, melting the cryosphere, while simultaneously changing the lithosphere.
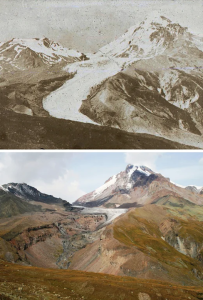
Within the lithosphere, change comes differently than it does with the cryosphere. Exposed regions of lava due to previously mentioned glacial melting, as seen in Figures 3 and 5 can lead to excessive heating of the lithosphere and atmosphere, and contribute to the number of aerosol particles immensely. Paired with the combination of soil disturbance for agricultural purposes as well as mass deforestation, the lithosphere is ever changing and contributing to climate change in horrifying ways (Ostberg et al., 2018). These parts of the biosphere are extremely important to humanity’s current way of life and its certain that with our current path, we’ll lose these systems and cause massive amounts of irreversible damage.
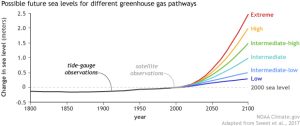
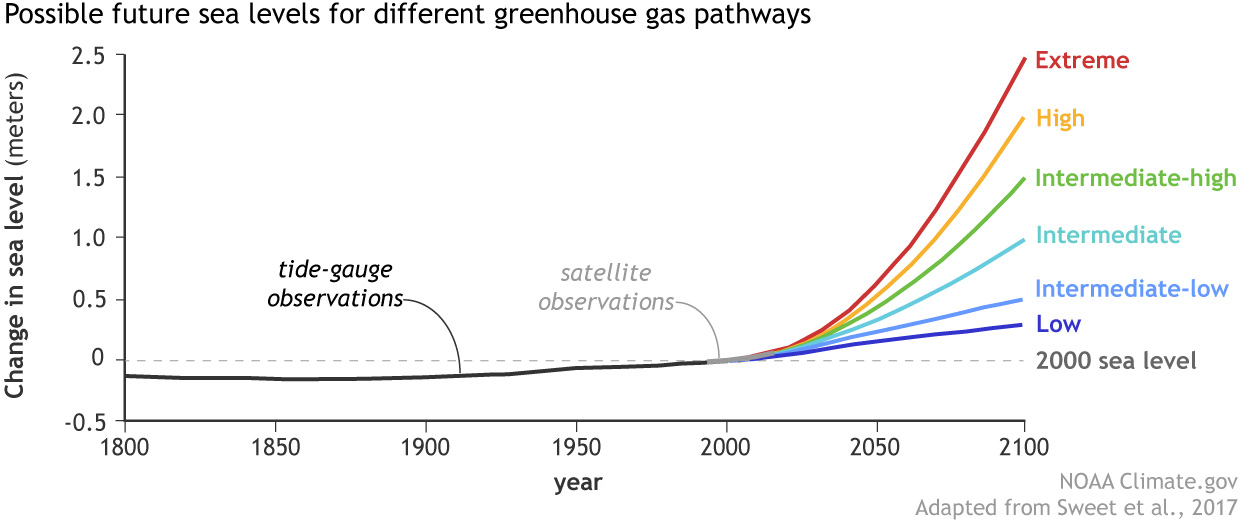
With the Earth changing, what environmental and social systems are affected? Specifically, the melting of the cryosphere can affect ice covered regions, river systems, and coastal lowlands. Melting ice significantly impacts migration patterns, hunting grounds, and the living conditions of numerous species. In fact, the changes brought by the destruction of the cryosphere are occurring more rapidly than some species can adapt to. This applies to humans as well, with human settlements in danger of being flooded due to the possibility of rising sea levels. The damages caused by floods makes it increasingly hard for communities to function due to the cost of repair and protection. Cultural hubs like the Maldives (5 feet average elevation; CIA, 2020), and Venice (3.2 average feet elevation; Bock et al., 2012) are most vulnerable as they are coastal lowlands. Water levels could increase as much as eight feet in the next 100 years, as estimated in Figure 6, meaning specific countries can lose half of their land.
In addition to the sea level rising, the salinity of freshwater ecosystems also increases, wreaking havoc on all water systems in the area. This will affect freshwater supply and lead to numerous species suffering and dying, potentially including humans. Families and individuals who can afford to treat/pipe in fresh water or move away will be fine, unlike those who would be forced to live with the changes (Page & Daniel, 2019).
With an increase of seismic and volcanic activity, the systems being affected are those around fault lines, and volcanoes, increasing positive and negative impacts. This includes more soot in the air which can reflect light, and richer farmland due to settled soot (UC Santa Barbara). The primary negative effect of this is an increase in volcanic eruptions, and a possible ice age. On top of this the soot can cause breathing problems like silicosis and can even damage people’s eyes (Buis, 2019; CDC, 2018). With more movement of the tectonic plates, earthquakes also become more common. Even though an earthquake takes a few seconds communities could still feel the impact for years. As climate change continues, all these issues will become magnified and those who can do the least about it will be hit the hardest. As climate change continues to develop how will humans cope and adapt with it?
References
Bedford, D. (2009). Climate change and the cryosphere. Environment : Science and Policy for Sustainable Development, 51(2), 5–6. https://doi.org/10.3200/ENVT.51.2.05-06
Bock, Y., Wdowinski, S., Ferretti, A., Novali, F., & Fumagalli, A. (2012). Recent subsidence of the Venice lagoon from continuous GPS and interferometric synthetic aperture radar. Geochemistry, Geophysics, Geosystems, 13(3), Q03023. https://doi.org/10.1029/2011GC003976
Buis, A. (2019, October 29). Can climate affect earthquakes, or are the connections shaky? Climate Change: Vital Signs of the Planet, NASA. https://climate.nasa.gov/news/2926/can-climate-affect-earthquakes-or-are-the-connections-shaky/
CDC (Centers for Disease Control and Prevention). (2018, May 18). Key facts about volcanic eruptions. Volcanoes. Retrieved from https://www.cdc.gov/disasters/volcanoes/facts.html
CIA. (2020) The World Factbook: Maldives. Central Intelligence Agency. https://www.cia.gov/the-world-factbook/countries/maldives/
Fountain, A. G., Campbell, J. L., Shuur, E. A. G., Stammerjohn, S. E., Williams, M. W., & Ducklow H. W. (2012). The disappearing cryosphere: Impacts and ecosystem responses to rapid cryosphere Loss. Bioscience, 62(4), 405-415. https://doi.org/10.1525/bio.2012.62.4.11
Göğüş, O. H. & Pysklywec, R. N. (2008). Near-surface diagnostics of dripping or delaminating lithosphere. Journal of Geophysical Research, 113(B11), B11404. https://doi.org/10.1029/2007JB005123.
Kang, S., Xu, Y., You, Q., Flügel, W.-A., Pepin, N., & Yao, T. (2009). Review of climate and cryospheric change in the Tibetan Plateau. Environmental Research Letters, 5, 015101. https://doi.org/10.1088/1748-9326/5/1/015101
Lindsey, R. (2020, August 14). Climate change: Global sea level. NOAA Climate.gov. Retrieved October 30, 2020, from https://www.climate.gov/news-features/understanding-climate/climate-change-global-sea-level
Mozie, A., Ayadiuno, R. U., Onyekwelu, C. A. & Upa, C. (2014). Assessing earthquake risks along the West African Coast in the present climate change setting. IOSR Journal of Humanities and Social Science, 19(4), 66-73. https://doi.org/10.9790/0837-19446673
Ostberg, S., Lucht, W., Gerten, D., Boysen, L. R., & Schaphoff, S. (2018, January 9). Climate change could leave big mark on Earth’s landscape. AGU (American Geophysical Union) Newsroom. https://news.agu.org/press-release/climate-change-could-leave-big-mark-on-earths-landscape/.
Page, E., & Daniel, I. (2019). There’s Something in the Water [Film]. 2 Weeks Notice.
Shepherd, A., Fricker, H. A., & Farrell, S. L. (2018). Trends and connections across the Antarctic cryosphere. Nature, 558(7709), 223–232. https://doi.org/10.1038/s41586-018-0171-6.
Swindles, G. T., Watson, E. J., Savov, I. P., Lawson, I. T., Schmidt, A., Hooper, A., Cooper, C. L., Connor, C. B., Gloor, M. & Carrivick, J. L. (2018). Climatic control on Icelandic volcanic activity during the mid-Holocene. Geology, 46(1). 47-50. https://doi.org/10.1130/G39633.1
University of California, Santa Barbara, U. of C. S. B. (1997). Soils from volcanoes. http://volcanology.geol.ucsb.edu/soil.htm.
Figures
Derksen, C., Smith, S.L., Sharp, M., Brown, L., Howell, S., Copland, L., Mueller, D., Gauthier, Y., Fletcher, C., Tivy, A., Bernier, M., Bourgeois, J., Brown, R., Burn, C., Duguay, C., Kushner, P. , Langlois, A., Lewkowicz, A., Royer, A., & Walker, A (2012). Variability and change in the Canadian cryosphere. Climatic Change 115, 59–88. https://doi.org/10.1007/s10584-012-0470-0
Pelto, M. S. (2020). North Cascade Glacier Climate Project. https://glaciers.nichols.edu/mb/
Pidwirny, M. (2006). “Structure of the Earth”. Fundamentals of Physical Geography, 2nd Edition. Retrieved October 30, 2020, from http://www.physicalgeography.net/fundamentals/10h.html.
Sweet, W.V., Kopp, R.E., Weaver, C.P., Obeysekera, T., Horton, R.M., Thieler, E.R., & Zervas, C. (2017). Global and regional sea level rise scenarios for the United States. NOAA Tech. Rep. NOS CO-OPS 083. National Oceanic and Atmospheric Administration, National Ocean Service, Silver Spring, MD. 75pp. https://tidesandcurrents.noaa.gov/publications/techrpt83_Global_and_Regional_SLR_Scenarios_for_the_US_final.pdf
Tielidze, T. (2011). Gergeti Glacier 1890-2011. [Photograph]. https://imaggeo.egu.eu/view/3586/
Yumashev, D., Hope, C., Schaefer, K., Riemann-Campe, K., Iglesias-Suarez, F., Jafarov, E., Burke, E. J., Young, P. J., Elshorbany, Y., & Whiteman, G. 2019. Climate policy implications of nonlinear decline of Arctic land permafrost and other cryosphere elements. Nature Communications 10, 1900. https://doi.org/10.1038/s41467-019-09863-x
a dark gray to black dense to fine-grained igneous rock that consists of basic plagioclase, augite, and usually magnetite
formed by solidification of magma
consisting of or chiefly consisting of feldspar or feldspathoid quartz
a permanently frozen layer at variable depth below the surface in frigid regions of a planet
pneumoconiosis characterized by massive fibrosis of the lungs resulting in shortness of breath and caused by prolonged inhalation of silica dusts
