Chapter 14: Environmental Wellness- A Healthy Planet
How are you impacting the environment?
How is the environment impacting you?
The information in this chapter primarily comes from:
- Globalchange.gov: The Impacts of Climate Change on Human Health in the United States: A Scientific Assessment
- The United States Global Change Research Program: Climate Literacy: The Essential Principles of Climate Science
- Nasa: Global Climate Change
- The U.S. Environmental Protection Agency: Climate Change
- World Health Organization: Climate Change
- National Institute for Environmental Health Sciences
Chapter Learning Outcomes
By the end of this chapter you will be able to:
- Explain the relationship of CO2 to climate change.
- Provide evidence of climate change.
- Explain the impact of climate change on public health.
- List strategies for increasing health of the planet.
Mahatma Gandhi is quoted as saying, “Earth provides enough to satisfy every man’s needs, but not every man’s greed.” What was Gandhi trying to convey with that statement? Maybe, that the Earth does not have limitless resources for human consumption and that we as humans impact the health of the planet by the choices we make.
All humans live on one planet, planet Earth. Some call Earth “Mother Earth” because Earth nurtures life just like a mother. Human societies throughout history have symbols and depictions of Earth as a nurturer since every species on Earth depends on the resources of the planet for existence.
The relationship between humans and the environment is studied through a branch of public health known as Environmental Health. Environmental health seeks to understand how the environment impacts human health and how humans impact the health of the planet.
Climate Literacy
Climate Science Literacy is an understanding of your influence on climate and climate’s influence on you and society. It is important for each human living on earth to understand climate. Society needs citizens who understand the climate system and know how to apply that knowledge in their careers and in their engagement as active members of their communities.
A climate-literate person:
- Understands the essential principles of Earth’s climate system.
- Essential Principle 1: The Sun is the Primary Source of Energy for Earth’s Climate System
- Essential Principle 2: Climate is regulated by complex interactions among components of the Earth system.
- Essential Principle 3: Life on Earth depends on, is shaped by, and affects climate.
- Essential Principle 4: Climate varies over space and time through both natural and man-made processes.
- Essential Principle 5: Our understanding of the climate system is improved through observations, theoretical studies, and modeling.
- Essential Principle 6: Human activities are impacting the climate system.
- Essential Principle 7: Climate change will have consequences for the Earth system and human lives
- Knows how to assess scientifically credible information about climate.
- Communicates about climate and climate change in a meaningful way.
- Is able to make informed and responsible decisions with regard to actions that may affect climate.
This chapter is intended to help build your climate literacy.
Climate Change & Global Warming
“Climate change” and “global warming” are often used interchangeably but have distinct meanings. Global warming is the long-term heating of Earth’s climate system observed since the pre-industrial period (between 1850 and 1900) due to human activities, primarily fossil fuel burning, which increases heat-trapping greenhouse gas levels in Earth’s atmosphere. Climate change is long-term changes in the average weather patterns that have come to define Earth’s local, regional and global climates.
Global Warming: The Greenhouse Effect
Imagine stepping into a greenhouse. The temperature inside and outside of a greenhouse can be very different. Outside of a greenhouse you can feel the heat from the sun’s rays, but the heat can escape to the atmosphere, however, inside the greenhouse, the sun’s rays are turned to heat and the heat is trapped by the greenhouse. The way a greenhouse traps heat making it warmer inside than outside, is similar to how the greenhouse gases in the Earths atmosphere, such as CO2, trap heat and increase the temperature of the planet.
Earth is surrounded by the earth’s atmosphere, which is an envelope of gases surrounding the earth. The sun provides solar radiation to our planet that passes through the earths atmosphere. When the Sun’s solar rays hit our planet the solar radiation turns to heat. Gases in the atmosphere, such as carbon dioxide, nitrous oxide, methane, and water vapor, block heat from escaping, thus trapping in heat inside our atmosphere.
The trapping of heat is called the Greenhouse effect. Global warming refers to the recent and ongoing global average increase in temperature near the Earth’s surface. Scientists attribute the global warming trend observed since the mid-20th century to the “greenhouse effect.”
-
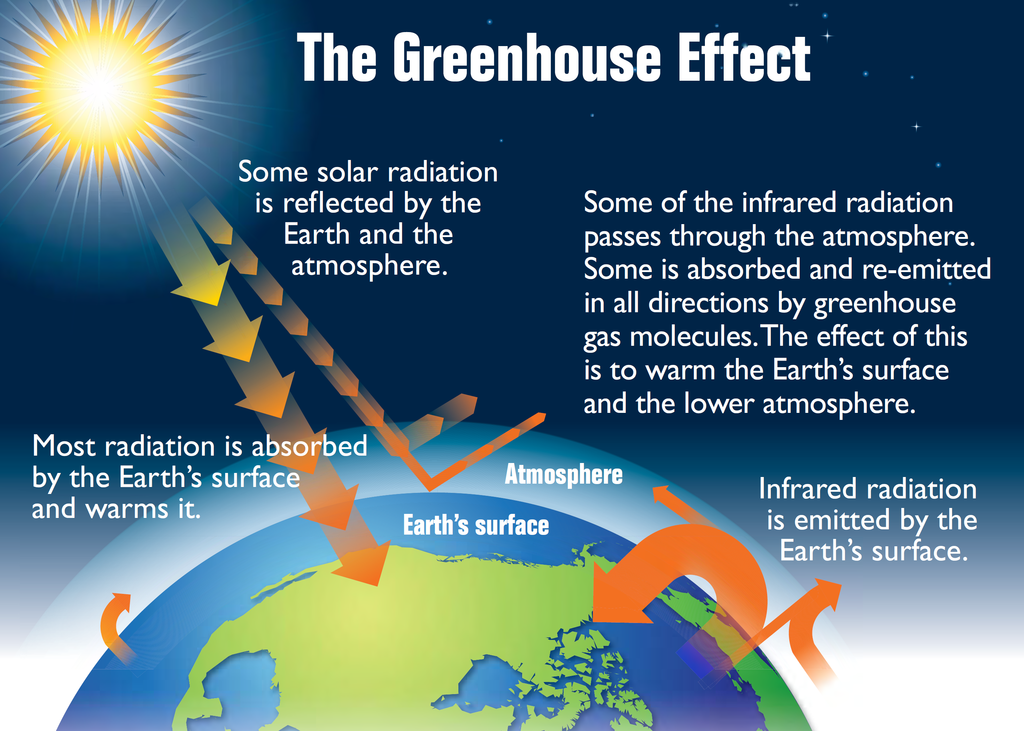
Figure 14.1: The Greenhouse effect
Evidence/Indicators of Climate Change
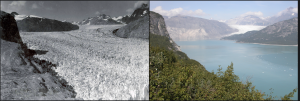
A picture is worth 1,000 words
Nasa has provided a library of “Images of Change” that show show a before and after comparison of land masses, glaciers, oceans, etc to depict how climate change is impacting the world around you. Some of the pictures show more recent changes, for example how the drought has changed Lake Powell, others show changes over time, such as the Muir Glacier Melt in Alaska.
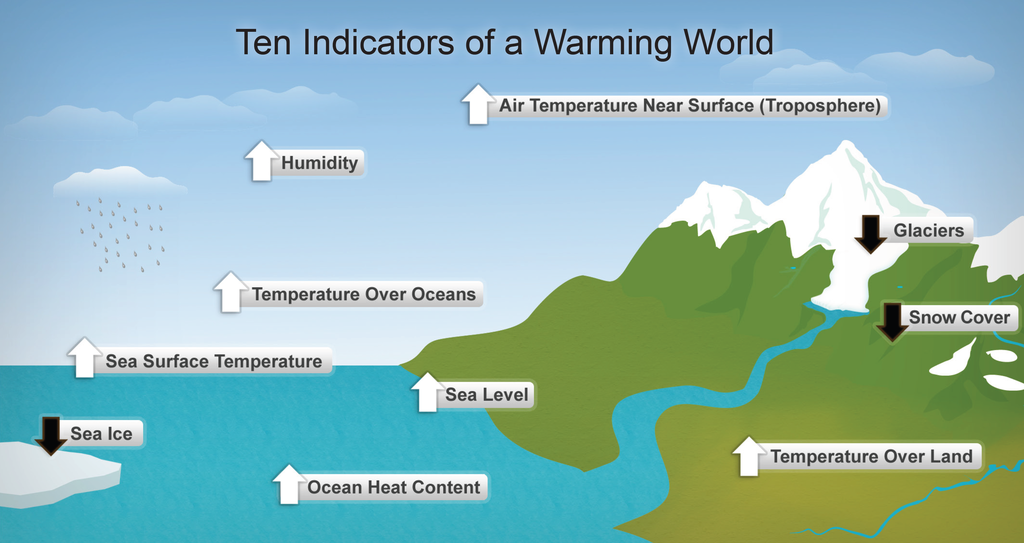
The Earth’s climate is changing. Observations from around the world show the widespread effects of increasing greenhouse gas concentrations on Earth’s climate. For example:
- High temperature extremes, droughts, and heavy precipitation events are becoming more frequent and intense.
- Glaciers and snow cover are shrinking, and sea ice is retreating.
- Seas are warming, rising, and becoming more acidic, and marine species are moving to new locations in colder waters.
- Flooding is becoming more frequent along the U.S. coastline.
- Growing seasons are lengthening, and areas burned by wildfire are growing.
The Environmental Protection Agency has compiled a key set of indicators[1] related to the causes and effects of climate change. The climate change indicators provide important information on how and why the climate is changing. These indicators include: greenhouse gases, weather and climate, oceans, snow and ice, health and society, and ecosystem
Greenhouse gases
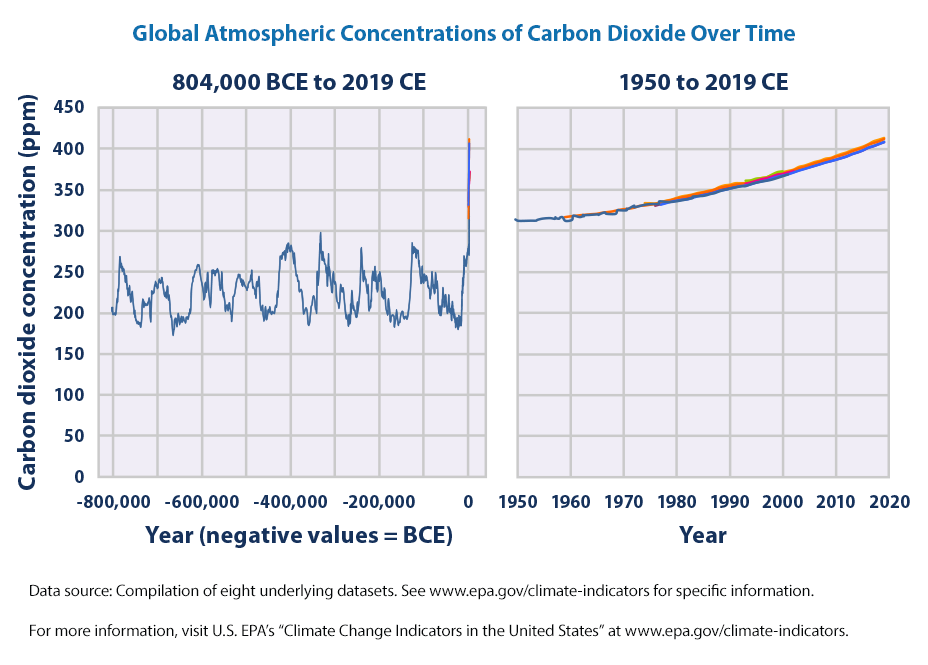
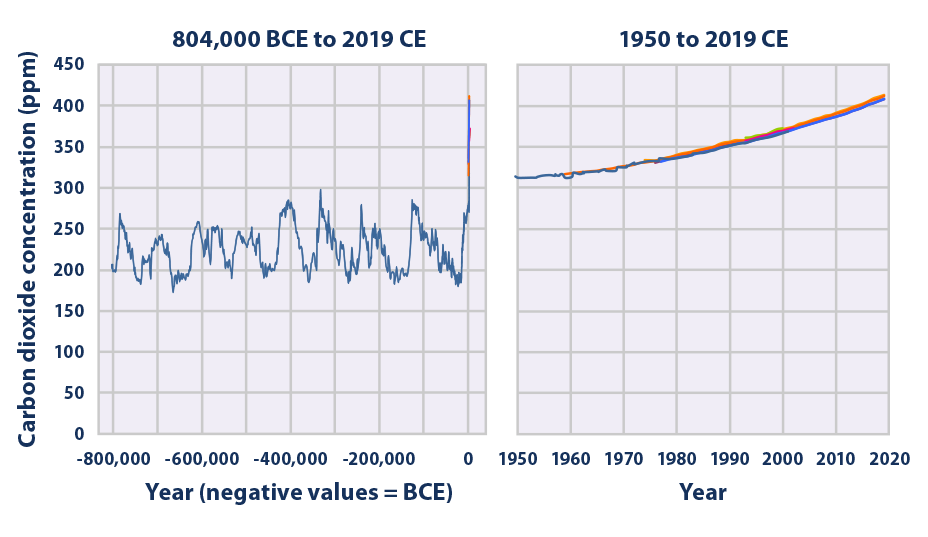
Ice cores[2] are like frozen time capsules that allow scientists to reconstruct climate far into the past. Using ice cores, scientists have been able to measure greenhouse gas emissions from over 800,000 years ago. Ice cores provide a direct measurement of greenhouse gases thus are considered a gold standard. As greenhouse gas emissions from human activities increase, they build up in the atmosphere and warm the climate, leading to many other worldwide changes in the atmosphere, on land, and in the oceans. Greenhouse gases from human activities are the most significant driver of observed climate change since the mid-20th century.
Summary of key points:
- In the United States, greenhouse gas emissions caused by human activities increased by 2 percent from 1990 to 2019. Since 2005, however, total U.S. greenhouse gas emissions have decreased by 12 percent. Carbon dioxide accounts for most of the nation’s emissions and most of the increase since 1990. Transportation is the largest source of greenhouse gas emissions in the United States, followed by electricity generation. Emissions per person have decreased slightly in the last few years.
- Worldwide, net emissions of greenhouse gases from human activities increased by 43 percent from 1990 to 2015. Emissions of carbon dioxide, which account for about three-fourths of total emissions, increased by 51 percent over this period. As with the United States, the majority of the world’s emissions result from transportation, electricity generation, and other forms of energy production and use.
- Concentrations of carbon dioxide and other greenhouse gases in the atmosphere have increased since the beginning of the industrial era. Almost all of this increase is attributable to human activities. Historical measurements show that the current global atmospheric concentrations of carbon dioxide are unprecedented compared with the past 800,000 years, even after accounting for natural fluctuations.
- From 1990 to 2019, the total warming effect from greenhouse gases added by humans to the Earth’s atmosphere increased by 45 percent. The warming effect associated with carbon dioxide alone increased by 36 percent.
-
Weather and climate
- Rising global average temperature is associated with widespread changes in weather patterns. Weather is what conditions of the atmosphere are over a short period of time, and climate is how the atmosphere “behaves” over relatively long periods of time.
Summary of Key Points
- Average temperatures have risen across the contiguous 48 states since 1901, with an increased rate of warming over the past 30 years.
- Eight of the top 10 warmest years on record have occurred since 1998. All of the top 10 warmest years on record worldwide have occurred since 2005.
- Since 1896, average winter temperatures across the contiguous 48 states have increased by nearly 3°F. Spring temperatures have increased by about 2°F, while summer and fall temperatures have increased by 1.4°F.
- Record-setting daily high temperatures have become more common than record lows. Since the 1970s, unusually hot summer days (highs) and unusually hot summer nights (lows) have become more common over the last few decades. Unusually cold winter temperatures have become less common—particularly very cold nights (lows).
- Heat waves are occurring three times more often than they did in the 1960s—about six per year compared with two per year. The average heat wave season is 47 days longer, and individual heat waves are lasting longer and becoming more intense.
- Since 1901, precipitation has increased at an average rate of 0.1 inches per decade over land areas worldwide. However, shifting weather patterns have caused certain areas, such as the Southwest, to experience less precipitation than usual.
- The prevalence of extreme single-day precipitation events remained fairly steady between 1910 and the 1980s but has risen substantially since then. Nationwide, nine of the top 10 years for extreme one-day precipitation events have occurred since 1996.
- Floods have generally become larger across parts of the Northeast and Midwest and smaller in the West, southern Appalachia, and northern Michigan. Large floods have become more frequent across the Northeast, Pacific Northwest, and parts of the northern Great Plains, and less frequent in the Southwest and the Rockies.
- Drought trends vary by region, as the West has generally experienced more drought while the Midwest and Northeast have become wetter.
- The southwestern United States is particularly sensitive to changes in temperature and thus vulnerable to drought, as even a small decrease in water availability in this already arid region can stress natural systems and further threaten water supplies. Several measures indicate persistent and more severe drought conditions in recent years.
Oceans
Covering about 70 percent of the Earth’s surface, the world’s oceans have a two-way relationship with weather and climate. The oceans influence the weather on local to global scales, while changes in climate can fundamentally alter many properties of the oceans.
Summary of Key Points
- The amount of heat stored in the ocean has increased substantially since the 1950s. Ocean heat content not only determines sea surface temperature, but also affects sea level and currents.
- Sea surface temperatures have been consistently higher during the past three decades than at any other time since reliable observations began in the late 1800s.
- When averaged over all of the world’s oceans, sea level has risen at a rate of roughly six-tenths of an inch per decade since 1880. Changes in sea level relative to the land vary by region. Along the U.S. coastline, sea level has risen the most along the Mid-Atlantic coast and parts of the Gulf coast, where several stations registered increases of more than 8 inches between 1960 and 2020. Sea level has decreased relative to the land in parts of Alaska and the Pacific Northwest.
- As sea level rises, dry land and wetlands can turn into open water. Along many parts of the Atlantic coast, this problem is made worse by low elevations and land that is already sinking. Between 1996 and 2011, the coastline from Florida to New York lost more land than it gained.
- Flooding is becoming more frequent along the U.S. coastline as sea level rises. Every site measured has experienced an increase in coastal flooding since the 1950s. The rate is accelerating at most locations along the East and Gulf coasts. The East Coast suffers the most frequent coastal flooding and has generally experienced the largest increases in the number of flood days.
- The ocean has become more acidic over the past few decades because of increased levels of atmospheric carbon dioxide, which dissolves in the water. Higher acidity affects the balance of minerals in the water, which can make it more difficult for certain marine animals to build their protective skeletons or shells.
Snow and Ice
The Earth’s surface contains many forms of snow and ice, including sea, lake, and river ice; snow cover; glaciers, ice caps, and ice sheets; and frozen ground. Climate change can dramatically alter the Earth’s snow- and ice-covered areas because snow and ice can easily change between solid and liquid states in response to relatively minor changes in temperature.
Summary of Key Points
- The part of the Arctic Ocean covered by ice is typically smallest in September, after the summer melting season. Arctic sea ice has decreased over time, and in September 2020 it was the second smallest ever recorded. The length of the melt season for Arctic ice has grown, and the ice has also become thinner, which makes it more vulnerable to further melting.
- Antarctic sea ice has increased slightly overall since 1979, though it has decreased in the last few years. Slight increases in Antarctic sea ice are outweighed by the loss of sea ice in the Arctic during the same time period.
- Since 1992, the giant ice sheets that cover Greenland and Antarctica have each lost more than 100 billion metric tons of ice per year on average. The total amount of ice lost from 1992 to 2018 was enough to raise sea level worldwide by an average of roughly seven-tenths of an inch.
- Glaciers in the United States and around the world have generally shrunk since the 1960s, and the rate at which glaciers are melting has accelerated over the last decade.
- Lakes in the northern United States are freezing later and thawing earlier compared with the 1800s and early 1900s.
- Since the early 1970s, all five of the Great Lakes have experienced a long-term decrease in the maximum area that freezes each year, but the decrease is only statistically meaningful in one lake (Superior). The number of frozen days per year has also decreased for all five lakes since the early 1970s.
- Total snowfall has decreased in most parts of the country since widespread records began in 1930. One reason for this decline is that nearly 80 percent of the locations studied have seen more winter precipitation fall in the form of rain instead of snow.
- Between 1972 and 2020, the average portion of North America covered by snow decreased at a rate of about 1,870 square miles per year, based on weekly measurements taken throughout the year. The length of time when snow covers the ground has become shorter by nearly two weeks since 1972, on average.
- The amount of snow on the ground (snowpack) in early spring decreased at 86 percent of measurement sites in the western United States between 1955 and 2020 and snowpack at all sites declined by an average of 19 percent during this time period.
- About 80 percent of Alaska’s land is underlain by permafrost, which refers to rock or soil with ice that stays frozen for two or more years. Between 1978 and 2020, permafrost temperatures increased at 14 out of 15 long-term monitoring sites in Alaska.
- The number of days per year with unfrozen ground has increased at an average rate of about four days per decade in both the contiguous 48 states and Alaska. Unfrozen days have generally increased across North America, with some variability by region.
Health and Society
Changes in the Earth’s climate can affect public health, agriculture, water supplies, energy production and use, land use and development, and recreation.
Summary of Key Points
- Since 1979, more than 11,000 Americans were reported to have died as a direct result of heat-related illnesses such as heat stroke, and even more died where heat was a contributing factor.
- From 2001 to 2010, a total of about 28,000 heat-related hospitalizations were recorded across 20 states.
- Since 1979, more than 19,000 Americans were reported to have died from exposure to cold temperatures, and even more died where exposure to cold was a contributing factor.
- As the U.S. climate has warmed in recent years Americans in the North and West are using less energy for heating and more energy for air conditioning, while much of the Southeast has experienced the opposite results.
- Since 1973, the average amount of electricity used by Americans at home during the summer has nearly doubled, but it appears to have leveled somewhat in recent years. Conversely, the average American’s winter use of natural gas (the most common home heating fuel) has decreased since 1974.
- Nationwide, the rate of reported cases of Lyme disease has nearly doubled since 1991. The number and distribution of reported cases of Lyme disease have increased in the Northeast and upper Midwest over time, where some states now report 50 to 110 more cases of Lyme disease per 100,000 people than they did in 1991.
- The length of the growing season for crops and other plants has increased in almost every state. States in the Southwest (e.g., Arizona and California) have seen the most dramatic increase. In contrast, the growing season has become slightly shorter in two states (Alabama and Georgia). The observed changes reflect earlier spring warming as well as later arrival of fall frosts. The length of the growing season has increased more rapidly in the West than in the East.
- Since the late 1940s, the annual number of growing degree days increased at 75 percent of the locations measured across the contiguous 48 states. The average change was a 9 percent increase. The largest increases occurred in the West and the Northeast.
- The length of ragweed pollen season has increased at 10 out of 11 locations studied in the central United States and Canada since 1995 allowing ragweed plants to produce pollen later into the year, potentially prolonging the allergy season for millions of people.
Ecosystems
Ecosystems provide humans with food, clean water, and a variety of other services that can be affected by climate change.
Summary of Key Points
- Since 1983, the United States has had on average 70,000 recorded wildfires per year. The top 10 years with the largest acreage burned since 1983, have all occurred since 2004 with many of the largest increases occurring in western states.
- Over the past 79 years, minimum, maximum, and average streamflows have changed in many parts of the country—some higher, some lower. Among rivers and streams strongly influenced by snowmelt, peak flow from winter-spring runoff is happening at least five days earlier than it did in the mid-20th century.
- From 1960 through 2014, water temperature increased at 79 percent of the stream sites measured in the Chesapeake Bay region.
- Between 1960 and 2020, water temperatures increased by 1.9°F in the Snake River at a site on tribal lands in eastern Washington. Several species of salmon use the Snake River to migrate and spawn, and these salmon play an important role in the diet, culture, religion, and economy of the region’s Native Americans.
- Since 1985, summer surface water temperatures have increased in 32 of the 34 lakes with long-term records that this indicator tracks across North America.
- Water levels in most of the Great Lakes appear to have declined slightly over the last few decades.
- Long-term studies have found that bird species in North America have shifted their wintering grounds northward by an average of more than 40 miles since 1966, with several species shifting by hundreds of miles. Some birds shift their range or alter their migration habits to adapt to changes in temperature or other environmental conditions.
- Shifts in location have occurred among several economically important fish and shellfish species that have moved about 20 miles, and 21 feet deeper in the water, between 1982 and 2018. For example, American lobster, black sea bass, and red hake in the Northeast have moved northward by an average of 113 miles.
- Leaf growth and flower blooms are examples of natural events whose timing can be influenced by climate change. In general, leaf and bloom events are happening earlier throughout the North and West but later in much of the South. for example, Cherry Blossom Bloom Dates in Washington, D.C. Peak bloom dates of the iconic cherry trees in Washington, D.C., recorded since the 1920s, indicate that cherry trees are blooming slightly earlier than in the past. Bloom dates are key to planning the Cherry Blossom Festival, one of the region’s most popular spring attractions.
Exercises: Data, data, and more data
Are you curious how the U.S. compares to other countries in the various elements of climate change? Do you like looking at data and graphs? If so, check out “Our World in Data” to view extensive data and graphs on climate change for the U.S. and around the world.
Impacts of Climate Change on Human Health
Climate change is a significant threat to the health of the American people and every American is vulnerable to the health impacts associated with climate change. The U.S. Global Change Research Program’s (USGCRP’s) National Climate Assessment (NCA) process has published a scientific assessment on the impact of climate change on human health[3].
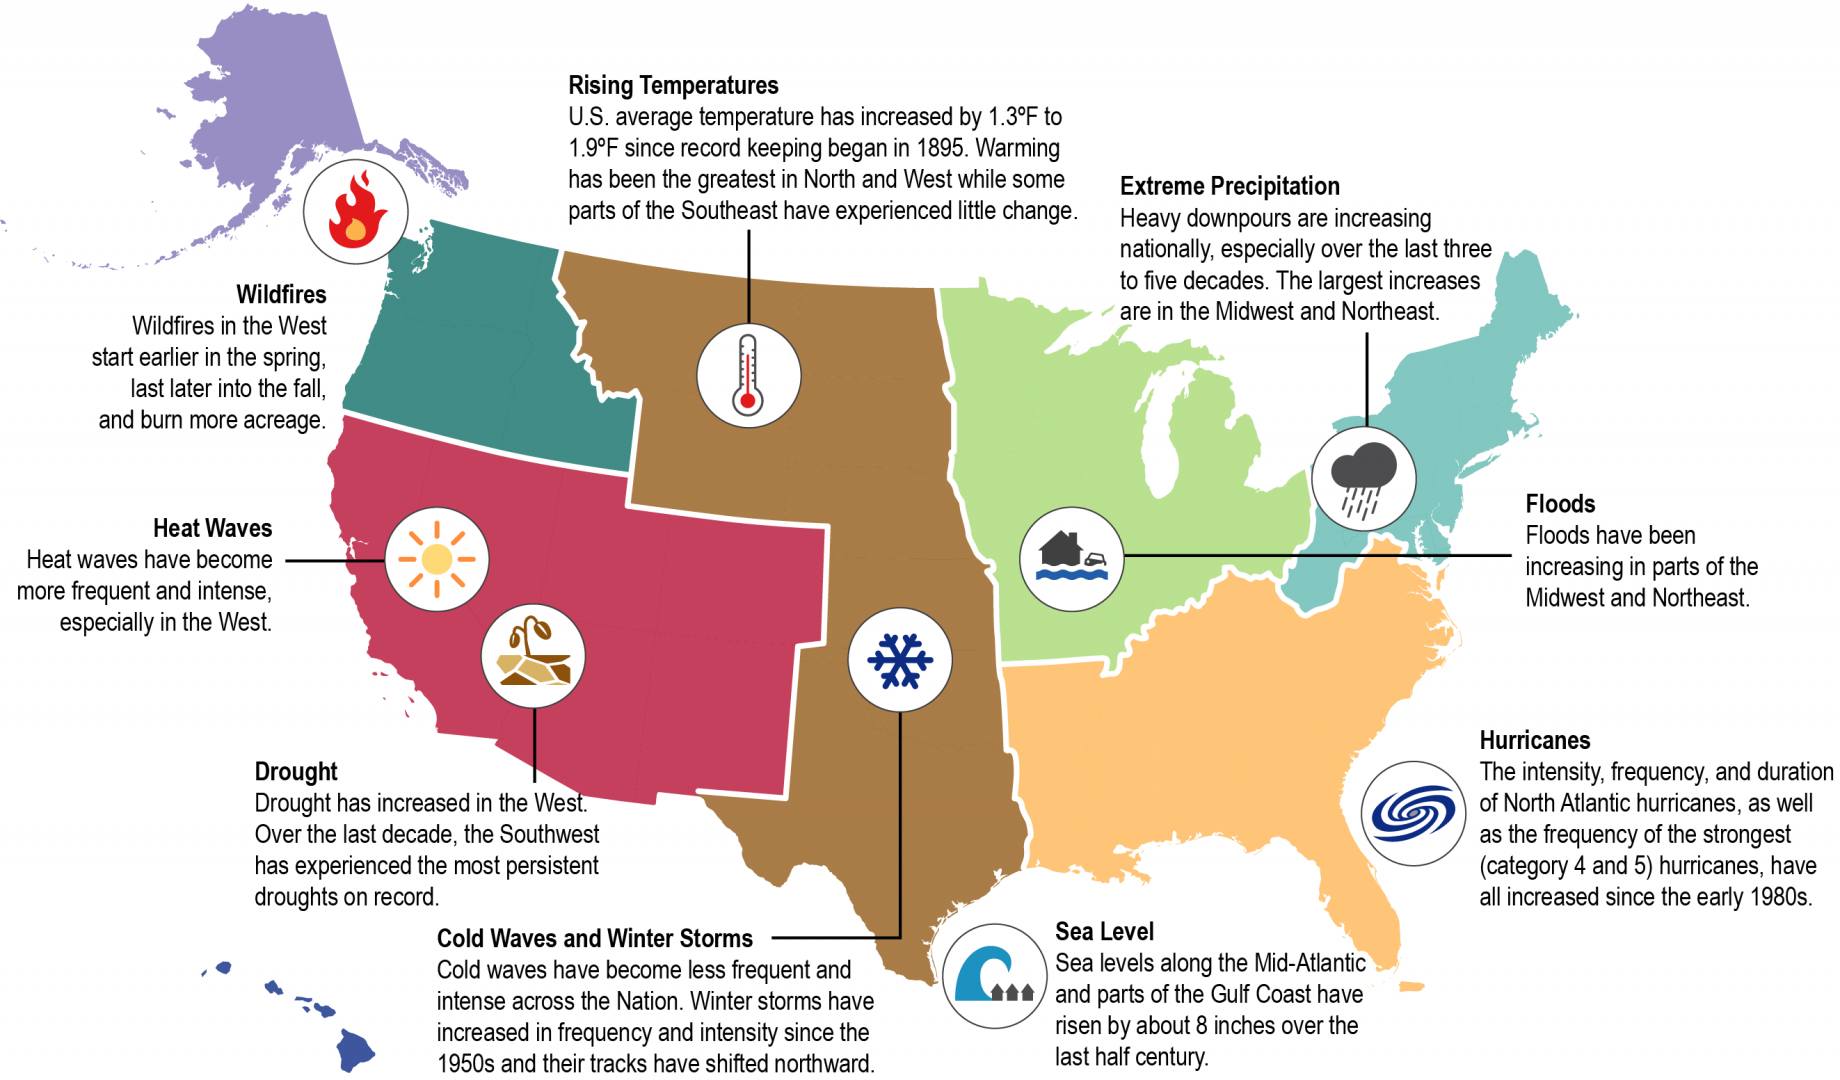
With climate change, the frequency, severity, duration, and location of weather and climate phenomena, like rising temperatures, heavy rains and droughts, and some other kinds of severe weather, are changing. This means that areas already experiencing health-threatening weather and climate phenomena are likely to experience worsening impacts, it also means that some locations will experience new climate-related health threats. Climate changes that impact human health include: wildfires, heat waves, drought, cold waves and winter storms, sea level changes, hurricanes, floods, extreme precipitation, and rising temperatures.
Changes in the environment may have numerous impacts to existing health conditions and the development of new diseases.
| Health Conditions | Possible Influences of Climate Change |
| ALZHEIMER’S DISEASE | Persons with cognitive impairments are vulnerable to extreme weather events that require evacuation or other emergency responses. |
| ASTHMA | Asthma is exacerbated by changes in pollen season and allergenicity and in exposures to air pollutants affected by changes in temperature, humidity, and wind. |
| CHRONIC OBSTRUCTIVE PULMONARY DISEASE ( COPD ) | COPD patients are more sensitive than the general population to changes in ambient air quality associated with climate change. |
| DIABETES | Diabetes increases sensitivity to heat stress; medication and dietary needs may increase vulnerability during and after extreme weather events. |
| CARDIOVASCULAR DISEASE | Cardiovascular disease increases sensitivity to heat stress. |
| MENTAL ILLNESS | Mental illness may impair responses to extreme events ; certain medications increase sensitivity to heat stress. |
| OBESITY | Obesity increases sensitivity to high ambient temperatures. |
| DISABILITY | Persons with disabilities may find it hard to respond when evacuation is required and when there is no available means of transportation or easy exit from residences. |
The following sections provide key findings from the “The Impacts of Climate Change on Human Health in the United States: A Scientific Assessment.” In the official report, each key finding is notated with a level of confidence, from medium to high levels of confidence based on scientific analyses.
Temperature-Related Death and Illness
Key findings:
- By the end of the century, an increase of thousands to tens of thousands of premature heat-related deaths in the summer and a decrease of premature cold-related deaths in the winter are projected each year as a result of climate change.
- Days that are hotter than usual in the summer or colder than usual in the winter are both associated with increased illness and death.
- Some populations are more vulnerable to death or illness due to high temperatures such as children, older adults, people working outdoors, the socially isolated and economically disadvantaged, those with chronic illnesses, as well as some communities of color.
Air Quality Impacts
Key findings:
- Changes in the climate affect the air we breathe, both indoors and outdoors.
- Climate-driven increases in ozone will cause premature deaths, hospital visits, lost school days, and acute respiratory symptoms
- Changes in climate, specifically rising temperatures, altered precipitation patterns, and increasing concentrations of atmospheric carbon dioxide, are expected to contribute to increases in the levels of some airborne allergens and associated increases in asthma episodes and other allergic illnesses .
- Climate change is projected to increase the number and severity of naturally occurring wildfires in parts of the United States, increasing emissions of particulate matter and ozone precursors and resulting in additional adverse health outcomes.
Extreme Events
Key findings:
- Extreme weather events can cause death or injury during an event (for example, drowning during floods), however health impacts can also occur before or after an extreme event, as individuals may be involved in activities that put their health at risk, such as disaster preparation and post-event cleanup.
- Climate change will increase exposure risk in some regions of the United States due to projected increases in the frequency and/or intensity of drought, wildfires, and flooding related to extreme precipitation and hurricanes.
- Many types of extreme events related to climate change cause disruption of infrastructure, including power, water, transportation, and communication systems, that are essential to maintaining access to health care and emergency response services and safeguarding human health.
- Climate change will increase exposure risk to coastal flooding due to increases in extreme precipitation and in hurricane intensity and rainfall rates, as well as sea level rise and the resulting increases in storm surge.
Vector-Borne Diseases
Key findings:
- Vector-borne diseases are illnesses that are transmitted by vectors, which include mosquitoes, ticks, and fleas.
- Climate change is expected to alter the geographic and seasonal distributions of existing vectors and vector-borne diseases.
- Ticks capable of carrying the bacteria that cause Lyme disease and other pathogens will show earlier seasonal activity and a generally northward expansion in response to increasing temperatures associated with climate change. Longer seasonal activity and expanding geographic range of these ticks will increase the risk of human exposure to ticks.
- Alterations in the distribution, abundance, and infection rate of mosquitoes will influence human exposure to bites from infected mosquitoes, which is expected to alter risk for human disease.
- Vector-borne pathogens are expected to emerge or reemerge due to the interactions of climate factors with many other drivers, such as changing land-use patterns.
Water-Related Illness
Key findings:
- Increases in water temperatures associated with climate change will alter the seasonal windows of growth and the geographic range of suitable habitat for freshwater toxin-producing harmful algae, certain naturally occurring Vibrio bacteria, and marine toxin-producing harmful algae. These changes will increase the risk of exposure to waterborne pathogens and algal toxins that can cause a variety of illnesses.
- Runoff from more frequent and intense extreme precipitation events will increasingly compromise recreational waters, shellfish harvesting waters, and sources of drinking water through increased introduction of pathogens and prevalence of toxic algal blooms. As a result, the risk of human exposure to agents of water-related illness will increase.
- Increases in some extreme weather events and storm surges will increase the risk that infrastructure for drinking water, wastewater, and stormwater, will fail due to either damage or exceedance of system capacity, especially in areas with aging infrastructure. As a result, the risk of exposure to water-related pathogens, chemicals, and algal toxins will increase in recreational and shellfish harvesting waters, and in drinking water where treatment barriers break down.
Food Safety, Nutrition, and Distribution
Key findings:
- Climate change, including rising temperatures and changes in weather extremes, is expected to increase the exposure of food to certain pathogens and toxins. This will increase the risk of negative health impacts
- Elevated sea surface temperatures will lead to greater accumulation of mercury in seafood, while increases in extreme weather events will introduce contaminants into the food chain. Rising carbon dioxide concentrations and climate change will alter incidence and distribution of pests, parasites, and microbes, leading to increases in the use of pesticides and veterinary drugs
- The nutritional value of agriculturally important food crops, such as wheat and rice, will decrease as rising levels of atmospheric carbon dioxide continue to reduce the concentrations of protein and essential minerals in most plant species.
- Increases in the frequency or intensity of some extreme weather events associated with climate change will increase disruptions of food distribution by damaging existing infrastructure or slowing food shipments. These impediments lead to increased risk for food damage, spoilage, or contamination, which will limit availability of and access to safe and nutritious food depending on the extent of disruption and the resilience of food distribution infrastructure.
Mental Health and Well-Being
Key findings:
- Many people exposed to climate-related or weather-related disasters experience stress and serious mental health consequences.
- Specific groups of people are at higher risk for distress and other adverse mental health consequences from exposure to climate-related or weather-related disasters. These groups include children, the elderly, women (especially pregnant and post-partum women), people with preexisting mental illness, the economically disadvantaged, the homeless, and first responders
- Many people will experience adverse mental health outcomes and social impacts from the threat of climate change, the perceived direct experience of climate change, and changes to one’s local environment.
- Increases in extreme heat will increase the risk of disease and death for people with mental illness, including elderly populations and those taking prescription medications that impair the body’s ability to regulate temperature.
Populations of Concern
Key findings:
- Across the United States, people and communities differ in their exposure, their inherent sensitivity, and their adaptive capacity to respond to and cope with climate change related health threats [Very High Confidence]. Vulnerability to climate change varies across time and location, across communities, and among individuals within communities.
- People experience different inherent sensitivities to the impacts of climate change at different ages and life stages. For example, the very young and the very old are particularly sensitive to climate-related health impacts.
- Climate change threatens the health of people and communities by affecting exposure, sensitivity, and adaptive capacity. Social determinants of health, such as those related to socioeconomic factors and health disparities, may amplify, moderate, or otherwise influence climate-related health effects, particularly when these factors occur simultaneously or close in time or space.
- The use of geographic data and tools allows for more sophisticated mapping of risk factors and social vulnerabilities to identify and protect specific locations and groups of people
healthier home, community, country, and world
Although climate change has enormous impacts on health, there are additional concerns and actions that you can take to increase your environmental health.
Overpopulation
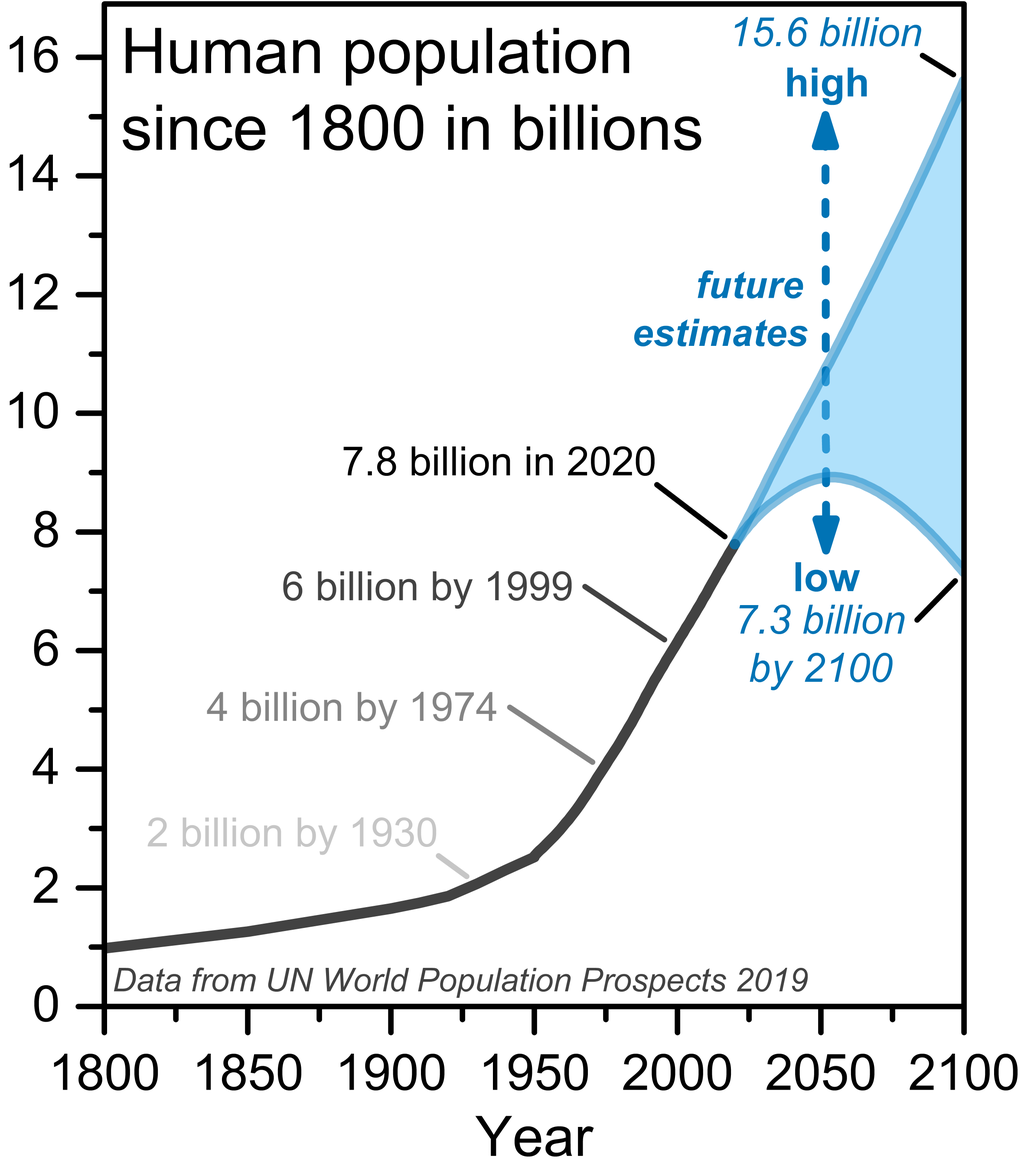
Average life expectancy in 1900 was 48 years, and today that has increased to about 78 years. We have made incredible advances that have contributed to an increase our life expectancy. For example, infant mortality rates have decreased dramatically during the 20th century, from 165 deaths per 1,000 births in 1900 to 7 deaths per 1,000 births today, advances in fertility treatments have provided new opportunities for conceiving children, and people have lived safer healthier lives with advances like clean drinking water, car safety belts, and work hard hats. These advances have helped to increase our worldwide population. The world population reached 1 billion people in 1803 and in just over 100 years, that population doubled to 2 billion people in 1928. It then took only about 50 years to double the population again to 4 billion people by 1975. By 2023 the population is expected to double again to 8 billion people. With these trends in growth the population is likely to reach 8.5 billion in 2030 and 9.7 billion in 2050.
Many believe overpopulation is the root cause of environmental health issues we are facing today. It is unknown how many people the Earth can support, however scientist do believe there is a limit and that humans are negatively impact the health of the planet which in turn is causing health issues for people. Overpopulation may cause food shortages, increase rate of disease transmission due to living closer together, lack of clean water, fear of limited employment opportunities for the demand, and disappearance of nonrenewable energy, such as the estimation that natural gas will run out in the next 35 years. With current population growth trends it becomes even more important for humans to take care of the planet.
Energy Use: Fossil Fuels to Renewable Energy
All forms of electricity generation have an environmental impact on our air, water and land, but it varies. Of the total energy consumed in the United States, about 40% is used to generate electricity, making electricity use an important part of each person’s environmental footprint. The total amount of greenhouse gases that are emitted into the atmosphere each year by a person, family, building, organization, or company are called the carbon footprint.
Producing and using electricity more efficiently reduces both the amount of fuel needed to generate electricity and the amount of greenhouse gases and other air pollution emitted as a result. Electricity from renewable resources such as solar, geothermal, hydropower, and wind generally do not contribute to climate change or local air pollution since no fuels are combusted.
Clean energy includes renewable energy, energy efficiency and efficient combined heat and power.
Measure and reduce your energy impact
How much energy are you using? What is your carbon footprint? How can you reduce your impact?
- Use EPA’s household carbon footprint calculator to estimate your household’s annual emissions and find ways you can cut emissions.
- Learn about the many ways to save in your home and track your progress with “My ENERGY STAR“
- Use Power Profiler to learn about the air emissions associated with your home or business’s electricity use.
- Use AirNow to learn about local air quality.
- Use MyEnvironment to access local environmental quality information.
Waste
We all play a role in helping to prevent and remove trash in the environment. You can take action at home, school, and work to ensure a cleaner community and healthier waters.
Most of the trash that pollutes our rivers, lakes, estuaries, and oceans comes from sources on land. Plastic trash, in particular, threatens human health, aquatic ecosystems, and the economy. The most effective way to prevent trash from polluting our waterways is to reduce the amount of waste you create.
How much trash ends up in the ocean?
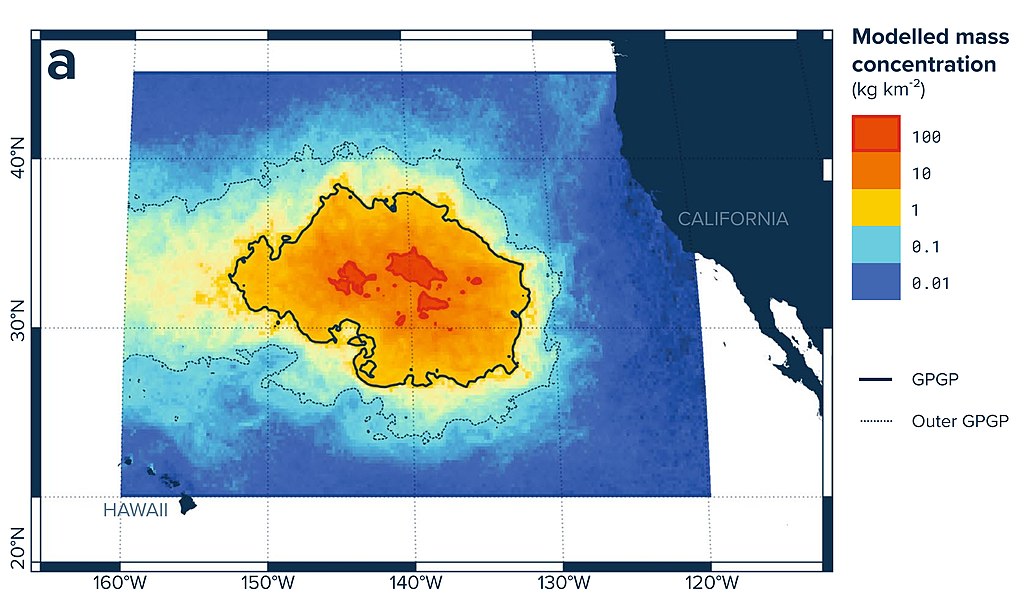
One of the most extreme and dramatic examples of the amount of trash that ends up in the ocean is known as the Great Pacific Garbage Patch, or “garbage island.” It is is a collection of marine debris in the North Pacific Ocean between California and Hawaii[4]. The collection is estimated to be about double the size of the state of Texas.
The garbage patch was discovered in 1997 by Charles Moore. Moore had just finished a Los Angeles-to-Hawaii sail race known as the Transpac and he decided to take a short cut back to LA. He said, “on the way back to our home port in Long Beach, California, we decided to take a shortcut through the [North Pacific subtropical] gyre, which few seafarers ever cross. Fishermen shun it because its waters lack the nutrients to support an abundant catch. Sailors dodge it because it lacks the wind to propel their sailboats… as I gazed from the deck at the surface of what ought to have been a pristine ocean, I was confronted, as far as the eye could see, with the sight of plastic”[5].
The 3 R’s: Reduce, Reuse, and Recycle
The first goal should be to reduce your impact by reducing the energy you use, reducing the amount of waste you produce, reducing the amount of water you consume, etc.
The second goal should be to reuse as much as possible. Buy used items, repurpose items, share items with others, etc.
The last goal should be to recycle. Recycle plastics, aluminum, paper, etc to allow for them to be reused.
The following are tips to achieve the 3 R’s.
- Think Green Before You Shop.
- Do you really need it? Will you really use it?
- How “green” is it? Is it built to last? Is it “energy star” rated? Is it made of recyclable material?
- Can you borrow it or buy it used instead?
- Reduce your food waste by shopping smart.
- Buy only what you need, compost food scraps, and donate unused food to food banks or shelters.
- One-third of all food in the United States goes uneaten. The EPA estimates that in 2018, about 81 percent (about 20.3 tons) of households’ wasted food ended up in landfills or combustion facilities.
- Preventing food from going to waste is one of the easiest and most powerful actions you can take to save money and lower your climate change footprint by reducing greenhouse gas (GHG) emissions and conserving natural resources.
- Reuse or repurpose items such as old clothing, cloth grocery bags, and containers to prevent waste.
- Buy used items to reduce waste as well as the emissions created by producing new materials or disposing of them in landfills.
- Donate unused clothing, electronics and building materials to make sure others can reuse them too! One person’s trash is another person’s treasure. Instead of discarding unwanted appliances, tools or clothes, try selling or donating them
- Buy products made with recycled content. Check labels to see if a product or its packaging is made from recycled materials. You help close the recycling loop by buying new products made from recycled materials
- Know before you throw.
- Know what items your local recycling program collects and encourage your household to recycle right and recycle more.
- Unsure how to recycle? Visit Earth911-More ideas,Less waste for help
- Maintain and repair products, like clothing, tires and appliances, so that they won’t have to be thrown out and replaced as frequently.
- Borrow, rent or share items that are used infrequently, like party decorations, tools or furniture.
- Learn about what you can do at home, at school, at work and in your community!
Sustainability
Sustainability is based on a simple principle: Everything that we need for our survival and well-being depends, either directly or indirectly, on our natural environment.
The National Environmental Policy Act of 1969 committed the United States to sustainability, declaring it a national policy “to create and maintain conditions under which humans and nature can exist in productive harmony, that permit fulfilling the social, economic and other requirements of present and future generations.”
Production, processing, packaging, and transportation of food is highly dependent on the use of fossil fuels and chemical fertilizers. These can greatly harm our health and the health of the environment. As a consumer, you have power to make a difference by considering the impact of your choices. Opting for local, healthy, environmentally responsible food helps promote both personal health and overall health of the community.
Choose foods that:
- Do not harm the environment.
- Support and preserve rural communities.
- Are healthy and nutritious.
- Respect farm animals.
- Provide farmers with fair wages.
- Are free of added toxins.
- Are grown locally.
- Do not harm the health of farm workers.
What can you do?
Find out what you can do to help make a difference in our environment every day. Whether you’re at home, on the go, in the office, or at school, there are many opportunities to go green by Reducing, Reusing, and Recycling.
Review the tips for home, school, work, communities, travel, and holiday/events. Identify strategies that you could implement to support a healthy planet:
Healthy Community Design
The way we design and build our communities affects our physical and mental health. How can communities come together to design healthier places to work, play, and live? The American Institute of Architects, American Planning Association, American Public Health Association, American Society of Civil Engineers, American Society of Landscape Architects, National Recreation and Park Association, U.S. Green Building Council, and Urban Land Institute have come together for a joint call to action to implement healthier places.
Examples of work to create healthier places include:
- Northwest Arkansas: Turning the wheels to build biking infrastructure and access
- Phoenix: Design strategies for burning health issues
- Los Angeles: Convening new partnerships, breaking out of silos
- Salinas, California: A neighborhood’s plans for a vibrant transformation
- Denver: A stormwater problem becomes a health equity opportunity
- Colorado: Broadening the discussion about health and the built environment
- Washington, D.C.: A lesson plan for health and health equity
- South Bend, Indiana: Driving results for community safety and health
- Winchester, Kentucky: Reimagining parks, health and an entire small town
- Baltimore: An alley becomes a gateway to a healthier community
Key Takeaways for Chapter
- Every citizen needs to be climate literate.
- The planet is warming due to the greenhouse effect, also known as global warming.
- The Earths climate is changing causing numerous problems with our weather, oceans, snow/ice, and ecosystems.
- Human health is being negatively impacted by climate change.
- Humans can take actions to increase the health of the planet.
Media Attributions
- Earth’s_greenhouse_effect_(US_EPA,_2012) © US EPA is licensed under a Public Domain license
- Muir glacier melt, Alaska 1941 and 2004 © NASA Global Climate Change is licensed under a Public Domain license
- ghg-concentrations_download1_2021 © EPA is licensed under a Public Domain license
- 10 Indicators of a Warming World © US National Oceanic and Atmospheric Administration: National Climatic Data Center is licensed under a Public Domain license
- 1.1 Major U.S. Climate Trends © original figure provided by Allison Crimmins, EPA; Ken Kunkel, CICS-NC, Dave Easterling, NCDC adapted by KFalcone is licensed under a Public Domain license
- Human_population_since_1800 © Bdm25 is licensed under a CC BY-SA (Attribution ShareAlike) license
- Great_Pacific_Garbage_Patch-Map-2017 © L. Lebreton, B. Slat, F. Ferrari, B. Sainte-Rose, J. Aitken, R. Marthouse, S. Hajbane, S. Cunsolo, A. Schwarz, A. Levivier, K. Noble, P. Debeljak, H. Maral, R. Schoeneich-Argent, R. Brambini, and J. Reisser is licensed under a CC BY (Attribution) license
- Climate Change Indicators in the United States. (2022, March 31). US EPA. https://www.epa.gov/climate-indicators ↵
- About Ice Cores. (n.d.-b). NSF Ice Core Facility. https://icecores.org/about-ice-cores ↵
- The Impacts of Climate Change on Human Health in the United States: A Scientific Assessment. (2016, April 4). GlobalChange.Gov. https://health2016.globalchange.gov/ ↵
- https://education.nationalgeographic.org/resource/great-pacific-garbage-patch ↵
- Trashed: Across the Pacific Ocean, plastics, plastics, everywhere. (2003, November). Natural History Magazine. https://www.naturalhistorymag.com/htmlsite/master.html?https://www.naturalhistorymag.com/htmlsite/1103/1103_feature.html ↵

.png)