6 Return
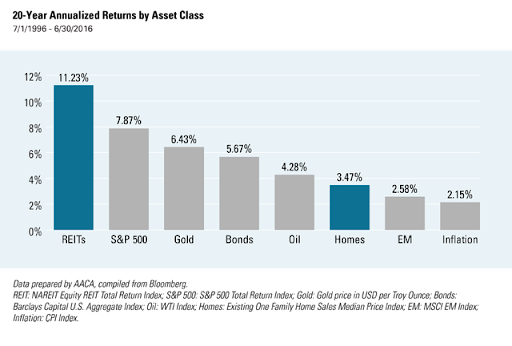
What should we expect to gain from our assets? Are we able to have a clear idea of the way our assets will perform? Just like measuring risk, this is a very difficult thing to do. Price changes can be very unpredictable. Whole careers are dedicated to finding and predicting returns for investments. This is a difficult task even for the most educated professionals, who still get it wrong much of the time. It is important that the new investor realizes that no one has all the answers and that many of the tv personalities, financial advisors, and other so-called “experts” promise things that cannot be achieved. Instead, you should take a long look at a zoomed-out chart of assets over a long period of time to be the basis of your return expectations. Even though asset prices may fluctuate in the short term, we can use a long-term chart to find an average. This is a key number in investing, known as an average compounded annual growth rate or compounded annual return. The chart below outlines the averages of different assets that we have already discussed. This return percentage is an estimate of what we can expect to gain annually from our assets. Please note that this is an average, meaning the actual yearly gains may often be much larger or smaller than the stated number. This is why it is so important to invest for the long term.
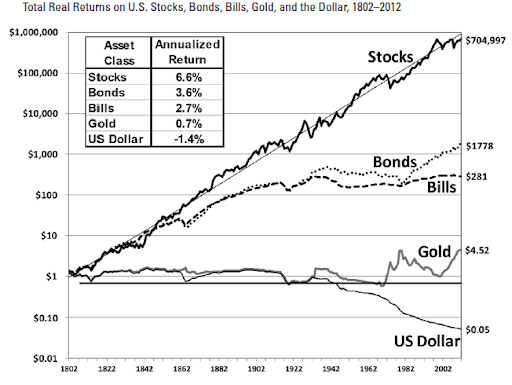
In the second chart, you will also see these assets plotted on a graph, showing the prospective growth of a $1 investment in 1802. While this is an extreme example, as no one alive in 1802 is alive today, it is illustrative of the power of compound interest and asset ownership. I’m sure the assets plotted here are familiar to you by now. REITs are real estate, gold and oil are commodity alternatives, the S&P 500 is stock, and so on and so forth. All of these assets are traded in liquid markets and their returns are decided mostly by price movements. However, bonds, on the other hand, get most of their return from yield, while the initial investment amount stays the same and is paid back upon maturity. Bonds are a great asset for those who don’t like volatility and want their returns to be very predictable. We also notice that bonds return less on average than more risky, volatile assets. This is the basis of theory regarding risk and return. As a prospective investor, you must understand and plan around risk and return in your portfolio construction. Let’s do some example portfolio construction using the assets we have learned about so far. Take the portfolio below. Ava is a young woman starting off her career. She does not yet own a home. She wants to take on some risk in her investing and has decided to purchase the following assets.
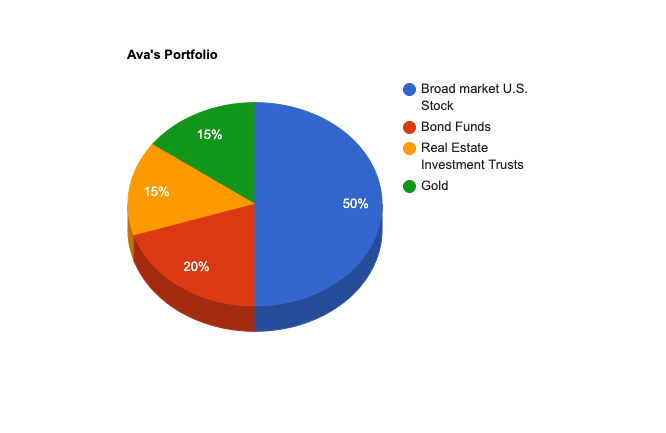
Ava’s portfolio
- Broad market U.S. Stock (50%)
- Bond Funds (20%)
- Real Estate Investment Trusts (15%)
- Gold (15%)
Here is her portfolio demonstrated in a pie chart.
What can Ava expect from this portfolio? We can estimate her compounded annual growth rate as follows. If stock makes up 50%, or .5, of Ava’s portfolio, and we use the chart above that shows a 7.87% return for stocks, we can estimate that portion of her portfolio will perform as such: (.5 x 7.87) = 3.935%. Moving along, we do the same for the remaining assets and their long-term returns.
- Bonds (20%): (.2 x 5.67) = 1.134%
- REITS (15%): (.15 x 11.23) = 1.685%
- Gold (15%): (.15 x 6.43) = 0.965%
*Please note that these are estimations. In order to receive these annual returns, we will have to own the portfolio for a longer period of time – sometimes more than 10 years.
If we add up each individual number, we come to a total of 7.72% for the portfolio. Not too shabby! Let’s take this one step further and put it into dollar amounts. Ava is in her early twenties and has a 15-year time horizon, after which she would like to sell her investments to buy a home and start a family. She has set aside three months of emergency expenses in her savings account and has $10,000 to spare for her new assets. Take a look at the figure below.
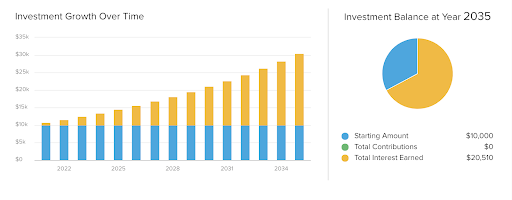
In 15 years, her $10,000 will have grown to over $30,000! Let’s also take a look at what the graph might look like if that money were to be put in a savings account, say at 2% annual interest. See below.
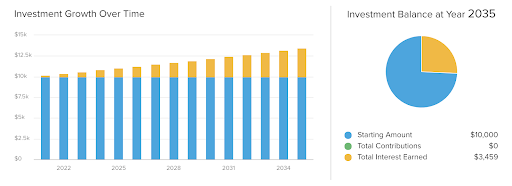
Without owning assets and having a portfolio, Ava has only made her $10,000 grow to roughly $13,500. Though she may have been hesitant at first, due to the volatility of some of the assets she purchased, she has been greatly rewarded in the long run. She has, however, had to stomach some ups and downs in her portfolio. The assets she owns altogether have exhibited great price swings over the past 15 years, which are shown below. This is a diagram of the past 15 years of Ava’s portfolio, to help you picture what changing asset prices might look like.
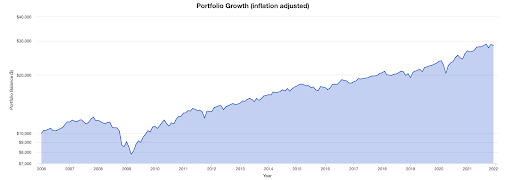
Take careful notice of how the portfolio lost close to 30% of its value in 2008 and 2009. Anyone could have become frightened and sold their assets at that point, hoping to shield themselves from further losses and at least walk away with some cash. If they had done that, though, they would have been very sorry, as the portfolio recovered and continued to increase in value for the next 12 years. Notice that just like our forward predictions for the portfolio, the past portfolio started at $10,000 and ended at just about $30,000. It never ceases to amaze me how, despite varying economic variables in an ever-changing world, assets are able to maintain their steady long-term average price increases. It might be the closest thing to magic we have.
Stands for compound annual growth rate or CAGR, this details the average annualized return of an investment over a certain number of years. If the investment has doubled in 10 years, the CAGR would find the rate at which the investment needs to grow annually to make the doubling happen.
This is the process by which an investment or loan grows its balance. Compound interest is interest or return on the aforementioned calculated based on both the initial principal and the so far accrued interest or return.
