10
Dr. Kevin Bracker; Dr. Fang Lin; and jpursley
Chapter Learning Objectives
Upon completion of this chapter, students should be able to:
- Define cost of capital and explain its relevance
- Explain basic sources of financing
- Calculate the financing weights and explain why market values are preferred to book values
- Calculate the after-tax cost of debt
- Explain why the Yield-to-Maturity is preferred to the coupon rate as the before-tax cost of debt and why debt is expressed as an after-tax cost
- Calculate the cost of preferred stock
- Calculate the cost of common stock using an average of the three different approaches (dividend valuation, SML, and bond yield plus risk premium)
- Explain why we use three different approaches for the cost of common stock financing and issues associated with each of the three methods
- Calculate the cost of capital and use it to evaluate capital budgeting projects
- Explain two key situations where the cost of capital needs modified before it can be used to evaluate capital budgeting projects
- Explain the concept of a target capital structure
- Diagram the cost of capital and value of the firm as the ratio of debt/equity increases
- Explain why the target capital structure may be different for different firms
What is the Marginal Cost of Capital?
The Marginal Cost of Capital (MCC), which is sometimes called the Opportunity Cost of Capital (OCC) or Weighted Average Cost of Capital (WACC), tells us how much we are paying for our financing. This will help us determine the required return for our investment projects. Specifically, under two basic assumptions (discussed below), the MCC will be the required return that we use when performing capital budgeting analysis from Chapter Eight.
Let’s expand on the idea that the Marginal Cost of Capital represents our cost of financing and, in turn, the required return for our capital budgeting projects. Firms need to raise capital in order to invest in various capital budgeting projects. For instance, if a company wants to spend $500 Million to launch a new satellite they need to find a way to pay for that. There are two primary ways in which companies can raise capital — (A) debt or (B) equity.
Debt
The firm can issue bonds in order to raise capital.
Equity
The firm can have stockholders provide capital in one of three ways.
PREFERRED STOCK
Issuing shares of preferred stock will help provide capital for the firm.
COMMON STOCK
Issuing shares of common stock will help provide capital for the firm.
INTERNAL EQUITY
Any profits that the firm makes and doesn’t pay out to shareholders in the form of dividends can be used to provide capital for future periods. Since this money technically belongs to existing common stockholders, it is considered a form of common stock financing. Some models separate out internally generated equity from the issuance of additional shares, however we will not do this. For the purposes of our class, we will treat both newly issued common stock and internally generated equity as the same since they both represent capital provided by common stockholders.
Once we figure out where our financing is coming from, we must figure out how much it is costing us. The details of this are discussed below. Our Marginal Cost of Capital calculation incorporates the cost from each source along with how much financing is being provided from each source. This gives us an average cost for each dollar of financing that we are using as a firm.
Once we know how much each dollar of financing is costing us, we can determine if we are using that financing appropriately. For instance, pretend that our MCC is 9.5%. Then, we have the opportunity to invest in a capital budgeting project that has an IRR of 8.5%. That means we are paying 9.5% to raise money and then investing this money to earn 8.5%. Since we are earning less on our investments than it is costing us to raise our money, the project is not worthwhile. On the other hand, if we have a project that will generate an IRR of 12% we will earn more on our investment project than it is costing us to raise our money. This makes the project profitable and we should pursue it. We cannot properly evaluate our capital budgeting projects without having a reasonable estimate of our cost of capital.
One of the themes for this chapter is that when we are estimating the costs of each source of financing, we are going to focus on estimating the required return for investors who buy those securities. The idea is that we have been focusing on stocks and bonds previously in this class from the perspective of investors. However, the return that these investors receive is paid by the corporations. Therefore, the investors’ required return is the firm’s cost of capital. This means that we are going to rely on concepts we already have covered that focus on required return, but now instead of referring to it as the required return, we will call it a cost of capital.
When is the MCC appropriately used as the required return for capital budgeting?
As mentioned previously, there are two basic conditions that must be met before we can use the MCC as the required return in capital budgeting analysis. These assumptions are as follows:
- The risk of the project must be of average risk for the firm. The MCC is influenced by the perceived riskiness of the firm as a whole. Since investors set the MCC by “charging” the firm enough to compensate for the risk of investing in the firm. The higher the perceived risk, the more investors will demand as a rate of return (cost of financing). Since the firm can be thought of as the sum of all of its various projects, then we can say that the MCC appropriately captures the risk of the average project. Many projects will be more risky or less risky than what is considered “average.” If we undertake high-risk projects, the average risk of the firm will increase (causing the MCC to increase) so we need to earn more to compensate us for the risk of that project. The opposite holds for low-risk projects. Anytime we evaluate a high-risk project we should use a required return higher than the MCC and anytime we evaluate a low-risk project we should use a required return lower than the MCC.
- The financing weights should not change in a significant manner due to financing the project. The MCC is based on the financing weights for the firm as a whole. If we alter that financing mix to undertake a project we must account for it. Therefore, if the financing weights for the project are significantly different than our present financing mix, we need to use the weights associated with the project. Another complication that is more difficult to correct is that drastically different financing weights may alter the risk of the firm and thus change financing costs. Specifically, increasing the amount of debt financing should increase the risk of the firm (and result in higher financing costs from each source of financing) while increasing the amount of equity financing should lower the risk of the firm (and result in lower financing costs from each source of financing).
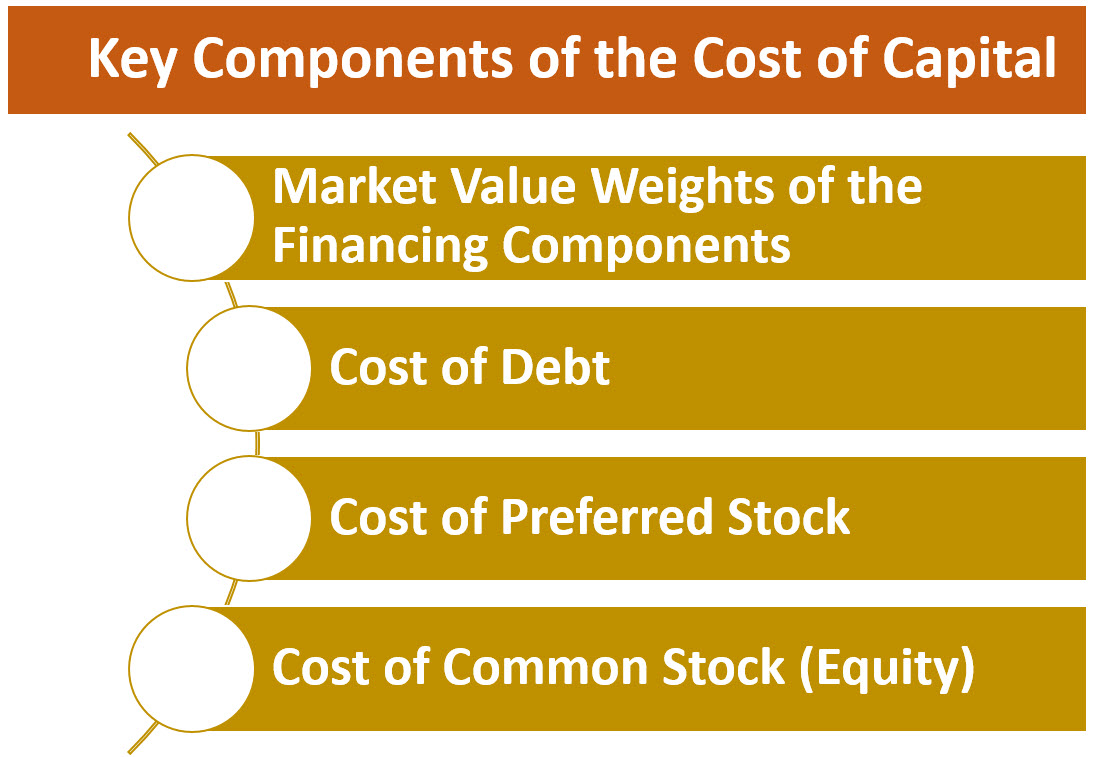
The Key Components of the Cost of Capital
There are four critical components that must be estimated in order to estimate the cost of capital.
Note: We will be ignoring the role of flotation costs for this course. However, if you are interested in this topic, an optional discussion of flotation costs is provided at the appendix of the chapter.
Once these are estimated, we use the following equation to estimate the MCC
[latex]MCC=W_{debt}k_{i}+W_{pref}k_{p}+W_{com}k_{s}[/latex]
Where
Wdebt represents the proportion of total financing coming from LT Debt
ki represents the after-tax cost of debt financing
Wpref represents the proportion of total financing coming from preferred stock
kp represents the cost of preferred stock financing
Wcom represents the proportion of total financing coming from common stock
ks represents the cost of common stock financing
Note that the weights should all be plugged into the formula as a decimal (10% = 0.10) while the costs should be written as a percentage (10% = 10)
Estimating the Market Value Weights of the Financing Components
The weights represent the market value weights of each of the components, not the book value. (Note: In many instances, the book value of debt can be a close approximation for the market value of debt. However, if we can estimate the market value we should always use it.) We first estimate the market value of debt, market value of preferred stock and market value of common stock by multiplying the number of shares (or bonds) times the value of each share (or bond). Then we sum up the value of each component. This represents the market value of the firm. The appropriate weight is the market value of that component divided by the market value of the firm. Market values are preferred because they are always current, taking into account investors’ current outlook on our firm’s prospects and risks and are the best measure of what the securities are worth.
Estimating the After-Tax Cost of Debt
The after-tax cost of debt is found through the following equation
[latex]k_{i}=YTM(1-T)[/latex]
Where
ki represents the after-tax cost of debt
YTM represents the Yield-to-Maturity on the debt
T represents the marginal tax rate on interest
It is critical to note that we must use the after-tax cost of debt as opposed to the before-tax cost of debt. Interest appears on the income statement before taxes. This means that each dollar paid in interest lowers our tax bill. The Federal government is paying part of our interest bill for us through this reduction in tax expense. Unfortunately, dividends are paid after taxes, so this adjustment is only for debt, not preferred or common stock.
In addition, it is important to note that we use the YTM here as the before-tax cost of debt instead of the coupon rate. It is easy to think that the coupon rate would be better as that is the actual dollar amount paid to investors each year. However, that ignores the true cost to the firm (return to the investor). If investors pay a premium to buy the bond (pay more than $1000), then the effective cost of the bond will be less than the coupon rate. Alternatively, if investors buy the bond at a discount, then the effective cost of the bond will be higher than the coupon rate. Consider a zero-coupon bond. This is not free financing just because it doesn’t pay a coupon payment. Instead, the firm will receive substantially less than $1000 per bond today, but be forced to pay out the $1000 at the bond’s maturity with the difference (spread over the life of the bond) representing the cost of interest. The YTM takes into account coupon payments and spreading the premium/discount out over the life of the bond.
While we typically will only encounter one source of debt financing in this class, it is not uncommon for firms to end up issuing many bonds with different coupons and times to maturity. In order to estimate the cost of debt in this type of situation, a weighted average of each bond can be used.
Estimating the Cost of Preferred Stock
The cost of preferred stock is found through the following equation
[latex]k_{p}=\frac{D}{P_{0}}=\frac{(par value)(dividend rate)}{P_{0}}[/latex]
Where
kp represents the cost of preferred stock financing
D represents the dividend on preferred stock (alternatively found by taking the par value times the dividend rate on the preferred)
P0 represents the current price of the preferred stock
Note that here (as with other costs), we are merely solving for the investors’ required return on preferred stock as their return is the firm’s cost of financing from preferred. One common mistake students sometimes make here is to use the common dividend instead of preferred. Be careful to use the right dividend. Another common mistake is that when this formula is applied, the answer comes out as a decimal (8% would be 0.08). Assuming you are plugging the other costs in as percent, make sure you do the same with this. You can’t enter the cost of debt as 6 (for 6%) and the cost of preferred as 0.08 (for 8%)…you need to be consistent.
Estimating the Cost of Common Stock
Common stock gets a little trickier. There is not one correct formula for estimating the cost of common stock financing. Instead there are three. First, we can go back to the constant growth pricing model and solve for ks. This will give us the following formula:
[latex]k_{s}=\frac{D_{1}}{P_{0}}+g=\frac{D_{0}(1+g)}{P_{0}}+g[/latex]
Where
ks represents the cost of common stock financing
D1 represents the forecasted dividend next year
D0 represents the current dividend
P0 represents the current price of the common stock
g represents the forecasted constant growth rate
Note that the two formulas are essentially the same. D1 equals D0(1 + g). We use the first version if we are given D1 in the problem and we use the 2nd version if we are given D0 in the problem. Be careful to read the problem carefully and choose the right version for the specific dividend provided.
Because the above formula is derived from the constant growth model, it does not work as well in non-constant growth situations. It also only works for firms that pay dividends. Therefore, while it can be useful in some situations (dividend paying firms with stable growth rates), it would be worthwhile to think about other ways to estimate the required return our common stockholders are charging to provide capital.
One alternative approach is to refer to the Security Market Line. We introduced this in Chapter Seven as a way to estimate the required return associated with common stock. This allows us to estimate the cost of stock financing using the following formula:
[latex]k_{s}=k_{RF}+\beta(\bar{k_{m}}-k_{RF})[/latex]
Where
ks represents the cost of common stock financing
kRF is the risk-free rate of interest (often approximated by the yield on 10-year Treasury Bond)
β is the beta for our firm’s stock
[latex]\bar{k_{M}}[/latex] is the expected return on the market
However, while this does not require firms to pay dividends or have stable growth rates, there is some concern as to how well the security market line holds up in practice. Therefore, like the dividend growth model, the SML approach is not perfect. Is there another way we can estimate the cost of common stock financing?
A less theoretical, but still valid, model can also be used to estimate what investors are demanding as appropriate compensation for providing equity capital to the firm. This model simply assumes that stocks are riskier than bonds, so adds a risk premium to the Yield-to-Maturity on our bonds. The exact risk premium to be added is open for debate and will fluctuate based on many factors (economy, investor demographics, etc), however a range of 3% to 7% is probably most appropriate. Thus, we get the following formula
[latex]k_{s}=YTM+Risk Premium[/latex]
Where
ks represents the cost of common stock financing
YTM represents the Yield-To-Maturity on our firm’s debt financing
Risk Premium represents the risk premium on stocks over bonds
This model is also flawed. Specifically, it is not clear exactly what the risk premium for stocks should be. Second, firms that don’t use long-term debt financing (and there are quite a few firms that do not use long-term debt financing) won’t have bonds outstanding for us to estimate their YTM. Therefore, we have to guess at what their YTM would be (which would introduce more error) or skip this model.
The best approach when estimating the cost of equity financing is to estimate it under all three equations (assuming we can), then take an average of the three methods. However, we may run into a situation where one of the methods produces an answer way out of line with the other two. In this case, it is probably best to eliminate the outlier and only use the two “more reasonable” answers. Also, in some instances, we may not be able to use one of the three cost of equity approaches. In these cases, we just rely on an average of the one’s we can estimate.
MCC Example
Calculate the Marginal Cost of Capital Based on the following information.
| Price per share of Common Stock | $45 |
| Price per share of Preferred Stock | $60 |
| Price per Bond ($1000 par value) | $865 |
| Number of shares of Common Stock Outstanding | 2,300,000 |
| Number of shares of Preferred Stock Outstanding | 500,000 |
| Number of Bonds Outstanding | 60,000 |
| Coupon Rate on Bonds | 5% |
| Time Remaining Until Maturity for Bonds | 15 years |
| Marginal Tax Rate | 25% |
| Par Value of Preferred Stock | $50 |
| Dividend Rate on Preferred Stock | 9% |
| Common Stock Dividend (D1) | $3.00 |
| Dividend Growth Rate (Common) | 6% |
| Risk-Free Rate | 5% |
| Beta | 1.2 |
| Expected Return on the Market | 12% |
| Risk Premium on Stocks over Bonds | 4.50% |
Step 1: Find the Weights
MVdebt =60,000*865 = $51,900,000
MVpreferred = 500,000*$60 = $30,000,000
MVcommon = 2,300,000*45 = $103,500,000
MV TOTAL = $185,400,000
Wdebt = 51,900,000/185,400,000 = 0.28
Wpref = 30,000,000/185,400,000 = 0.16
Wcom = 103,500,000/185,400,000 = 0.56
Step 2: Find the after-tax cost of debt
Find YTM
Set Financial Calculator to 2 Periods Per Year
30 N
-865 PV
25 PMT
1000 FV
Solve for I/Y = 6.41%
Convert to After-tax Cost ki = YTM*(1-T)
ki = 6.41%*(1 – 0.25)
ki = 4.81%
Step 3: Find the cost of preferred stock
kp = D/P
kp = ($50*.09)/$60
kp = $4.50/$60
kp = 7.50%
Step 4: Find the cost of common stock
Method One — Dividend Valuation Approach
ks = (D1/P) + g
ks = ($3.00/$45.00) + 0.06
ks = 0.0667 + 0.06
ks = 12.67%
Method Two – Security Market Line (SML)
[latex]k_{s}=k_{RF}+\beta(\bar{k_{m}}-k_{RF})[/latex]
ks = 5% + 1.20(12% – 5%)
ks = 5% + 1.20(7%)
ks = 5% + 8.4%
ks = 13.4%
Method Three — Bond Yield + Risk Premium
ks = YTM + RP
ks = 6.41% + 4.5%
ks = 10.91%
Take an average of the three methods to get cost of common stock financing
ks = (12.67% + 13.40% + 10.91%)/3
ks = 36.98/3
ks = 12.33%
Step 5: Calculate the MCC
MCC = (Wdebt )(ki) + (Wpref)(kp) + (Wcom)(ks)
MCC = (0.28*4.81) + (0.16*7.50) + (0.56*12.33)
MCC = 1.35 + 1.20 + 6.90
MCC = 9.45%
Capital Structure
It is important to note that the firm can influence its cost of capital by altering the weights of their financing mix. Specifically, they can use more debt financing (issue bonds, buy back stock, pay higher dividends to reduce internally generated capital, etc.) or use more equity financing (buy back bonds, issue more common stock, pay fewer dividends to increase internally generated capital). Changing this mix (referred to as capital structure) will change the firm’s cost of capital. At first glance, we might think that using more debt financing is always better. This is because debt financing (due to the interest tax shield of debt and the idea that bonds are less risky for investors) is a cheaper source of financing than common stock (equity) financing. However, while bonds are less risky than stocks from the perspective of the investor, using debt financing actually increases the risk of the firm. The reason for this is that firms have to be able to make interest payments or bondholders can force the firm into bankruptcy. On the other hand, dividends are optional. While firms are reluctant to cut dividends, they can do so when faced with financial distress in order to stay solvent.

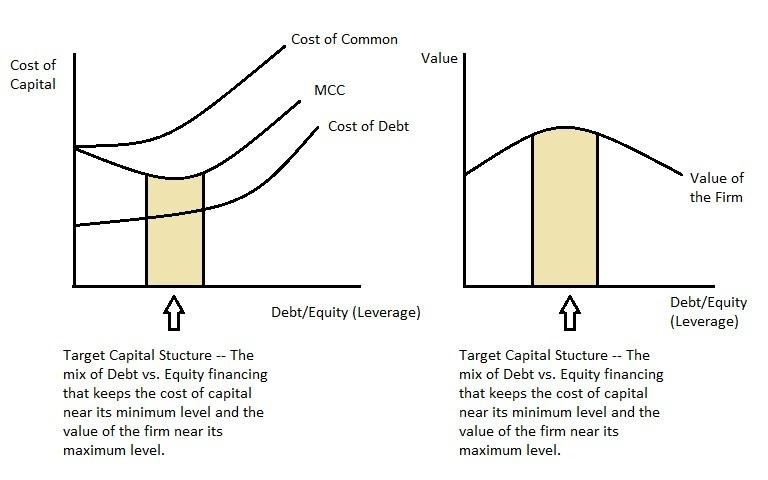
There are two counterbalancing forces when firms alter their capital structure. Initially, using debt can lower the firm’s cost of capital by taking advantage of the lower-cost characteristics of debt financing (relative to equity). However, if too much debt is taken on, the increased risk of the firm will cause the cost of equity and the cost of debt to rise (as investors demand higher compensation for investing in a riskier firm) and start to cause the cost of capital to rise. Therefore, the optimal mix of debt vs. equity (capital structure) is the level at which the cost of capital is minimized. When this occurs, the value of the firm (shareholder wealth) will be maximized. This level will vary from firm-to-firm. For example, firms that are very profitable with high effective tax rates and also very stable will tend to find their optimal capital structure having higher debt levels (they get more of the tax benefits of debt and the risk of additional leverage is lower due to the predictable cash flow generation). On the other hand, firms that are less profitable, face lower effective tax rates, or have higher levels of business risk will tend to find that their optimal capital structure involves less debt (they get less tax benefits of debt and are more susceptible to the higher risk of additional leverage).
One final note here is that the target capital structure is more of a range than a precise point. Because it is hard to estimate the exact optimal mix for each firm and because weights (based on market values) are constantly fluctuating, most firms try to identify a range where there cost of capital is near the minimum point and, in turn, the value of the firm is near the maximum point. The following diagrams illustrate the capital structure issue graphically.
Graph: Target Cost of Capital
Key Takeaways
Firms raise capital from investors in the form of debt and equity with the intention of investing that capital into developing products and services for customers. Back in Chapter One, we introduced the goal of maximizing shareholder wealth and, in order to accomplish this goal, the firm needs to invest this capital in such a manner as to ensure that the return generated exceeds the cost of acquiring the capital. To evaluate this, the firm needs to be able to estimate their marginal cost of capital. This is done by determining the market value weights of the appropriate financing sources and the costs of the individual financing sources. These values are then used to create a weighted average to estimate the firms cost of capital. It is important to remember that the appropriate cost of each financing source is effectively the required return demanded by investors. However, there are some challenges that occur in that we need to acknowledge that interest expense is a pre-tax expense, so the cost of debt needs to reflect the interest tax shield. In addition, the cost of common is difficult to model precisely, so we often use an average of multiple methods in order to try to get a more reliable estimate. Finally, it is important to recognize that the cost of capital will vary depending on the mix of debt vs. equity financing (capital structure) that the firm chooses. Therefore, firms need to reflect on how their decision related to capital structure can be optimized to keep the cost of capital low and the value of the firm high.
Exercises
Question 1
Why do we need to convert debt to an after-tax cost when preferred stock and common stock do not take this same conversion?
Question 2
Why is the cost of common stock the highest of the three types of financing and the cost of debt the lowest?
Question 3
What advantage do we get from using three different methods to calculate the cost of common stock financing?
Question 4
Why is the YTM used as the before tax cost of financing rather than the coupon rate?
Question 5
Should we use market values to estimate our financing proportions or book values? Why?
Question 6
Why is the MCC important? What is it used for?
Question 7
To use the MCC as the required return in our capital budgeting analysis, what two conditions must be met?
Question 8
If a firm can lower their cost of capital, all else equal, this should result in an increase in the value of the firm. True or False? Explain.
Question 9
If debt is the cheapest form of financing, then issuing more debt should automatically lower our cost of capital. True or False? Explain.
Problem 1
Assume our company has a bond outstanding with 20-years remaining until maturity. This bond has a 7.5% coupon rate. Our marginal tax rate is 35%. Find our after-tax cost of debt if the bond price is:
1a. $1135
1b. $875
Problem 2
If the par value of our preferred stock is $30 and the dividend rate is 5% of par while the current price is $16.50, what is the cost of preferred stock?
Problem 3
The price of our common stock is $25. The constant growth rate in dividends is 8% and our current dividend (D0) is $0.75. Also, the risk-free rate of interest is 5% and the expected return on the market is 12%. Beta for this stock is 0.8. Finally, we estimate a risk premium of 5% for stocks relative to bonds and the current YTM on our long-term debt is 9%. Find the estimated cost of capital for common stock under each of the 3 methods.
Problem 4
You have the following information about XYZ Corp:
| Asset | Book Value | Market Value |
| Bonds | $20,000,000 | $24,000,000 |
| Preferred Stock | $4,000,000 | $5,000,000 |
| Common Stock | $10,000,000 | $35,000,000 |
| Constant growth on common | 6.5% |
| YTM on bonds | 11% |
| Beta | 1.35 |
| Treasury bond yield | 5% |
| Price of common stock | $34 |
| Tax rate | 40% |
| Coupon rate on bonds | 10% |
| Risk prem. stocks over bonds | 5% |
| Expected market return (km) | 12% |
| Expected Common Dividend (D1) | 2.75 |
| Number of pref. shares | 100,000 |
| Per share dividend on preferred | $6.50 |
4a. What is the marginal cost of capital for this firm?
4b. If you have a capital budgeting project that will generate after tax cash flows of $25,000 per year for the next four years and costs $75,000, should you take it?
Problem 5
The following information is available about ACME Inc.
Balance Sheet:
| LT 10% Coupon Bonds (10,000 bonds) | $10,000,000 |
| Preferred Stock (40,000 shares) ($50 par with a 10% dividend) |
2,000,000 |
| Common Stock (1,000,000 shares) | 20,000,000 |
The market values are $1060 for each $1000 par value bond, $53 for each share of preferred, and $41.25 for each share of common. The bonds are recorded on the balance sheet at their par value and mature in 10 years.
| Beta | 1.3 |
| Current Treasury bond rate | 6% |
| Risk Premium for stocks over bonds | 5% |
| Tax Rate | 40% |
| Growth rate in dividends | 10% |
| Expected market return | 13% |
| Dividend (D0) | 2.25 |
5a. What are the appropriate weights for the opportunity cost of capital?
5b. What are the appropriate costs of debt, preferred, and common (use an average of the 3 methods for common)?
5c. What is the marginal cost of capital?
