4
Dr. Kevin Bracker, Dr. Fang Lin and Jennifer Pursley
Chapter Learning Objectives
After completing this chapter, students should be able to
- Define valuation and identify the three steps in the valuation process
- Apply the three-step valuation process to bonds
- Calculate the value of a bond given the coupon rate, required return, and time to maturity of the bond
- Identify the three primary relationships between bond prices and interest rates
- Explain the concept of the yield-to-maturity and calculate the yield-to-maturity for a bond given the bond’s price, coupon rate and time to maturity
- Explain the concept of a call provision
- Calculate the yield-to-call for a bond given the bond’s price, coupon rate and time until first call date
- Identify which is more relevant to an investor regarding the coupon rate, yield-to-maturity, and yield-to-call
- Define key bond terms
Valuation Concepts
Valuation Definition – The value of any financial asset/security is equal to the present value of all cash flows which that asset/security will generate over its lifetime discounted back to today at an appropriate discount rate.
A financial security refers to an instrument such as a stock or bond that represents a financial claim against assets. The primary difference among different assets/securities (such as stocks vs. bonds vs. corporate projects) is that each asset/security will have a different cash flow stream and a different discount rate depending on the riskiness of that cash flow stream. For example, as was covered in Chapter One, bonds typically have a fixed cash flow stream over a finite time horizon while stocks typically have a variable cash flow stream over a potentially infinite time horizon. Stocks also tend to be riskier than bonds, which results in investors demanding higher rates of return to compensate for the additional risk. While financial securities may have different characteristics, the concept of valuation is essentially the same regardless of the specific security.
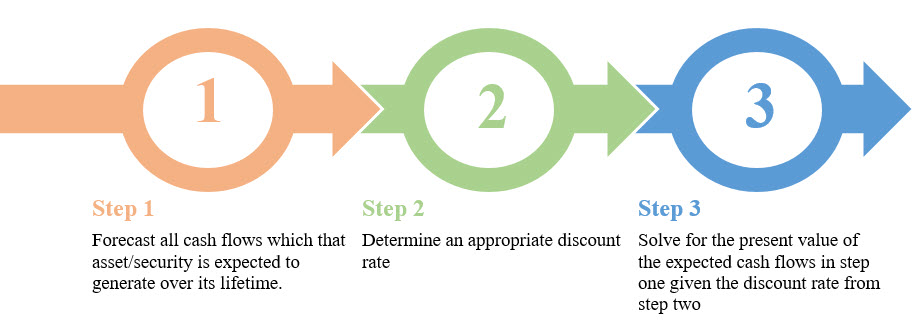
Three-Step Valuation Process
While the definition above is more conceptual, we can easily turn it into an applied process to value all stocks, bonds, or other investment opportunities. The process is as follows:
- Forecast all cash flows which that asset/security is expected to generate over its lifetime.
- Determine an appropriate discount rate
- Solve for the present value of the expected cash flows in step one given the discount rate from step two.
 What changes as we deal with different stocks, bonds, and other investment opportunities is not the process, but how we apply the process. For instance, estimating the cash flows for bonds is simple as the cash flow is generally fixed in size and covers a specific, finite time. On the other hand, estimating the cash flow stream for stocks is trickier because the cash flows are usually variable and potentially infinite. As stocks tend to be riskier than bonds, a higher discount is usually applied. Finally, solving for PV is a straightforward application of the 5-key approach for bonds while it typically involves formulas and/or the cash-flow worksheet for stocks.
Bond Pricing
As stated above, the value of a bond is equal to the present value of the cash flows that the particular bond will pay. Bonds pay cash flows in two different ways. First, bonds pay a coupon payment. Typically, every six months the bondholder receives a coupon payment determined by the stated coupon rate. When bonds are issued, they state the coupon rate which typically (in this class we will assume always) remains fixed over the life of the bond. This is the percentage of par value that the bondholder will receive in annual interest payments (while technically different bonds may have different par values, most corporate bonds have a standard par value of $1000 which we will use as the standard for this class…always assume the par value is $1000 unless specifically stated otherwise). To calculate the amount the bondholder will receive every six months, just take the annual payment and divide by two. In addition to the coupon payment, at the end of the bonds life the bondholder will receive the par value ($1000). Sometimes this par value is referred to as maturity value or face value. Thus, to find the price (or value) of a bond (B0), we want to find the present value of the coupon payments and the par value.
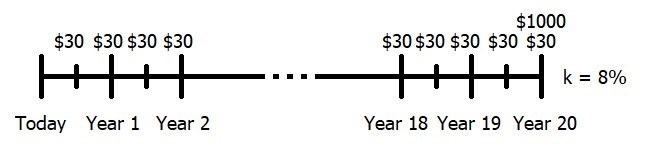
Consider the following example which we will walk through using the financial calculator. I want to purchase a bond that pays a 6% coupon and want to earn an 8% return on my investment. The bond has 20 years remaining until maturity. The first thing I need to do is figure out what my coupon payment is going to be.
Annual Coupon ⇒ 0.06*$1000 = $60
Semi-Annual (every 6 months) Coupon ⇒ $60/2 = $30
This tells me that I am going to receive an interest payment of $30 twice per year for each of the next 20 years plus at the end of the 20th year, I will receive $1000. This is my cash flow stream which must be discounted back to today at the 8% required return that I want to receive.
 Because I am receiving 2 coupon payments each year, I must be careful to set my calculator to 2 periods per year (and remember that now N represents the number of periods – 40 – instead of the number of years – 20.) This is done as follows:
Financial Calculator:
2 P/Y
40 N
8 I/YR
30 PMT
1000 FV
Compute PV ⇒ $802.07
In other words, if we require an 8% return on this bond we would be willing to pay no more than $802.07 to purchase it today.
Note that the PMT and the FV are both positive. They could also both be negative. The key is to recognize that they should both be the same sign. Why is this? From the perspective of the bondholder, we will RECEIVE both an annual cash flow (the coupon payment ⇒ PMT) and a single cash flow at maturity (the par value ⇒ FV). Since we receive these, they should be positive. If we took the perspective of the bond ISSUER, both of these would be payments and thus be negative. The key is that both the PMT and the FV are flowing in the same direction and thus must have the same sign
One thing that can be confusing with bonds is that there are two “rates” that are mentioned in bond pricing. The first is the coupon rate and the second is the discount rate. Note that the discount rate can take on many names — market rate of interest, interest rate, rate of return, required return and yield-to-maturity — they all mean the same thing. In order to avoid confusion, try to think of the coupon rate as a cash flow rather than a rate. The coupon rate tells us what our yearly payment will be. It is not a rate of return and it doesn’t change over time. The discount rate (market rate of interest, interest rate, rate of return, required return, and/or yield-to-maturity) tells us what rate of return we want to earn on our investment in this bond. It can (and will) change over time — sometimes increasing and sometimes decreasing — depending on market conditions.
In practice, determining the discount rate is one of the most challenging aspects for a bond investor. It primarily depends on the perceived risk of the bond and the expected inflation rate that is anticipated over the life of the bond. Note that while there are ways to approximate both of these components, they both have a subjective aspect to them. Neither the actual risk of the bond nor the realized inflation rate that will occur over the life of the bond are known today. Therefore, these values are based on educated guesses from an individual’s perspective. The market’s yield-to-maturity (a measure we will discuss shortly) provides the consensus opinion of what the appropriate required return should be.
If the bond price is trading for more than its par value (bond price is greater than $1000), the bond is said to be trading for a premium. Alternatively, if the bond price is trading for less than its par value (bond price is less than $1000), the bond is said to be trading for a discount.
The premium or discount will diminish over time as the bond approaches maturity. This is because at maturity, the bond will be worth the $1000 par value. Therefore, assuming required returns (market rates of interest) stay constant until maturity, the bond price will follow the pattern in the graph below. In practice, the lines will not be as smooth as required returns (market rates of interest) tend to fluctuate over time.
Graph: Price of Bond Selling at Discount vs. Premium over Time
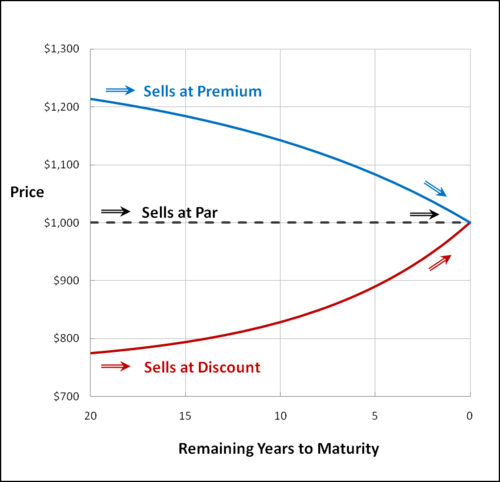
Source of Graph: Bogleheads
Video Bond Pricing
Bond Prices and Interest Rates
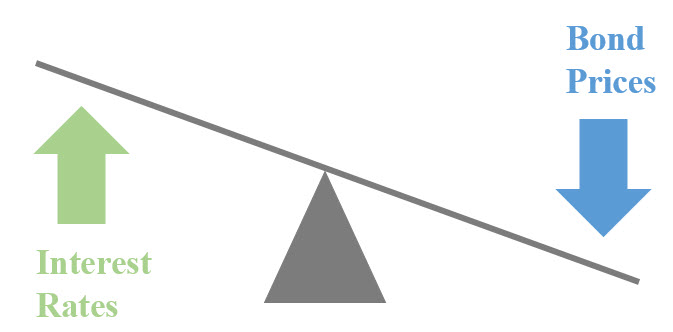 As market rates of interest rise, bond prices will fall. Alternatively as market rates of interest fall, bond prices will rise. Bond prices and the market rate of interest are inversely related. This is because the cash flow stream you receive from the bond is fixed. As market rates of interest go up, you are discounting that fixed cash flow stream back at a higher rate which makes it less valuable. As market rates of interest go down, you are discounting that fixed cash flow stream back at a lower rate which makes it more valuable. The market rate of interest is the rate of interest available on similar risk securities purchased today. Also, we can think of the Yield-to-Maturity (more on this in a minute) as the market rate of interest. Keep in mind when we say interest rates went up or down, we are talking about the YTM, NOT the coupon rate. The coupon rate does not change.
This relationship is stronger for bonds with a longer time until maturity. Therefore, a 20-year bond will have a higher premium than a similar 3-year bond after interest rates have declined. The rationale for this relates again to the time value of money. A bond with a greater time to maturity will have a longer fixed cash flow stream which means it will be affected to a greater degree by changes in interest rates. As a side note, this is a little bit of a simplification. The sensitivity to interest rates is technically affected by a combination of time to maturity and the coupon rate (duration), but that is beyond the scope of this class. For our purposes, it will suffice to know that the greater the time to maturity, the more sensitive the bond is to changes in interest rates.
This relationship is also stronger for bonds with lower coupon rates. Everything else being equal, the lower the coupon rate of a bond the more sensitive it will be (in terms of percentage changes in the bond price) to interest rate changes. Therefore, a 15-year 4% coupon bond will see a greater percentage price increase if interest rates decline than a similar 15-year 10% coupon bond.
Yield-to-Maturity (YTM)
The YTM represents the EXPECTED return on the bond if it was purchased at the current price AND held until maturity. We can also use the YTM to tell us what the current required return is for the market. We solve for this by using the same approach we used to solve for interest rates (or discount rates, rates of return, growth rates) in Chapter Three (Time Value of Money) — by solving for the I/Y with the 5-key approach on our financial calculator. We know the bond price (provides PV), coupon rate (provides PMT), number of years until maturity (provides N), and maturity (par) value (provides FV of $1000). The only thing we don’t know is the I/Y (which is the yield to maturity). In order to get the YTM, we are solving for the rate of return that makes the PV of cash flows (coupon payments and par value) equal to the current bond price (B0).
Again, let’s work through a brief example: Assume that I am considering buying a bond that pays a 7.5% coupon and can purchase this bond for $1095. If this bond has 10 years remaining until maturity, what is my YTM? Again, the first step is to find the coupon payment.
Annual coupon ⇒0.075*$1000 = $75
Semi-Annual (every 6 months) Coupon ⇒ $75/2 = $37.50
Now I know that I can buy this bond for $1095 today and in return I will receive cash flows of $37.50 twice per year for each of the next 10 years PLUS $1000 at the end of the 10th year. Remember, we are trying to find the discount rate where the PV of the cash flows is equal to $1095.
Financial Calculator:
2 P/Y
20 N
-1095 PV
37.50 PMT
1000 FV
Compute I/YR ⇒ 6.21%
Two quick notes on the YTM calculation. First, the PMT and FV must both be the same sign and opposite of the PV. This is because the bondholder will receive both the coupon payment (PMT) and the par value (FV) as a result of paying the current price for the bond (PV). Second, if the bond is trading at a premium, the YTM will be less than the coupon rate. Alternatively, if the bond is trading at a discount, the YTM will be greater than the coupon rate.
Video Yield-to-Maturity
Call Provisions
A Call Provision is a provision included in the bond indenture that gives the company that issued the bond the right, at their discretion, to purchase (call) the bond back from investors before it matures for a pre-set price. Usually the call provision does not start immediately, but becomes effective after a 5-10 year time period. Also, the pre-set price is typically (but not always) a small premium to the $1000 maturity value.
To calculate the Yield-to-Call (YTC) we approach the problem in a similar manner as the YTM, except for two differences. First, the number of years until the first call date is used as opposed to the number of years until maturity. Second, the call price (which usually includes a small premium over par value) is used instead of the maturity value.
For example, consider a bond with 20 years to maturity that has a current price of $925, a coupon rate of 5.5%, and is callable in 5 years at $1050. Find the YTC for this bond. To do this, follow the same procedure outlined above for calculating the YTM, but now the FV is $1050 instead of $1000 and the number of years is 5 (the 20 years to maturity is irrelevant in calculating the yield-to-call).
Financial Calculator:
2 P/Y
10 N
-925 PV
27.50 PMT
1050 FV
Compute I/YR ⇒ 8.19%
As with the YTM calculation, the PMT and FV should be the same sign and the opposite of the PV sign when solving for the YTC.
At this point, there may be some confusion as to why there are potentially three different “rates” associated with a bond. There is the coupon rate, the yield-to-maturity, and (if the bond has a call provision) the yield-to-call. From an investor’s perspective, how do we know which of these rates to focus on? First, remember the discussion from earlier in the chapter regarding the coupon rate and the discount rate. We said that the discount rate (yield-to-maturity or market rate of interest) was the correct “rate”. The reason for this is that the coupon rate does not reflect a rate of return, but tells you how much you will receive for the annuity stream portion of the bond. A 6% coupon bond may offer an investor a greater rate of return than an 8% coupon bond if he can buy the 6% coupon bond cheap enough relative to the price of the 8% coupon bond. His return depends not only on what cash flows he receives, but on how much he paid for them. The YTM incorporates not only the coupon payments, but also the price he paid to receive them and how long he anticipates receiving them. It therefore provides more information and is more meaningful.
What about the YTM vs. the YTC? Here, we need to remember that the investor doesn’t decide whether or not to call the bond, the issuer does. Assume that you are borrowing money and are paying an interest rate (YTM) of 8.5%. Alternatively, if you pay the loan off early (even if you need to borrow money to do so) and it lowers your effective rate of interest to 6%, would you want to do so? Certainly. This is why people refinance their mortgage when interest rates decline. Since the issuer makes the decision on whether or not to call the bond, the issuer will only do so if it is to the issuer’s advantage. Note that people don’t rush out to refinance their mortgages when interest rates are rising. Therefore, if the YTC is less than the YTM, the bond is more likely to be called (to save the issuer interest expense). This means that the investor is more likely to receive the YTC. On the other hand, if the YTC is higher than the YTM, the bond is not likely to be called. This means that the investor is more likely to receive the YTM. In other words, the lower of the two rates (YTC or YTM) is the one that the investor is more likely to receive and therefore is the more meaningful rate of return.
Video Yield-to-Call
Zero Coupon Bonds
Zero coupon bonds are really quite easy. Essentially, as the name implies, they are bonds that pay no coupon payments. Thus, they are bought today and at maturity the bondholder receives the maturity value (typically $1000). Since there are no coupon payments, these bonds will always be purchased for less than maturity value. Therefore, an investor’s return comes from the difference between what she paid for the bond and the maturity value she will receive when the bond matures (or the value she gets for selling the bond prior to maturity). This difference is referred to as the discount. If interest rates do not change between the time the bond is purchased and the time it matures, the value of the bond will gradually increase as it approaches maturity. However, interest rates rarely remain unchanged. These interest rate fluctuations will cause the bond value to increase or decrease over the life of the bond, but the long-term trend will always be upwards as the bond will pay $1000 upon maturity (assuming the bond doesn’t default).
Pricing and finding the YTM for a zero coupon bond is quite simple. Just use the process for pricing normal bonds, except plug in a zero for the coupon payment.
Zero coupon bonds are even more sensitive than ordinary bonds to interest rate changes. To verify this consider two bonds with 30 years to maturity. Let one be zero coupon bond and the other an 8% coupon bond. Then calculate their prices when the current market rate of interest is 8%. You should get $95.06 (even though there are no coupon payments, we keep the semi-annual — 2 periods per year — discounting for consistency) for the zero and $1000 for the 8% coupon. Please try these on your own before checking the solution below.
Financial Calculator:
| Zero Coupon Bond | 8% Coupon Bond |
| 2 P/Y 60 N 8 I/YR 0 PMT 1000 FV Compute PV ⇒ $95.06 |
2 P/Y 60 N 8 I/YR 40 PMT 1000 FV Compute PV ⇒ $1000 |
*Note that the 8% coupon bond discounted at a market rate of interest gives you a price of $1000. This will always be the case – when the market rate of interest equals the coupon rate, the bond price will trade at par value ($1000).
Now, how much will prices fall if the market rate of interest falls to 7%. This time you should get $126.93 for the zero and $1124.72 for the 8% coupon. Note that the decline in interest rates caused the zero coupon bond to increase in value by 33.5% [($126.93 – $95.06)/$95.06] while the 8% coupon bond only increased by 12.5% [($1124.72 – $1000)/$1000]. Don’t take my word for these numbers, do them yourself.
Many of you likely own now or, at one time, previously owned a form of zero-coupon bond. Most US Savings Bonds are zero-coupon in nature. The big difference is that most zero-coupon bonds mature for $1000 while US Savings Bonds earn interest for 30 years and may mature for much more than their stated value. If you have some US Savings Bonds and you are curious as to what they are worth, you can go to the US Savings Bond Calculator provided by the US Treasury.
Bond Ratings and Default Risk
One of the big factors impacting the required return associated with bonds is the default risk associated with the bond. Bond default does not imply that the bondholder will lose her entire investment. Instead, it means that the bond issuer cannot meet the specific terms associated with paying the bond coupon payments and/or principal. At this point, bondholders can force the firm into bankruptcy proceedings or reach a mutual settlement with the firm accepting a restructured payment plan.
The default risk associated with a bond varies dramatically based on the specific issuer. Bonds issued by the US Treasury are often assumed to be free of default risk (or have extremely little default risk). Alternatively, bonds issued by corporations depend on the financial stability of the firm that issued the bond. Since many individual bondholders lack the resources to carefully evaluate the financial stability of each issuer, there are bond ratings agencies (such as Standard and Poor’s, Moody’s, and Fitch) that provide bond ratings to investors. These bond ratings are essentially grades that indicate the potential default risk associated with the bond. While each rating agency uses slightly different processes and grading systems, essentially a AAA-rating is considered the gold-standard and a rating of C or D indicates a company either already in default or likely to be there soon. The following links take you to an overview of the rating definitions for the three big ratings agencies:
• Moody’s Ratings Brief Explanation
• Standard and Poor’s Ratings
• Fitch’s Ratings
Standard and Poor’s Bond Rating Scale
| Ratings |
Explanations |
| AAA | Extremely strong capacity to meet financial commitments. Highest Rating. |
| AA | Very strong capacity to meet financial commitments. |
| A | Strong capacity to meet financial commitments, but somewhat susceptible to adverse economic conditions and changes in circumstances. |
| BBB | Adequate capacity to meet financial commitments, but more subject to adverse economic conditions. |
| BB | Less vulnerable in the near-term but faces major ongoing uncertainties to adverse business, financial and economic conditions. |
| B | More vulnerable to adverse business, financial and economic conditions but currently has the capacity to meet financial commitments. |
| CCC | Currently vulnerable and dependent on favorable business, financial and economic conditions to meet financial commitments. |
| CC | Currently highly vulnerable. |
| C | Currently highly vulnerable obligations and other defined circumstances. |
| D | Payment default on financial commitments. |
Ratings from ‘AA’ to ‘CCC’ may be modified by the addition of a plus (+) or minus (-) sign to show relative standing within the major rating categories.
Shaded portions of the tables indicates “junk bond” status
Source – Standard and Poor’s Credit Ratings Definitions & FAQs
Because default risk is one of the main sources of risk associated with bonds (along with the price risk associated with changes in interest rates), the required return of a bond is highly dependent on the bond rating. All else equal, the lower the bond rating, the greater the default risk. As investors are risk averse, higher default risk implies higher required returns. Since bond prices are inversely related to the required return, improvements in bond ratings will cause prices to rise and drops in bond ratings will cause bond prices to fall. Also, bonds with lower bond ratings (more default risk) will have higher expected returns. This does not make these bonds better or worse investments. Instead, these bonds (sometimes referred to as junk bonds) just have a different risk-return profile than investment grade bonds. The single B vs. double B rating grade is the general distinction between investment grade bonds vs. junk (or high-yield) bonds. However, even within each category there will be variation in expected returns associated with these bonds. The following chart shows historically how the spread between AAA vs. BBB bond yields have fluctuated over time. As you can see, the AAA is always less than the BBB, but the spread between the two yields varies significantly through the years.
Graph: Historical Yields for AAA and BBB Bonds
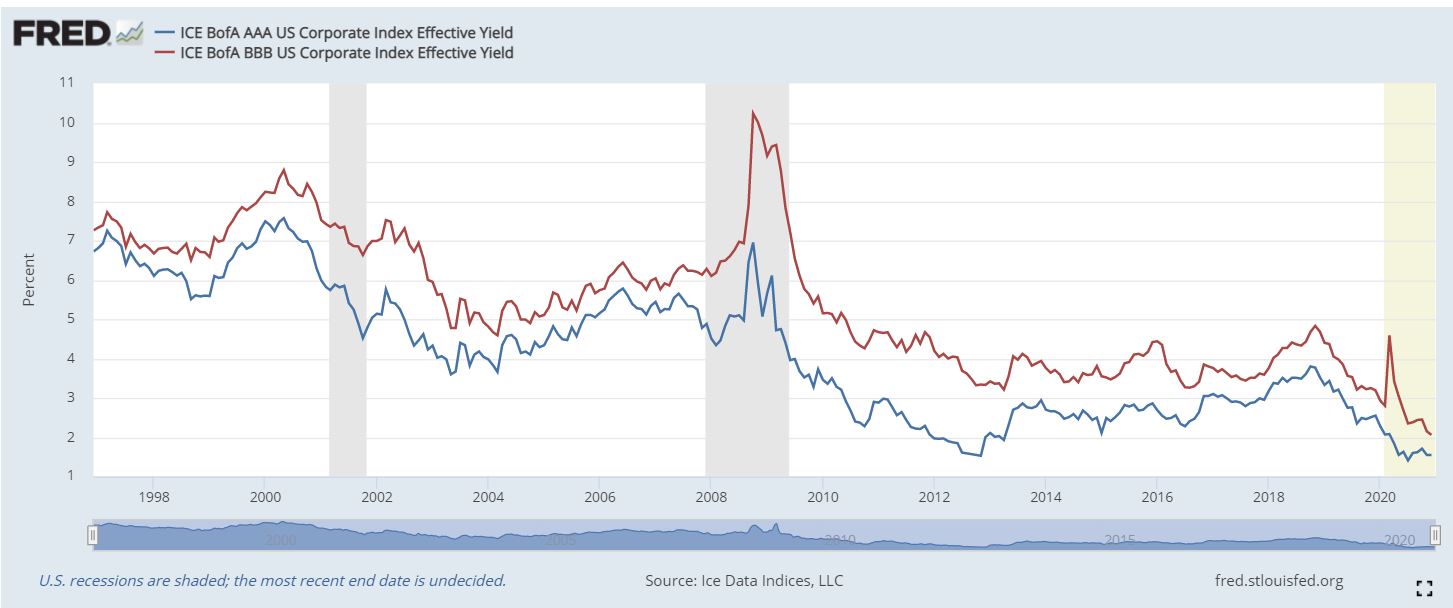
Source of BBB Graph: Fred
Source of AAA Graph: Fred
Key Takeaways
Valuation is a fundamental concept in finance that is based on the present value of the future cash flows which a security will generate. Because of their structure, a fixed cash flow stream over a finite time horizon, bonds provide a reasonably straightforward security in which to initially apply valuation analysis. As demonstrated above, the value of a bond moves inversely to the market rate of interest so that as interest rates fall, bond prices rise and vice-versa. Also, given the current price of a bond, the expected return of that bond, either the yield-to-maturity or yield-to-call, can be calculated. The required return on bonds is a primarily a function of anticipated inflation over the life of the bond and the risk of the bond. The primary risk factor is default risk which is approximated through bond ratings.
Exercises
Question 1
What is the three step approach for security valuation and how do I apply it to bond pricing?
Question 2
What is the relationship between market rates of interest and bond prices?
Question 3
How does the length of time until maturity for a bond impact the relationship between market rates of interest and bond prices?
Question 4
If a bond will pay me $1000 upon maturity, why would I ever be willing to pay a premium to purchase it today?
Question 5
What is a call provision?
Question 6
What is more relevant to an investor
6a. Yield-to-Maturity or Coupon Rate?
6b. Yield-to-Maturity or Yield-to-Call?
Question 7
Why are bond ratings important?
Question 8
Which bond should have a higher YTM:
- A 20-year bond with a AA rating, or a 20-year bond with a BB rating?
- A 30-year bond with an A rating or a 5-year bond with a BB rating?
Question 9
Because junk bonds have a higher probability of default than investment-grade bonds, they are a poor investment tool and we should expect to earn lower rates of return on them. True or False? Explain.
Question 10
Which is more sensitive to a change in interest rates, a zero-coupon bond or a 10% coupon bond? Why might this be?
Question 11
Would you ever pay more than $1000 to buy a $1000 non-convertible zero coupon bond? Explain.
Problem 1
Find the price for a 7.5% coupon bond under the following conditions.
1a. 30 years to maturity, required return is 9%
1b. 30 years to maturity, required return is 7.5%
1c. 30 years to maturity, required return is 6%
1d. 10 years to maturity, required return is 9%
1e. 10 years to maturity, required return is 7.5%
1f. 10 years to maturity, required return is 6%
1g. 2 years to maturity, required return is 9%
1h. 2 years to maturity, required return is 7.5%
1i. 2 years to maturity, required return is 6%
Problem 2
The current price of a 4.25% coupon bond with 10 years to maturity is $918.23, what is the YTM?
Problem 3
The current price of a 9.75% coupon bond with 20 years to maturity is $1318, what is the YTM? If the bond contains a call provision that allows the company to call the bond for $1050 7-years from now, what is the YTC? Based on the available information, is this bond likely to be called?
Problem 4
Find the price of a 20-year zero coupon bond if the required return on such a bond was 12%? What if the required return was 10%?
Problem 5
Ten years ago you purchased a 30-year 9% coupon bond. At that time, the market rate of interest was 6.5%. Today, you sell the bond (the current market rate of interest is 10.5%).
5a. How much did you pay for the bond when you purchased it 10 years ago?
5b. How much can you sell the bond for today?
5c. What rate of return did you earn on your investment over the 10-year period that you held the bond?
Solutions to CH 4 Exercises
Student Resources
Bond Ratings Scales in Appendix B
