5
Dr. Kevin Bracker, Dr. Fang Lin and Jennifer Pursley
Learning Objectives
After completing this chapter, students should be able to
- compare and contrast the application of the three-step valuation process to stocks relative to the application to bonds
- define preferred stock
- calculate the value of a stock based on the present value of dividends using the no-growth model, constant-growth model, and non-constant-growth model
- define the concept of market efficiency
- differentiate and identify situations which violate/support weak-form, strong-form, and semi-strong-form market efficiency
- explain the rationale and implications behind market efficiency
- define par value, book value and market value as these terms relate to common stock and identify the relative importance of each
- identify the rights and privileges associated with ownership of common stock
- discuss how the valuation of stock in practice is more complicated and imprecise than textbook models.
Stock Valuation
When we developed the formula to price bonds, it was a straight-forward application of the time value of money concepts. The bond produces a series of simple cash flows – fixed interest payments twice per year and a maturity value of $1000 at the end of the bond’s fixed life span. However, stocks have no expiration or maturity date. Therefore (at least theoretically) the cash flow (dividend) stream extends into infinity. Also, the dividends are MUCH more difficult to project than are the interest payments as dividends can increase, decrease or be stopped entirely (although corporations are reluctant to lower or stop dividends unless absolutely necessary for their survival). Therefore, stocks require a slightly different application of the time value of money concept.
While it is not likely that any person will hold a stock forever (unless that person has discovered the secret of immortality), the valuation process using an infinite cash flow stream remains appropriate. If I buy a stock today based on the present value of the expected cash flows and only plan to hold the stock for three years, why am I concerned with the dividends that will be paid after year three? The answer is simple. If I plan to sell the stock after the three years, I’m going to have to find a buyer. How much will that buyer pay me? According to our framework, the buyer will pay the present value (at the time she buys the stock) of the expected cash flow stream. Therefore, what the buyer will be willing to pay me depends upon the expected dividends from years 4 and on. Since those later dividends will affect the price at which I can sell the stock, I must factor them into my analysis. By finding the present value of ALL expected cash flows (dividends) that the stock will pay, my holding period becomes irrelevant. Whether I want to hold the stock for one day or twenty years, it is worth the same to me.
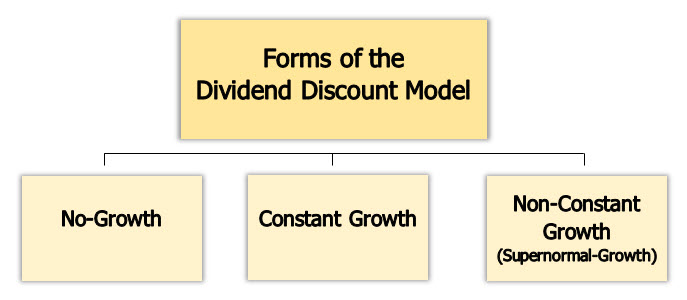
Stock valuation based on the dividend discount model typically takes one of three forms depending on what pattern we expect the dividends to follow. These three model variations are (1) the no-growth case, (2) the constant-growth case, and (3) the non-constant-growth (or supernormal-growth) case. There are a couple of other variations, but these three provide a solid foundation. Remember, all three methods do the same thing — forecast a cash flow stream (dividends) that will be paid to stockholders and then discount that cash flow stream back to the present to see what the stock is worth today.
In all models below, we assume that the current dividend has just been paid (immediately before we buy the stock) and our first dividend received will be one year from today. We also assume that dividends are paid annually instead of quarterly or semi-annually. These assumptions make the application of time value of money simpler. While they may not be realistic, they do not greatly alter the results and therefore are worthwhile simplifications.
No Growth
If we have a stock with no growth in its dividends over time, the infinity issue is solved with a perpetuity. The stockholder will receive the same dividend every year (an annuity) that lasts forever. This is the perpetuity concept that was introduced in the Time Value of Money chapter. The most common example of a no growth stock is a PREFERRED STOCK.
Preferred Stock is somewhat of a hybrid between a common stock and a bond. Preferred stock typically has (a) no voting rights, (b) an infinite maturity, (c) pays dividends as a percentage of par value, and (d) falls between bonds and common stock in the priority of claims. Preferred pays a dividend (which unlike interest can be skipped if the firm needs to preserve capital in hard times), which creates more risk than bonds. However, these dividends are fixed and must be paid before dividends on common, which creates less risk than common. Many firms do not issue preferred stock.
A preferred stock typically pays a fixed dividend (a percentage of its par value), that does not change over time. However, there are some instances where a common stock at least approximates the no-growth pattern.
According to the no-growth model, to find the value of the stock, we just take the current dividend and divide by the required return (remember, it’s just a perpetuity — an infinite annuity — since the stock has no maturity date and the dividend is not expected to increase or decrease in value). This is written below
[latex]P_{0}=\frac{D_{1}}{k}[/latex]
where
P0 represents the current value (price today)
k represents the required return and
D1 represents the dividend
Note: While we designate next year’s dividend in the formula, this is just to be consistent with the later models. Since there is no growth, all the dividends are the same regardless of which year we are referring to.
Example: Preferred Stock Valuation Using the No Growth Model
Consider the following example with a preferred stock. Assuming that a preferred stock has a par value of $75, pays a 10% dividend and you have an 8% required return, what is this stock worth to you?
[latex]P_{0}=\frac{D_{1}}{k}=\frac{Par Value * Dividend Rate} {k}=\frac{\$75*0.10}{0.08}=\frac{\$7.50}{0.08}=\$93.75[/latex]
Video Preferred (No Growth)
Constant Growth
While it is possible for a common stock to have a constant dividend over time, it is not likely. Companies tend to grow and expand, which usually results in dividends growing over time. However, if dividends don’t remain constant we can no longer use a perpetuity formula. Also, since the dividend stream doesn’t end, we can’t use the standard time value of money process. Luckily, as long as the growth rate remains constant over time and is less than the required return, there is a simple formula we can use to find the present value.
[latex]P_{0}=\frac{D_{1}}{(k-g)}[/latex]
or
[latex]P_{0}=\frac{D_{0}(1+g)}{(k-g)}[/latex]
where
g is the growth rate in dividends
P0 represents the current value (price today)
k represent the required return and
D0 and D1 represent the dividend paid today (D0) or the forecasted dividend next year (D1) respectively
Note: D0(1 + g) and D1 are the same thing. They both represent the forecasted dividend next year. The only difference is that sometimes you will be given the current dividend and sometime you will be given the forecasted dividend next year. Since the present value formula needs the forecasted dividend next year, D0(1 + g) just gives us that value based on the current dividend and the dividend growth rate.
Example: Common Stock Valuation Using the Constant Growth Model
For a quick example, consider a stock that just paid a dividend (D0) of $5.00 per share with dividends growing at a constant 4% per year. If my required return is 13%, what is the stock worth to me?
[latex]P_{0}=\frac{D_{0}(1+g)}{(k-g)}[/latex]
[latex]P_{0}=\frac{\$5.00(1+.04)}{(.13-.04)}[/latex]
[latex]P_{0}=\frac{\$5.20}{.09}[/latex]
[latex]P_{0}=\$57.78[/latex]
Three points on this model. First, while it may not look like the present value formulas that we did in Chapter Three, that is all it is. The constant-growth model is not magical; it’s just a special case of present value and could be used to find the present value of any cash flow stream that is growing at a constant rate. Second, growth rates rarely remain constant over time. However if growth rates are relatively stable, this can be a close approximation. Third, this model only works when the required return exceeds the growth rate. This is not usually critical as it is impossible to maintain a growth rate higher than the required return indefinitely, but if you try applying this model when the growth rate exceeds the required return, you will get a negative value – which does not make sense as stock prices will not fall below $0.00 due to the limited liability concept introduced in Chapter One.
Video Constant Growth
Supernormal (Non-Constant) Growth
This is where things get a little tricky. However, it is the most common situation. The solution is not a simple formula, but instead a three-step process.
The 3-step solution
- Step 1 – Forecast the dividends during the non-constant growth period up to the first year at which dividends grow at a constant rate.
- Step 2 – Once a constant growth rate is reached, use the constant growth pricing model to forecast the stock price. This stock price represents the PV of all dividends beyond the non-constant growth period.
- Step 3 – Discount the cash flows (dividends found in step one and price found in step two) back to year zero at the appropriate discount rate. This is the current value of the stock.
Example: Common Stock Valuation Using the Supernormal Growth Model
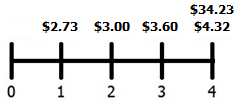
This is a tricky one, so again, let’s do an example. Consider a firm that just paid a dividend of $2.60. They plan to increase dividends by 5% in year one, 10% in year two, 20% in year three, 20% in year four, and then 3% per year thereafter. You feel that a 16% required return is appropriate. What is this stock worth to you?
Step 1 — Forecast the Dividends
D1 = $2.60*(1.05) = $2.73
D2 = $2.73*(1.10) = $3.00
D3 = $3.00*(1.20) = $3.60
D4 = $3.60*(1.20) = $4.32
D5 = $4.32*(1.03) = $4.45
Note: We stop in year five because that is the first year of constant growth. There is no need to forecast dividends any further since once they are growing at a constant rate (in the timeline below, you can see that after year 4, all dividends are growing at 3% per year through infinity), we can apply the Constant Growth Model discussed above which leads to Step 2.
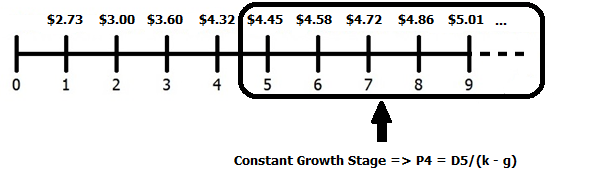
Step 2 — Use the Constant-Growth Model to Forecast Price
[latex]P_{4}=\frac{\$4.45}{.16-.03}=\$34.23[/latex]
Note: Be careful here as this is a confusing, but critical detail. When we apply the constant-growth model we use next year’s dividend to get this year’s price. Since we are using year five’s dividend, the first dividend of the constant-growth stage, it will tell us the price in year four – not year five. This price represents the present value of all dividends paid from year five and beyond as of year four.
Step 3 — Discount Cash Flows Back to Today
Use your financial calculator to find the net present value of the cash flows.
Calculator Steps to Compute NPV of the Uneven Cash Flow Stream:
| HP10BII | TI-BAII+ | TI-83/84 |
| Step 1: 2nd Clear All Step 2: 0 CFj Step 3: 2.73 CFj Step 4: 3.00 CFj Step 5: 3.60 CFj Step 6: 38.55 CFj Step 7: 16 I/YR Step 8: 2nd NPV ⇒ $28.18 |
Step 1: CF 2nd CLR Work Step 2: 0 ENTER ↓ Step 3: 2.73 ENTER ↓↓ Step 4: 3.00 ENTER ↓↓ Step 5: 3.60 ENTER ↓↓ Step 6: 38.55 ENTER Step 7: NPV 16 ENTER Step 8: CPT ⇒ $28.18 |
Go to APPS⇒Finance⇒ Step 1: Select npv( Step 2: Enter the given information npv(16,0,{2.73,3.00,3.60, 38.55} *Note that we do not need to put in the CF frequencies as they are all 1 Step 3: Press the SOLVE key |
Note: A couple of comments here. First, the year four cash flow ($38.55) represents both the year four dividend and the price in year four. If you try to enter them separately, the calculator will think the dividend comes in year four and the price in year five, giving you the wrong answer. Second, you may be wondering what happened to the year five dividend. The answer is that it is included in the year four price. To include it again would be double-counting. Remember what the year four price represents — the present value (as of year four) of all dividends paid in years five and beyond. Third, as with the first two models, this is just another application of time value of money, specifically present value. We forecast the cash flows and then discount them back to today.
Video Supernormal Growth Part 1
Video Supernormal Growth Part Two
Video Supernormal Growth Part Three
Video Supernormal Growth Part Four
MARKET EFFICIENCY
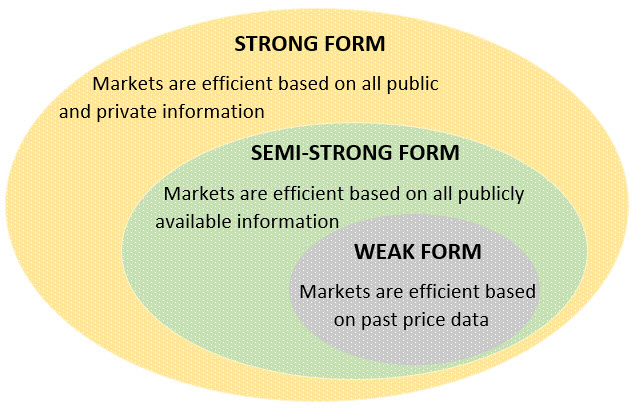
Markets are said to be efficient when prices of stocks accurately represent all currently available information. This means that we cannot determine which stocks are “good” and which are “bad”. All stocks are properly valued given what is known today. If they turn out to be “good” or “bad” in the future, it is due to information that has yet to be revealed. There are three types of market efficiency that are based on what is considered “current” information.
Weak Form Efficiency – Markets are efficient based on past price data
Semi-Strong Form Efficiency – Markets are efficient based on all publicly available information
Strong Form Efficiency – Markets are efficient based on all public and private information
For a more thorough analysis of market efficiency, see the Efficient Markets Hypothesis Handout in Appendix B.
Par Value vs. Book Value vs. Market Value
Par Value
The face value of each share of stock is stated on the stock’s charter. The only time this is a meaningful number is when the stock is initially sold for less than par value (which almost never happens). In this case, shareholders are liable for the difference in the event of bankruptcy. In today’s markets, newly issued common stocks often are issued with either no par value or a par value of $0.01. For example, a recent IPO by food delivery company Blue Apron had a par value of $0.0001 per share. Note that this discussion is focused on common stock. Par value for preferred stock is very different as the dividend is often based on par value for preferred.
Book Value
[latex]Book Value=\frac{Book Value of Assets - Book Value of Liabilities}{Number of Outstanding Shares}[/latex]
This tells us how much each share is worth on an accounting basis. The book value tends to understate the true value of a stock because the balance sheet focuses on historical value and (in most cases) omits the value of intangible assets (such as brand names, intellectual property, etc.) Also, historical value (purchase price less accumulated depreciation) does not factor in either the magnitude or riskiness of the expected cash flows those assets may generate.
Market Value
This is the most important measure of share value. It is the price at which you can buy or sell a share of stock. To get the market value of a stock at any time, you can use one of the many free stock quote services found online. One that we use frequently is Yahoo! Finance. When you look up a stock quote, you will need to use a ticker symbol. However, just start typing the name of the company in the quote box and (assuming it is a publicly traded company) the ticker symbol will show up on a list below. This is the value that we as managers are trying to maximize.
Rights and Privileges of Common Stockholders
Common stockholders have a right to the residual income of the firm. This means that any income generated beyond what is required to pay preferred dividends belongs to the common stockholders. This income may be distributed to common stockholders in the form of dividends or it may be reinvested in the firm.
Stockholders control the firm through the election of the board of directors and some other key corporate issues. However, this control is often limited through diverse ownership, institutional ownership, staggered boards (where only certain board members are elected each period), and dual-class shares where shares typically held by the public have limited voting rights.
Stockholders have the right to obtain information from management about the firm’s operations. This information is usually present on the Investor Relations page of a firm’s corporate web page. For example, see the Investor Relations page for Amazon.
Common stockholders can usually lose no more than the value of their investment, because they have no liability for the debts incurred by the firm beyond the value of the stock that they own. This is related to the limited liability aspect of corporations raised in Chapter One.
Common stockholder may transfer ownership of shares to other investors in the secondary market. These transfers are done at the current market price which is constantly changing.
STOCK VALUATION IN A NON-TEXTBOOK WORLD
There are more ideas, books, magazine/internet articles on stock valuation than you could read in a year if that was all you did. The two primary camps are fundamental analysis and technical analysis (although we have even seen stories about people making investment decisions based on planetary alignments – seriously!). Fundamental analysis deals with things like we are focusing on here and in other parts of this class. Looking at the company, industry, and economy to evaluate the company’s ability to generate cash flows and its risk levels to determine what a fair price would be to pay to buy a piece of that company. If the current market price is below that fair price, the stock is a “buy”. If the current market price is above that fair price, the stock is a “sell”. Many investors will use financial statement analysis, evaluate industry competitiveness, regulations faced by the company/industry, economic analysis, Price-Earnings ratios, and valuation models like illustrated in this class (although using a concept called free cash flows instead of dividends) to determine the fair value. This will include reading annual reports, listening to conference calls, evaluating how the firm is doing with new/existing products, looking at supply-chain cost issues, etc. to evaluate the company.
Technical analysis, on the other hand, attempts to evaluate supply/demand issues by looking at the stock price “action”. Specifically, technical analysts look at things like stock charts (graphs of the recent stock price) to look for trends, lines of support or resistance, patterns that might predict future movement, etc. They will also incorporate trading volume and other factors that try to gauge whether “smart” investors are accumulating or selling shares. If you get into technical analysis you will encounter things like candlestick charts, Fibonacci numbers, moving averages, and other terms.
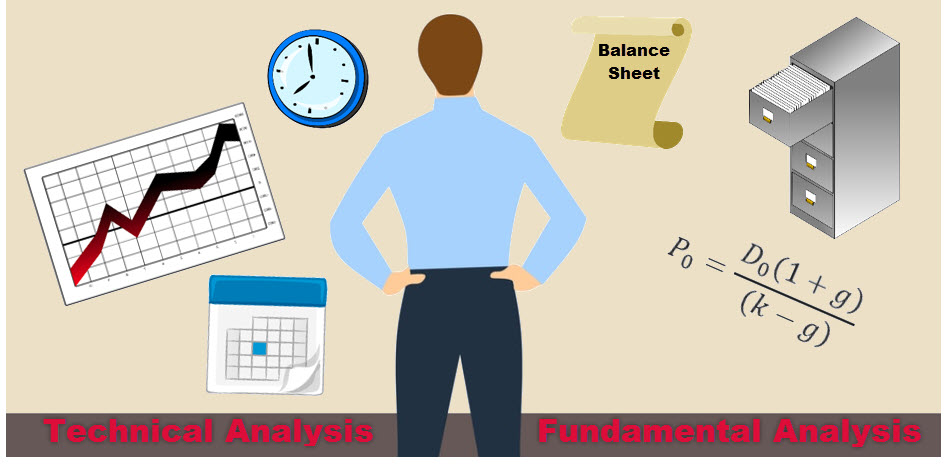
Which is the correct approach – fundamental or technical analysis? The answer depends on who you ask. However, we much prefer fundamental analysis as it has a better theoretical foundation for determining what a stock should be worth. However, it is important to remember the concept of market efficiency. Regardless of which approach you use, you should not expect easy riches to suddenly materialize. There are a lot of smart people constantly looking for undervalued stocks to buy and overvalued stocks to sell. In order to beat these other investors, you need (a) the ability to process information better than them, (b) the ability to process information faster than them, (c) access to information that they do not have – and remember it is illegal to trade on information that is not publicly available, or (d) to be lucky. The purpose of this chapter is NOT to make you a multi-millionaire stock trader (if it were that easy we would all be retired on our private islands). Instead it is to make you aware of the basic ideas behind stock valuation so that (a) you have a foundation to understand business news with respect to stock prices, (b) you understand what makes stock prices go up/down, (c) you can talk to a financial advisor and have an understanding of what he/she is talking about, and (d) if you are interested in investment analysis, you have a starting point to investigate further. Remember, any book, TV ad, Internet posting, etc. that offers you the secret to easy wealth from the stock market has a 99.999% chance of being a lie/scam.
Key Takeaways
The US stock market represents a total market capitalization as of 2020 of over $36 trillion and is about 86% larger than the US GDP. Prices for individual stocks range from relatively small (you can buy a share of Blue Apron for about $6.00 as of Janury 2021) to very large (a single share of Berkshire Hathaway Class A costs over $343,000 as of the same date). Since stocks represent an ownership claim on corporations, how do investors determine the fair value for each share? The answer is that stocks, like other financial securities, generate cash flows for their owners over time. Thus, the fair value of a share of stock is simply the present value of all expected cash flows that the stock will generate over its lifetime, discounted back to today at the appropriate risk-adjusted discount rate. What make this difficult is that the expected cash flows are not known and the lifetime is potentially infinite. Therefore, investors need to make assumptions about future growth rates and apply them to valuation models to determine prices. It is essential to note that the true underlying value of a stock is unknowable, and these models only provide approximations that are as accurate as our underlying assumptions. According to the Efficient Markets Hypothesis, the best estimate of the true value of a stock is that stock’s current market price. This is due to the current market price being the consensus of all individual attempts to determine the correct value.
Exercises
Question 1
How does the application of the three-step valuation process differ for stocks vs. bonds?
Question 2
Explain the difference between par value, book value, and market value for a common stock. Which is most important and why?
Question 3
What rights are granted to stockholders? Explain each.
Question 4
According to the stock pricing models we use in class, will I pay more for a stock that I plan to hold for 5 years than I will for a stock that I plan to hold for 2 years?
Question 5
In the Non-Constant (Supernormal) Growth model, we assume that dividends will grow at a constant rate forever after the non-constant growth period. Is this realistic? If not, why do we do so?
Question 6
What is meant by market efficiency? What are the three types of market efficiency?
Question 7
I carefully analyze the WSJ and other sources of publicly available financial information (annual reports, CNBC, Business Week, etc.). Over the past 10 years, I have earned a 13% average annual rate of return (without facing higher than average risk levels), while the overall stock market has earned a 9.5% average annual rate of return. Is this evidence in favor of or against semi-strong form market efficiency?
Question 8
Why are efficient markets considered a good thing?
Question 9
Why might we expect markets to be efficient? Why might we expect markets to NOT be efficient?
Problem 1
You have a preferred stock with an $80 par value. The stock has a required return of 7% and the dividend is 6% of par value. How much should you pay for this stock?
Problem 2
Stock A has an expected dividend (D1) of $3.50. The growth rate in dividends (g) is 4% and the required return is 13%. What is the price of this stock?
Problem 3
Stock C just paid a dividend (D0) of $2. The required return is 12%. Find the price of the stock when the growth rates are
3a. 0%
3b. 5%
3c. 10%
3d. 15%,
3e. Does your answer seem reasonable? Explain.
Problem 4
Price a supernormal (nonconstant) growth stock with the following information:
Current Dividend (D0) is $3.00
growth rate year 1 is 35%
growth rate year 2 is 25%
growth rate year 3 is 20%
growth rate years 4 through infinity is 10%
required return is 18%
Problem 5
Price a supernormal (nonconstant) growth stock with the following information:
Current Dividend (D0) is $1.50
growth rate year 1 is -10%
growth rate year 2 is 0%
growth rates years 3-4 are 20%
growth rate year 5 is 150%
growth rate years 6 through infinity is 3%
required return is 15%
Problem 6
If you planned to sell the stock described in Problem 5 immediately after the year 3 dividend was paid, how much would you expect to receive? (Assume the required returns and growth rates remain unchanged)
Solutions to CH 5 Exercises
Student Resources
Efficient Markets Hypothesis in Appendix B
Sample of Stock Information in Appendix B
Guided Tutorial for Stock Valuation in Appendix B
Videos
Preferred (No Growth)
Constant Growth
Supernormal Growth Part One
Supernormal Growth Part Two
Supernormal Growth Part Three
Supernormal Growth Part Four
Attributions
Image: Mixed from Businessman Calculating by mohamed hassan licensed under CC0
